Problem
You could have a blazingly fast SQL Server with enough memory and CPU, and fast disk, but if there is a network issue fingers still get pointed to ‘the database’. How can you use Windows Performance Monitor to look for network related issues that could be affecting perceived SQL Server performance?
Solution
We’ve looked at how to gather and review some general, memory related, and disk related Performance Monitor Counters. Now, we’ll look at some network related counters.
Objects / Counters
The following table has a list of Perfmon Objects / Counters related to network performance with their descriptions and a guide of expected values. As with any Perfmon data we’re using the output as a benchmark. It’s not a direct link to a certain problem but the data is useful to see when we need to see what areas to start looking at and to see what changes improve, or hopefully not degrade performance.
| Perfmon Object | Perfmon Counter | Counter Description | What to Look For |
|---|---|---|---|
| Network Interface | Bytes Received/sec | Bytes Received/sec is the rate at which bytes are received over each network adapter, including framing characters. Network Interface\Bytes Received/sec is a subset of Network Interface\Bytes Total/sec. | Baseline or higher |
| Network Interface | Bytes Sent/sec | Bytes Sent/sec is the rate at which bytes are sent over each network adapter, including framing characters. Network Interface\Bytes Sent/sec is a subset of Network Interface\Bytes Total/sec. | Baseline or higher |
| Network Interface | Bytes Total/sec | Bytes Total/sec is the rate at which bytes are sent and received over each network adapter, including framing characters. Network Interface\Bytes Total/sec is a sum of Network Interface\Bytes Received/sec and Network Interface\Bytes Sent/sec. | (Network Interface(n)\Bytes Total/sec ÷ Network Interface(n)\Current Bandwidth) *100 should be less than 90 |
| Network Interface | Current Bandwidth | Current Bandwidth is an estimate of the current bandwidth of the network interface in bits per second (BPS). For interfaces that do not vary in bandwidth or for those where no accurate estimation can be made, this value is the nominal bandwidth. | (Network Interface(n)\Bytes Total/sec ÷ Network Interface(n)\Current Bandwidth) *100 should be less than 90 |
Add Counters
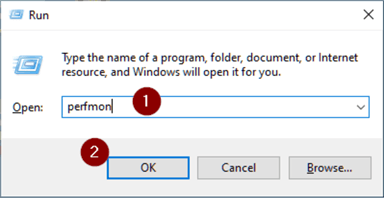
Windows Key + R: to open the Run menu.
- Enter perfmon in the run box
- OK
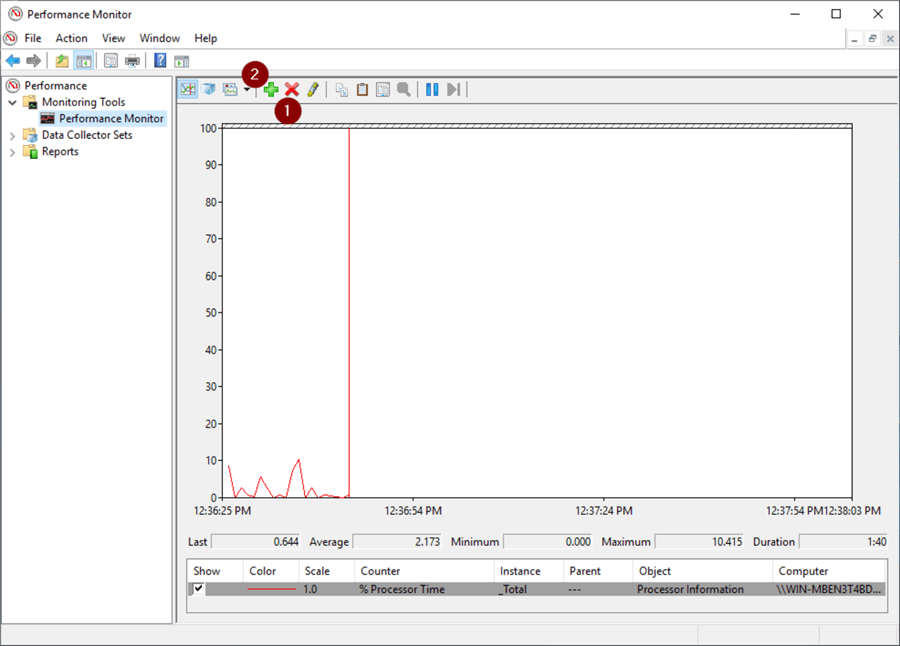
Click the ‘X’ symbol to remove default % Processor Time counter (This is an optional step. I just find it easier to have as clean an output as possible.)
- Click the ‘plus symbol’ to bring up ‘Add Counters’ screen and start adding counters
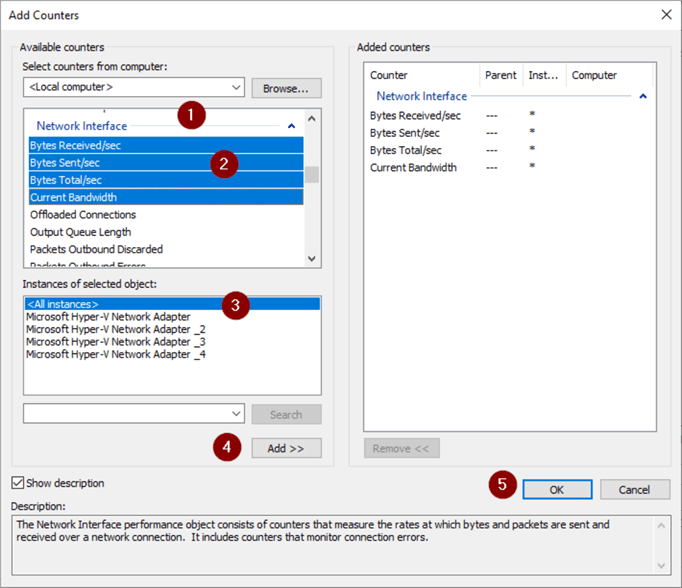
- Scroll to and click the Network Interface dropdown in the Perform Objects box
- Select Bytes Received/sec
- <All Instances>Select drives
- Add
- Click OK
Create Collector Set
To save the added Counters we’ll save them to a Collector Set. This will let run the Counters without having to re-add them and also run on a schedule.
- Right click Performance Monitor
- New
- Data Collector Set

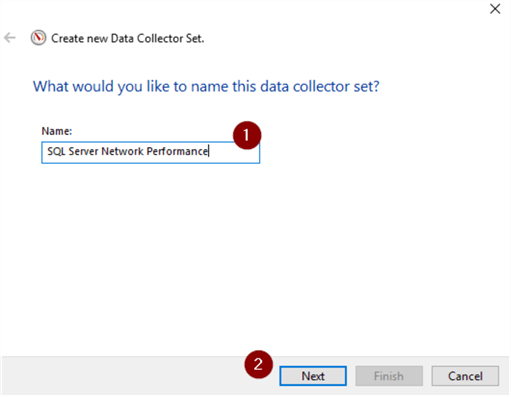
- Enter a name (I chose SQL Server Network Performance, but you can call it anything that makes sense to you.)
- Next
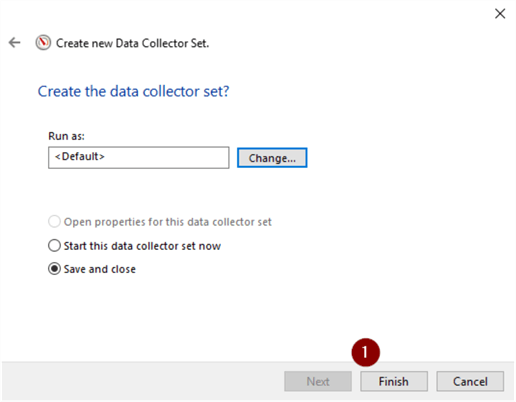
- Accept or change directory
- Finish

- Finish
Run Collector Set
Run the Collector set to start gathering data.
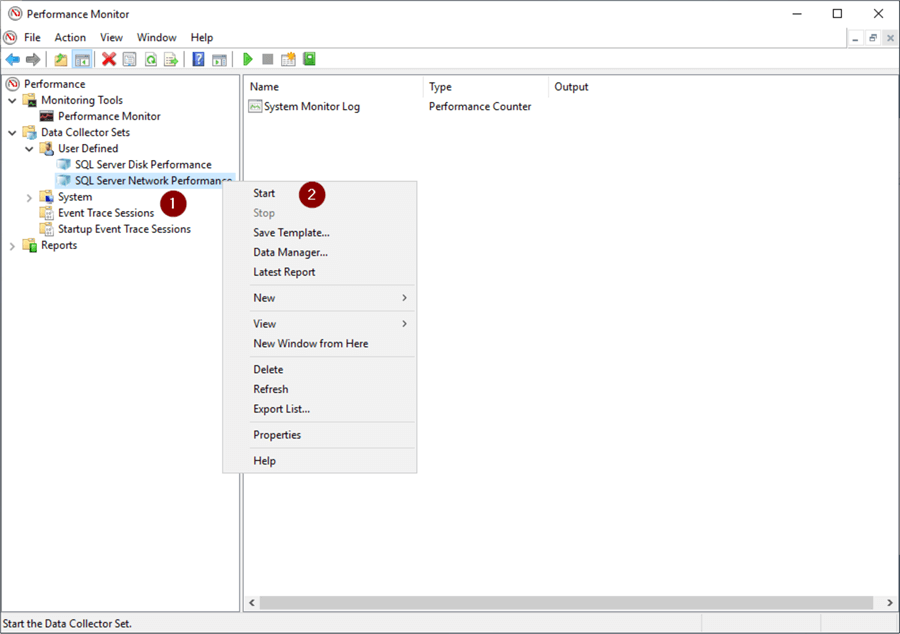
- Expand User Defined dropdown
- Right click on Collector Set
- Properties

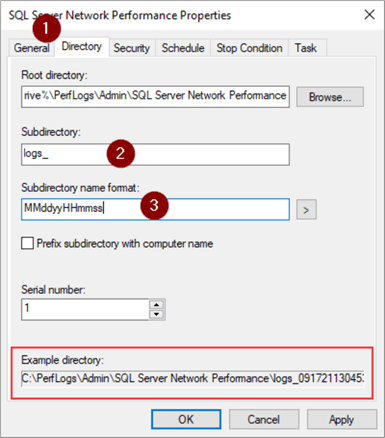
- Directory tab
- Enter name of subdirectory
- Enter MMddyymmss in ‘Subdirectory name format:’ files (This will let you create a new file for every time the Collector Set is run. Otherwise, you’ll get an error saying ‘When attempting to start the Data Collector Set the following system error occurred: Cannot create a file when that file exists.’).
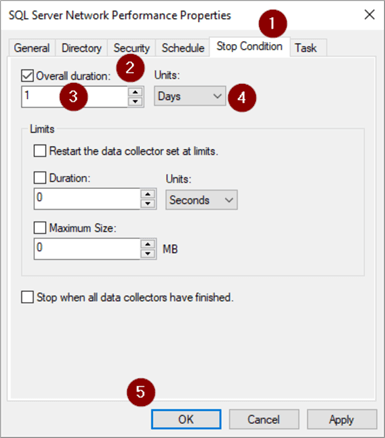
We’re going to manually start the Collector Set so just need to tell it how long to run.
- ‘Stop Condition’ tab
- Check ‘Overall duration’
- Select number of units to run
- Select units to run
- OK
- Right click on Collector Set
- Start
Save Collector Set to Template
To be able to import the Collector Set to another Windows machine we can save it to a template.
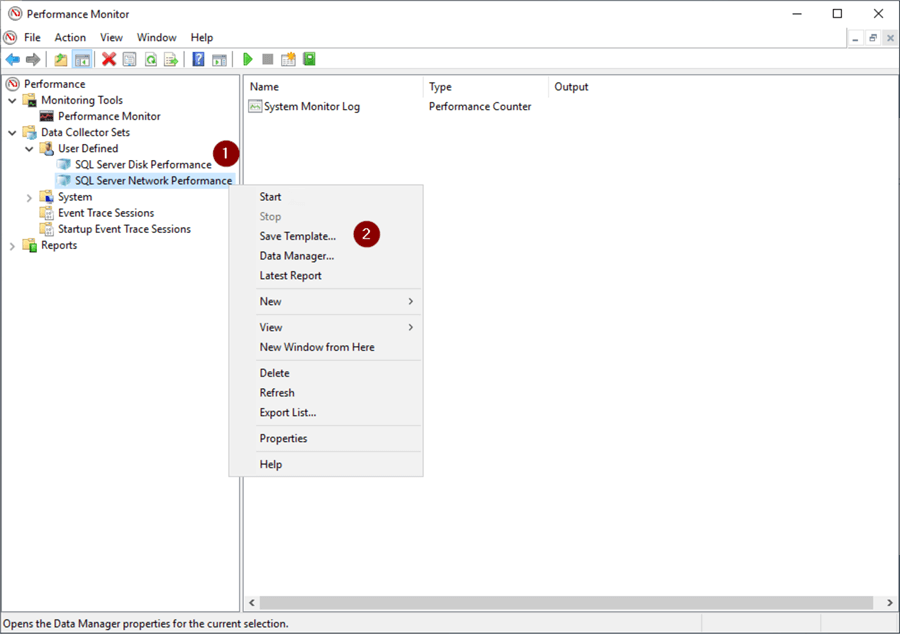
- Right click on Collector Set
- ‘Save Template’
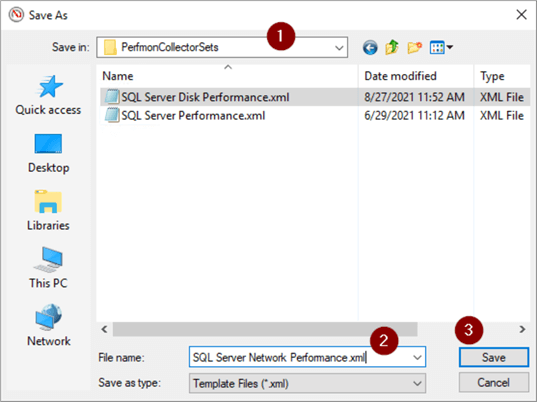
- Select file location
- Name file
- Save
View Performance Data
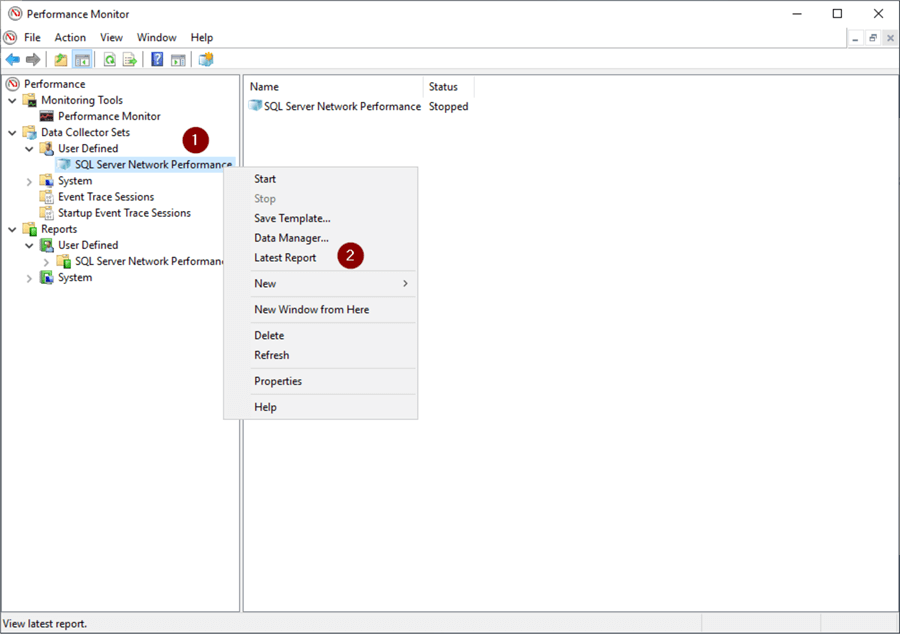
24 hours have passed and it’s time to view the performance data.
- Right click on Collector Set
- Latest Report
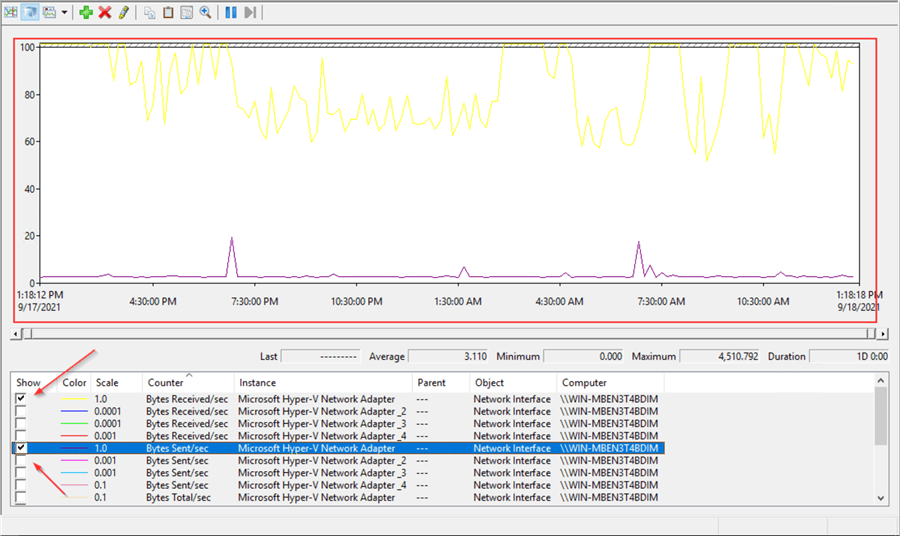
The graphical representation of the data is in the top part of the window and we can click on each Counter and drive to get data for each in the bottom.
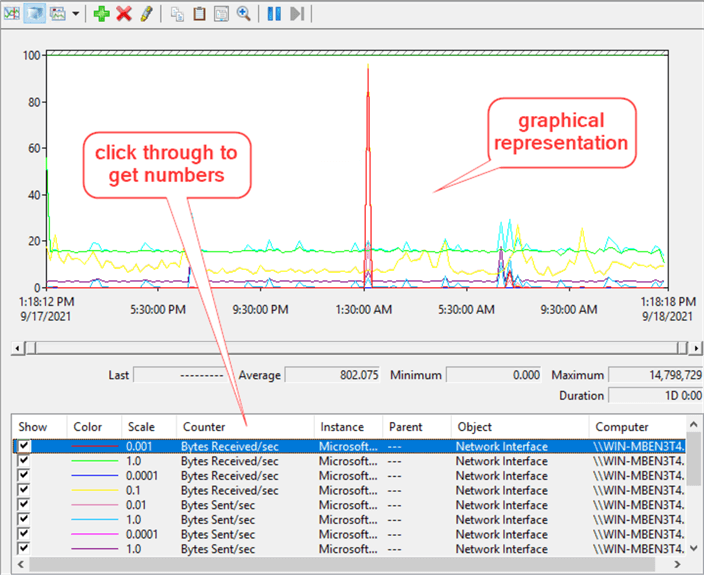
Here, I’ve unchecked all but Bytes Received/sec and Bytes Sent/sec for Instance Microsoft Hyper-V Network Adapter for comparison.
This gives us a short baseline for a 24-hour period. Overall, we would like to see the counters at or above the baseline.
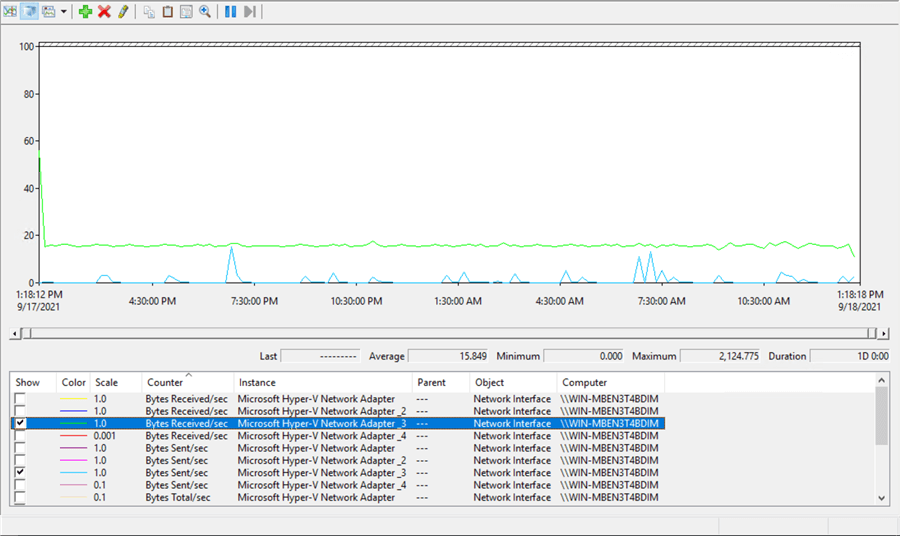
The same can be done for each Instance.
Here, we’ll calculate our threshold for the Microsoft Hyper-V Network Adapter. The Average Bytes Total/sec = 96.853 and Average Current Bandwidth = 1,000,000,000
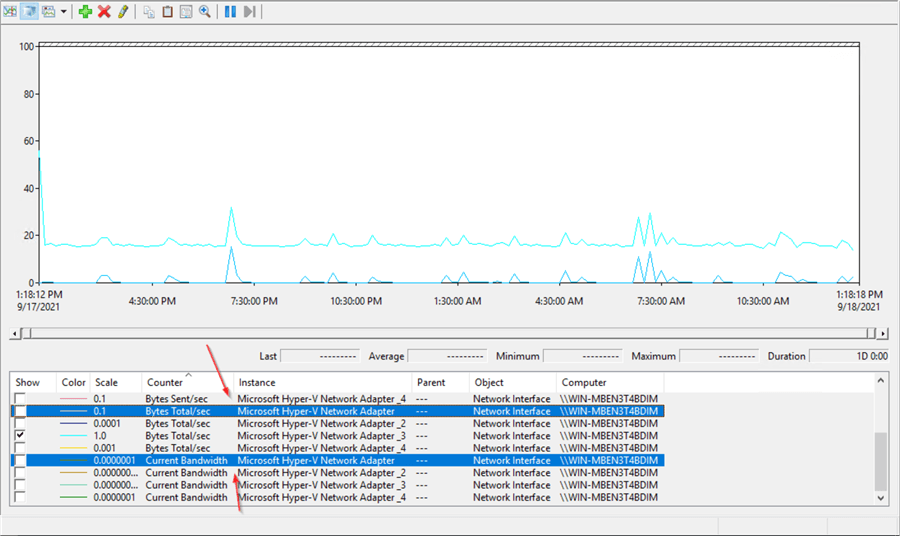
Apply the numbers in the formula: (Network Interface(n)\Bytes Total/sec ÷ Network Interface(n)\Current Bandwidth) *100.
(96.853 ÷ 1,000,000,000) *100 = 0.0000096853 which is well below the threshold of 90.
View Perfmon Data in an Excel Spreadsheet
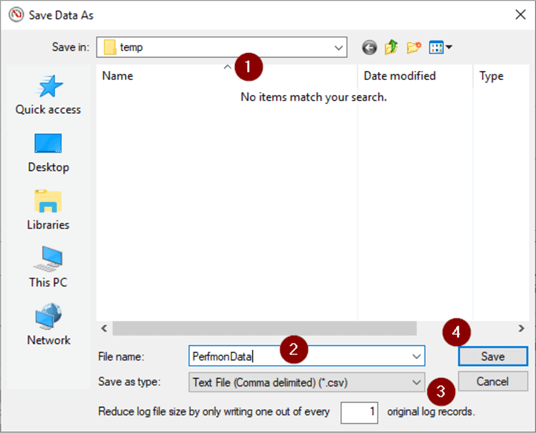
We’ll export our Counter data to a .csv file as we’ve done before to be able to view and analyze it in a spreadsheet. Export the data collected to a .csv file.
- Right click anywhere
- Save Data As…
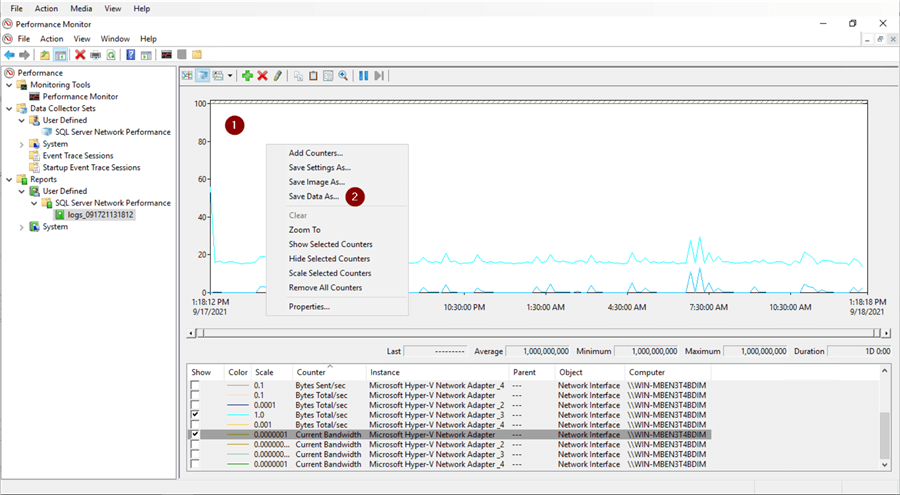
- Choose file location
- Name file
- Select ‘Text File (Comma delimited)(.csv)’ in dropdown
- Save
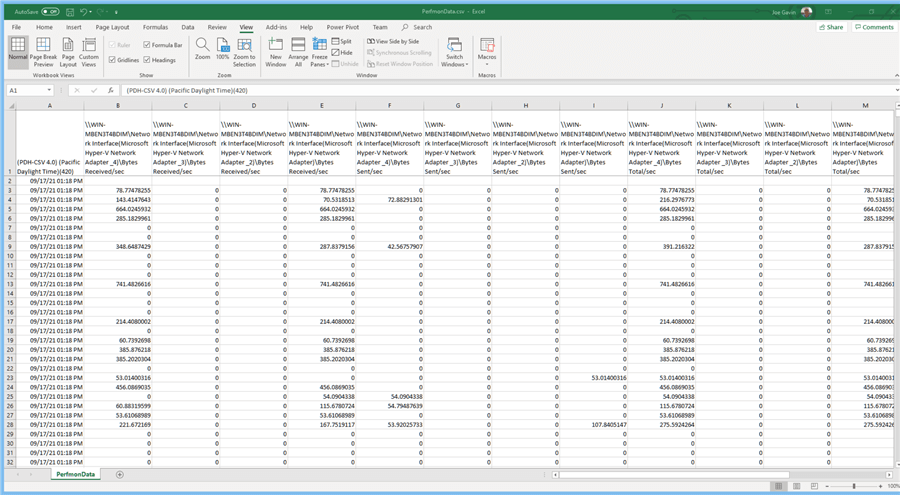
Made the following formatting changes to make it more readable:
- Format of the first column to a time format
- Top row Alignment to Word Wrap
- Made all columns the same width
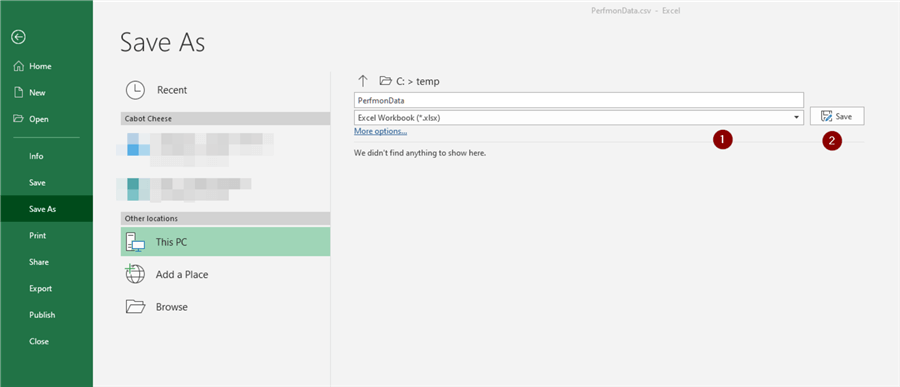
File -> Save As
- Choose Excel Workbook (*.xlsx) in dropdown
- Save
Next Steps
So far, in this and previous tips we’ve seen how to analyze some basic disk related Perfmon data, specific memory related data, specific disk related data and now specific network related data.
Here are some links with further information:
- Windows Performance Monitor Tutorial
- Introduction to Windows Performance Monitor for SQL Server
- SQL Server Performance Tuning for Each Layer of an Application
- Create Windows Performance Monitor Counter Alert from Data Collector
- Windows Reliability and Performance Monitor to Troubleshoot SQL Server
- Monitor Performance Counters using PowerShell in SQL Server Agent Job Step
- Storing Windows Performance Counter Values in SQL Server

Joe Gavin is from Greater Boston and has worked in technology as a Field Service Engineer for an automotive dealer computer system vendor, a Technical Consultant and Operations Analyst with Sybase and SQL Server based database applications in financial services and now works as a SQL Server Database Administrator.
- MSSQLTips Awards:
- Achiever Award (75+ Tips) – 2024 | Author of the Year – 2021 | Author Contender – 2024 |
- Rookie Contender – 2018


Thanks for sharing. I believe that Bytes/sec needs to be multiplied by 8 to get to bits. Seems like current bandwidth is in bits and not bytes.