Problem
More and more things are being automated for faster delivery and this is also true with Power BI. In this article we look at how to automate the creation of a new Power BI report based on the dataset.
Solution
When working with Power BI on a daily basis, sometimes report developers miss the opportunity to utilize a newly available function that can help out when a “quick” report needs to be developed. In the past you would have to install and fire up Power BI Desktop and go through a significant design process. The process would include establishing data sources and transformation models along with determining the best visuals which are placed on the design grid. Once the design was finished, that Power BI file would need to be published to the Power BI Service on the web. Such a process would be a fair number of steps to achieve a quick report. However, with a recent upgrade to Power BI, this whole process can be curtailed to a simplified process to establish a quick dashboard with visuals related to a dataset.
Normally, in this section of the tip, a description on installing Power BI Desktop would be provided, but for this particular tip that install is not needed. However, it would be recommended that installing Power BI Desktop would be advantageous for any dashboard developer. You can download the latest version of Power BI desktop in order to follow along with the examples.
For this tip, we actually will utilize the Power BI Service to complete the tasks described in this tip. Thus, you will need access to the Power BI Service through either a work or school account.
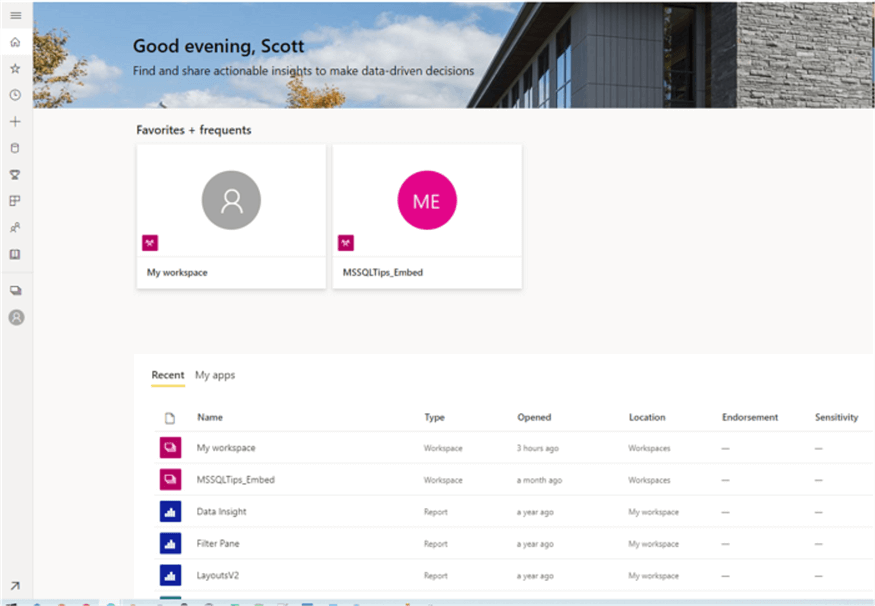
From the main Power BI home page, two options are available for creating a new report online, via the Power BI Service. Either the “+” plus sign Create button on the left menu can be selected or the “+ New report” button can be selected in the upper right menu.

Both get you to the same place, which is the Add data to get started (Preview) screen shown below.
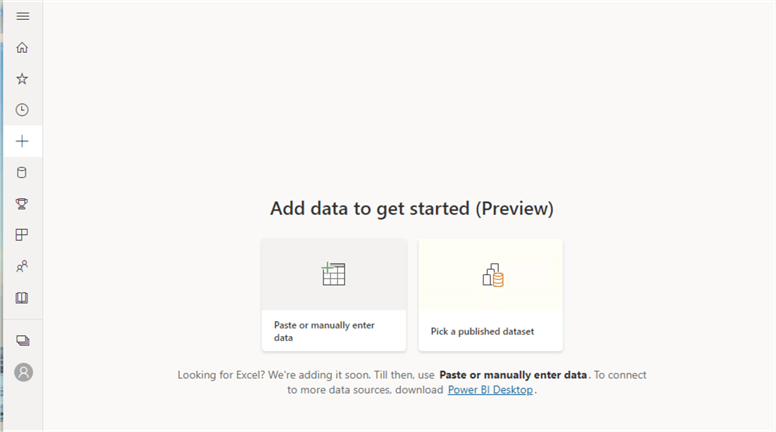
Currently only a few options are available to get your data into the report:
- You can copy and paste your data set into the entry screen
- You can manually enter the data into the entry screen
- You can select a currently published dataset
However, only the manual entry or cut and paste method allows for the auto generation of the dashboard report. Using the “select currently published dataset” will generate a blank report.

Thus, using the enter data manually option opens a data entry grid which also for copy and paste or simply manually entry of the data. Notice the three options available on the design grid. The top dropdown box allows for defining the first row as the header for the table.

For the rows and columns, clicking on the + buttons as either rows or columns respectively. Furthermore, the column name can be changed by double clicking on the column name.
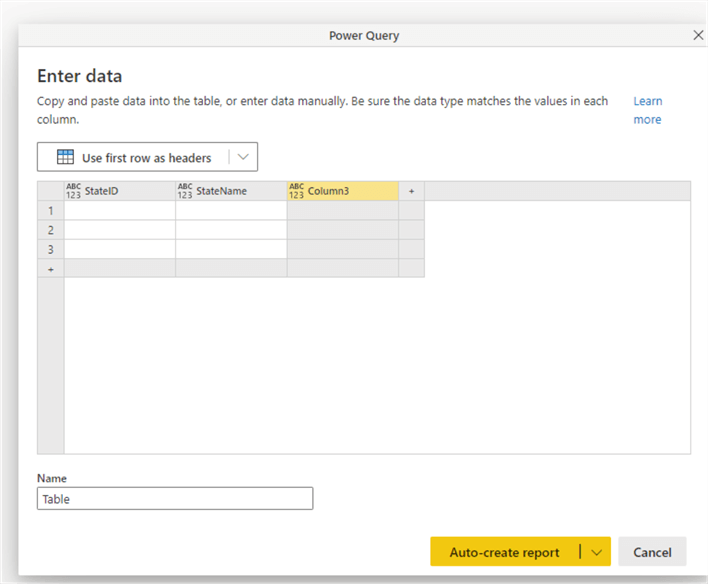
Likewise, the column data type can be adjusted by clicking on the ABC123 button on the left side of each column header. This change can be very helpful as it keeps the data consistent while also preventing certain typing and conversion of data types errors.

In any case, navigating the grid is similar to Microsoft Excel. Using the enter key moves the current cell down one cell. Similarly, the data entry can move side to side by using the arrow keys to move left and right.
One final note about the design grid, be sure to name your table something appropriate and contextually sound and logical; this is the name of the dataset that users see.

Copy and paste works equally well, but you will need to be careful copying in large amounts of data. For the dataset copy, the sample financials data is used, and can be downloaded from: Download the Financial Sample Excel workbook for Power BI – Power BI | Microsoft Docs.

Be sure to not have a cell selected; if you do, the copy / paste will put all the data in a single cell.

A second issue that you can run into pertains to the data types. Power BI allows the dashboard designer to change the data type to something that does not match the actual data in the column(s).

As shown below, the product field allowed the selection of whole number for the Product column which contains alpha characters.
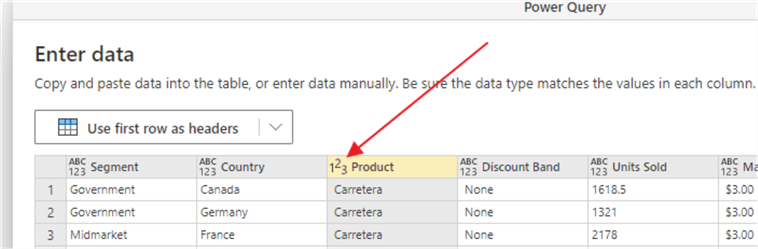
Only upon clicking the Auto-create report button, does an error appear. One impressive feature of the error message is it at least it provides row numbers where the errors could be occurring. That can be helpful if the number of problem rows is very small (one or two for instance) in a very large data set.

Three options are available once the data set has been copied in or manually entered for the creation of the report. We are focusing on the Auto-create option. The create a blank report option is similar to the design experience in Power BI desktop while the create a data set only option will add the dataset to available datasets on the service.

Clicking on the Auto-create report, creates and opens the newly designed with a set of suggest visuals. You can see in the screen print below that Power BI created 8 visuals, six column charts and 2 cards in the upper right corner. Notice in the bottom right corner, that the Preview status is highlighted. Power BI makes certain assumptions about the data to provide the initial list of charts.

The powerful feature here is that the newly designed report allows for the addition of other charts and will make the changes automatically. For instance, if Discount Band is select from the field list, a new set of charts is added on the right side with the sum of units sold and sum of COGS all by Discount Band. In this case, Power BI knows that Discount Band would be a category field.

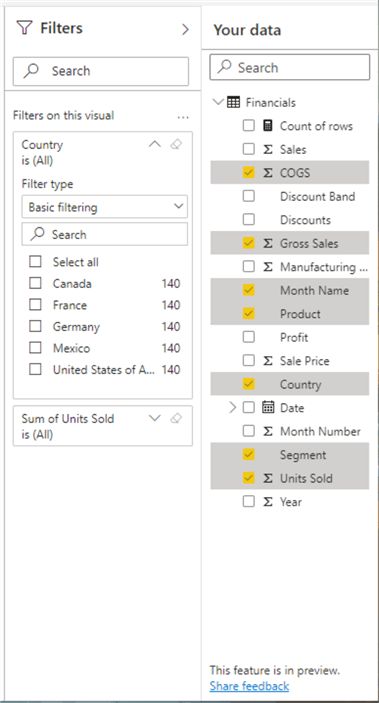
Similarly, unchecking a field will remove the related charts to that field. In the illustration below, country was removed.

In the above, examples, categories were added or removed. New measures can also be selected which would add a whole new row of charts. Thus, using the below example, the Gross Sales measure is selected, and a new set of 3 charts based on Gross Sales is added, plus a new card at the top of the dashboard is added.

However, if you attempt to add a 4th measure, the error shown in the following screen print results. Power BI currently only allows 3 measures (rows) and 4 categories (columns). Trying to add fields beyond those numbers will result in an error.

Additionally, you will notice on these screens you have limited editing capabilities including not being able to make formatting change or changes to the field lists on a particular visual. Filters and sorting can be applied to the visuals, though.
When you are satisfied with the report, clicking on the save button save the report and the report will automatically be saved to your workspace area on the Power BI Service.


Even with the report saved, the interchanging of categories and measures still can be made by dashboard designers AND dashboard viewers and these changes can be saved by report designers. This dashboard is considered to be using the summarize pane.
Also, at this point, the report can be edited similar to any other report. However, you will receive the below warning. The warning is basically telling you that once you switch to edit mode, the Auto-created Summarize pane options will no longer be in effect and each visual must be modified on its own (like you would do in other reports).

In this tip, we reviewed the process of allowing Power BI to Auto-Create a report for you based on data input or copied into a new dataset. Currently, this method is the only supported option for entering data, but other options are expected in the future for this preview feature.
Next Steps
- All Power BI Tips – SQL Server Power BI Tips
- Create Power BI Dashboard from SharePoint – Create Power BI Reports from a SharePoint Online Library (mssqltips.com)
- Create your First Power BI Dashboard – How to Build your First Power BI Dashboard (mssqltips.com)

I have a passion for crafting Business Intelligence Solutions for my user groups. My experience includes almost 15 years of SQL Server involvement with the last 12 years focused specifically on Business Intelligence, SharePoint, OLAP, SSRS, and Decision Support solutions. Currently, I am a Business Intelligence Architect in the healthcare industry, and I also teach database and analytics classes for Kennesaw State University, Southern New Hampshire University, and Reinhardt University. My education includes an MBA and an undergraduate in Accounting (yes I am a reformed accountant!), both from Kennesaw State University. I enjoy every day by trying to grow my faith and spend precious time with my family. I have been happily married to my wife of over 20 years, and we have two teenagers one who we home school with the help of a University Model School, Cornerstone Prep in Acworth, GA (cornerstoneprep.org). Our other child is a Construction Management major at KSU’s Southern Poly / Marietta campus. We are a soccer and Cross Country (XC) family who play, coach, and referee soccer or run for fun most every day. For several years, our family has volunteered (and played with the dogs and cats) at Etowah Valley Humane Society in Cartersville, GA.
- MSSQLTips Awards: Champion (100+tips) – 2016 | Author of the Year – 2015 | Author Contender – 2014, 2016-2021


