Problem
Azure Data Factory is a very popular extract, load and translate tool (ELT). The copy activity is at the center of this design paradigm. Many citizen data engineers have experience with Power Query. The mash-up editor allows the citizen to create code free transformations on the data.
How can we leverage existing knowledge of Power Query to bring transforms to standard ADF pipeline?
Solution
Microsoft has announced the general availability of the Power Query activity in October of 2021. This feature has been in preview since 2019. In the past, it was referred to as wrangling data flows. How does Power Query execute in the existing pipeline framework that is available with Azure Data Factory?
I am going to use a quote from on-line documentation that sums up how the M code executes.
“Data Factory translates M generated by the Power Query Online Mashup Editor into spark code for cloud scale execution by translating M into Azure Data Factory Data Flows. Wrangling data with Power Query and data flows are especially useful for data engineers or ‘citizen data integrators ‘.”
Today, we are going to explore how to use this activity in a pipeline that reads a WEB table, cleans up the data, and writes it into a SQL table.
Business Problem
January is a fun time for Football fans in the United States. The AFC and NFC playoffs take place during the month of January with teams’ competing for a spot in the Superbowl championship in early February. Today, the best six teams of the two conferences make it to the playoffs. The wild card or 1st round of the playoffs is used to pick two winners out of teams ranked 3 to 6 in each division. The two winners from each divisional round go to the conference championship or 3rd round. The two conference champions compete in one final game for the title of Superbowl winner. Please see Wikipedia for some history around the post season playoffs.
Our manager has asked us to create a simple prototype to demonstrate how new Power Query activity can be used to clean up (transform) data from this Wikipedia page. This proof of concept (POC) will be created using Azure Data Factory.

The above image shows how information will flow from the web table in Wikipedia to the database table in SQL Server. Because spark is at the heart of the Power Query activity, an intermediate step must be used. Raw data will be landed saved in the bronze quality zone of a data lake. The refined (cleaned-up) data from our Power Query activity will be saved in the silver quality zone. We will use three separate pipelines during our prototype phase for each step of the data flow. Once we have a handle on this new control, we will combine the activities into one final pipeline.
Source Linked Service and Data Set
Before we can start developing a pipeline, we must define both the source and target linked services and data sets. The image below shows how objects are built upon each other to provide the final pipeline solution.

The first step is to define the source linked service. Use the manage icon within the Data Factory Studio to get access to the linked services screen. Please hit the new + icon to create the new definition. The image below shows that the web table is the correct object to create. One professional tip is to use the search button to find the correct linked service to create. I did a search on “we” which brought up two results. It is important to note that only a self-hosted integration runtime (SHIR) can access a table located on a web page. This will not work with the default Azure Integration Runtime.

It is good practice to follow a naming convention when defining the objects with Data Factory. The image below shows the newly created linked service called LS_WEB_TABLE_WIKIPEDIA that points to the correct WIKIPEDIA page for Super Bowl information. Since this page is open to the whole world, we are using anonymous authentication. Please note that my self-integration runtime is named SHIR-01. Another professional tip is to always check the connection by testing. To complete the task, save the newly created object and publish if necessary.

The second step is to define the source data set. Use the author icon to access the factory resources. Click the new + icon to create a new dataset. Please select the web table as the source type.

Please save the dataset without testing. The reason behind this request is the fact that the web page has multiple WEB (HTML) tables. The image below shows the index selection on the web page to be [1]. I found this out by examining the HTML source code behind the page using my web browser. Check out this article on how to find this out using various web browsers. It is important to document your work by using the description area of all objects you create. The name of the new source data set is DS_WEB_TABLE_SUPERBOWLS. To complete the task, save the newly created object and publish if necessary.

The preview data button can be used to unit test the data set. The image below shows the results pulled in from the web page. There is a lot of clean up to be done on the columns in the table. It was decided that the last two columns in the table are not important and should be dropped from the data set.

Now that we have defined the source objects, we need to define the destination objects. However, at this point the Azure SQL server, Azure SQL database, and Azure SQL table do not exist.
Destination Database and Table
I already have a logical Azure SQL Server named svr4tips2020. This object has existed in my subscription for at least 2 years. I can connect to the server using SQL Server Management Studio and execute the following code to create a new database called dbs4tips2022.
-- Which database to use.
USE [master]
GO
-- Delete existing database
DROP DATABASE IF EXISTS [dbs4tips2022]
GO
-- Create new database
CREATE DATABASE [dbs4tips2022]
GO
Next, I want to create a schema called stage. Execute the following code in a SSMS query window to accomplish this task.
-- Which database to use.
USE [dbs4tips2022]
GO
-- Delete existing schema
DROP SCHEMA IF EXISTS [stage]
GO
-- Create new schema
CREATE SCHEMA [stage] AUTHORIZATION [dbo]
GO
To finish the task, we want to create the table to hold the Super Bowl data in the stage schema. Please execute the code below to create our target table.
-- Which database to use.
USE [dbs4tips2022]
GO
-- Delete existing table
DROP TABLE IF EXISTS [stage].[superbowl]
GO
-- Add new table
CREATE TABLE [stage].[superbowl]
(
  [game] nvarchar (8) NULL,
  [date] datetime NULL,
  [winning_team] nvarchar (32) NULL,
  [score] nvarchar (16) NULL,
  [losing_team] nvarchar (32) NULL,
  [venue] nvarchar (32) NULL,
  [city] nvarchar (32) NULL,
  [attendance] nvarchar (8) NULL
)
GO
Please repeat the above tasks to create an active schema and corresponding table. The image below shows the results. Was executing the create database statement without any options a wise thing to do?

By default, a database will be created with Virtual CPUs using the General-Purpose tier. As a result, this database for a quick proof of concept (POC) would cost us $380 dollars a month or $4560 per year. Please see image below.

What happens if we leave this database deployed after the proof of concept? Our boss would not be happy about the monthly charge. Is there a better tier to use for testing new ideas? That is where the serverless computing tier shines. When we use the database or Virtual CPUs, we get charged for the hours that we use, not by the month or year. Yes, there is a cost for storage, but it is only $5 per month. See image below for details.

Now that we have a destination database and table, let us define the destination objects in Azure Data Factory in the next section.
Destination Linked Service and Data Set
The first step is to define the destination linked service. Use the manage icon within the Data Factory Studio to get access to the linked services screen. Please hit the new + icon to create the new definition. The image below shows that the Azure SQL Database is the correct object to create. I used the search button to find the correct linked service to create. A search on the word “azure” which brought up eight results and I picked the correct object from the list to create.

The image below shows the options for the new linked service. The options that I used to create the destination linked service are the following: LS_ASQL_TIPS_2022 is the name of the object, the auto resolve integration runtime is the computing power, the server and database names were chosen from the current subscription, and the managed identity was used as the authentication method. When possible, use a managed identity to get out of password maintenance cycle. Make sure you test the connection before moving on. Any errors will be related to either the server firewall or access privileges to the database. Resolve them to get a successful connection.

The second step is to define the destination data set. Use the author icon to access the factory resources. Click the new + icon to create a new dataset. Please select the Azure SQL Database the source type.

Use the settings dialog box to configure the data set. Then choose to name the data set DS_ASQL_TABLE_SUPERBOWLS. It is using the linked service we previously defined above and it points to the [stage].[superbowl] table.

Again, it is very important to document your work by using the description text box. We could parameterize the schema and table names if we think there is going to be re-use of the data set. For now, the information is hard coded in the text box.

The final step is to preview the destination data set. We can see that the Azure SQL Database table is currently empty.

Copy WEB table to ADLS file
The first leg of the data flow (information journey) is to read the source data from the WEB page and write this table information to a CSV file in the raw zone of the data lake. This action is required since a WEB TABLE as a source is not supported by Wrangling Data Flows (Power Query Activity). We are going to try using the first format in the list that is supported by ADLS Gen2 connector.

Please create a new pipeline called PL_COPY_WEB_TABLE_2_ADLS_FILE, drag over the copy activity onto the canvas and name the object ACT_MT_CPY_WEB_TABLE_2_ADLS_FILE. The next few paragraphs go over how to configure the activity. I am giving the integration engine 5 minutes to copy the data and 1 retry attempt if the copy action fails. This might be overkill for this activity, but why not give the engine time to grab the data?

The source data set is the web table that we defined earlier. The image below shows the name chosen from the drop-down box.

I am assuming you know how to create both a linked service and data set for a CSV file. If not, please refer to my prior article that goes over supporting multiple file formats in Azure Data Lake using Azure Data Factory. The DS_ADLS2_BRONZE_CSVFILE_SUPERBOWLS data set points to a CSV file named games.csv located in the /bronze/superbowl directory. The sc4tips2021 container resides within the sa4tips2021 storage account. The image below shows the sink (target) being set to this data set.

Please test the pipeline by clicking the debug button which tells the self-hosted integration engine to execute the code. The image below shows a successful execution.

If we browse to the ADLS Gen 2 container, we can download the newly created CSV file. What is going on with the directory location and storage container name seen below? I am cleaning up my MSDN subscription and consolidating storage accounts. Therefore, this image reflects that change.

The image below shows the CSV file stored in my sub-directory and currently opened in my favorite editor, notepad++. Here is the spoiler alert. The fields that are pulled from Wikipedia have carriage returns (#cr) and line feeds (#lf) in the CSV (ASCII) formatted file. These characters will cause issues with the default settings of the Spark Engine that executes the translated M language code. Therefore, I suggest using a parquet (binary) formatted file for the final program to work.

Now that we have the data stored in the bronze quality zone of the data lake, we can start to create the Power Query script to execute in the ADF activity.
Transform CSV file with Power Query
The second leg of the data flow (information journey) is to read the raw data from bronze quality zone, to transform the data using the Power Query (script) activity and to write this information to a CSV file in refined quality zone of the data lake. Please see documentation for details.
Please create a new pipeline named PL_TRANS_CLEANUP_CSVFILE, drag over the new Power Query activity onto the canvas and name the object ACT_PQ_FLOW_SUPERBOWL. Since wrangling data flows (Power Query Activity) run under a spark engine, we need to pick a compute size. For now, please choose the default settings.

Please skip to the sink section of the activity. Click the add button to start defining the Power Query transformations. The image below shows sink settings in which the output from the Power Query is mapped to a CSV file in the refined quality directory in the data lake. This data set is called DS_ADLS2_SILVER_CSVFILE_SUPERBOWLS.

The first action to perform within the online Power Query interface is to add a source data set. I am using the data set named DS_ADLS2_BRONZE_CSVFILE_SUPERBOWLS. By default, all rows and columns will be loaded into our familiar interface. If you are Power BI report designer, you should be right at home.
We can see that the field named Game has unwanted characters at the end of the string. One common design pattern in the Power Query interface is to split a column into two fields on the delimiter. The first field contains the clean data while the second field is tossed away. The image below shows this action being performed on the Game field using the [ character.

The image below shows the results of our action. While the online graphical interface understands the chosen action, the underlying Spark Engine does not support the syntax for data wrangling. Please see on-line Microsoft documentation for which transformation functions are supported.

The data that is coming from the Wikipedia website is considered text. The destination of the data in this example is a database. We might want to transform the human readable date of January 15th, 1967, to 01/15/1967. The image below shows the conversion of a string from text to date as not being supported.

I am well versed in using the M language. Using the supported functions found in the documentation as reference, I came up with the following script that will transform our data. Please use the advanced editor feature to replace the existing script with this one.
let
  Source = DS_ADLS2_BRONZE_CSVFILE_SUPERBOWLS,
  Step01 = Table.SelectRows(Source, each [Losing team] <> "To be determined"),
  Step02 = Table.ReplaceValue(Step01, "#(cr)#(lf)", " ", Replacer.ReplaceText, {"Game"}),
  Step03 = Table.ReplaceValue(Step02, "50", "L", Replacer.ReplaceText, {"Game"}),
  Step04 = Table.ReplaceValue(Step03, "#(cr)#(lf)", " ", Replacer.ReplaceText, {"Winning team"}),
  Step05 = Table.ReplaceValue(Step04, "#(cr)#(lf)", " ", Replacer.ReplaceText, {"Losing team"}),
  Step06 = Table.ReplaceValue(Step05, ",", "", Replacer.ReplaceText, {"Attendance"}),
  Step07 = Table.AddColumn(Step06, "game", each Text.Trim(Text.Start([#"Game"] & "[", Text.PositionOf([#"Game"] & "[", "[")))),
  Step08 = Table.AddColumn(Step07, "date", each Text.Trim(Text.Start([#"Date/Season"] & "(", Text.PositionOf([#"Date/Season"] & "(", "(")))),
  Step09 = Table.AddColumn(Step08, "winning_team", each Text.Trim(Text.Start([#"Winning team"] & "(", Text.PositionOf([#"Winning team"] & "(", "(")))),
  Step10 = Table.AddColumn(Step09, "score", each Text.Trim(Text.Start([#"Score"] & " ", Text.PositionOf([#"Score"] & " ", " ")))),
  Step11 = Table.AddColumn(Step10, "losing_team", each Text.Trim(Text.Start([#"Losing team"] & "(", Text.PositionOf([#"Losing team"] & "(", "(")))),
  Step12 = Table.AddColumn(Step11, "venue.1", each Text.Trim(Text.Start([#"Venue"] & "(", Text.PositionOf([#"Venue"] & "(", "(")))),
  Step13 = Table.AddColumn(Step12, "city.1", each Text.Trim(Text.Start([#"City"] & "(", Text.PositionOf([#"City"] & "(", "(")))),
  Step14 = Table.AddColumn(Step13, "venue", each Text.Trim(Text.Start([#"venue.1"] & "[", Text.PositionOf([#"venue.1"] & "[", "[")))),
  Step15 = Table.AddColumn(Step14, "city", each Text.Trim(Text.Start([#"city.1"] & "[", Text.PositionOf([#"city.1"] & "[", "[")))),
  Step16 = Table.RemoveColumns(Step15, {"Game", "Date/Season", "Winning team", "Score", "Losing team", "Venue", "City", "Referee", "Ref", "venue.1", "city.1"}),
  Step17 = Table.RenameColumns(Step16, {{"Attendance", "attendance"}}),
  Step18 = Table.TransformColumnTypes(Step17, {{"game", type text}, {"date", type text}, {"winning_team", type text}, {"score", type text}, {"losing_team", type text}, {"venue", type text}, {"city", type text}, {"attendance", type text}}),
  Step19 = Table.SelectColumns(Step18, {"game", "date", "winning_team", "score", "losing_team", "venue", "city", "attendance"})
in
  Step19
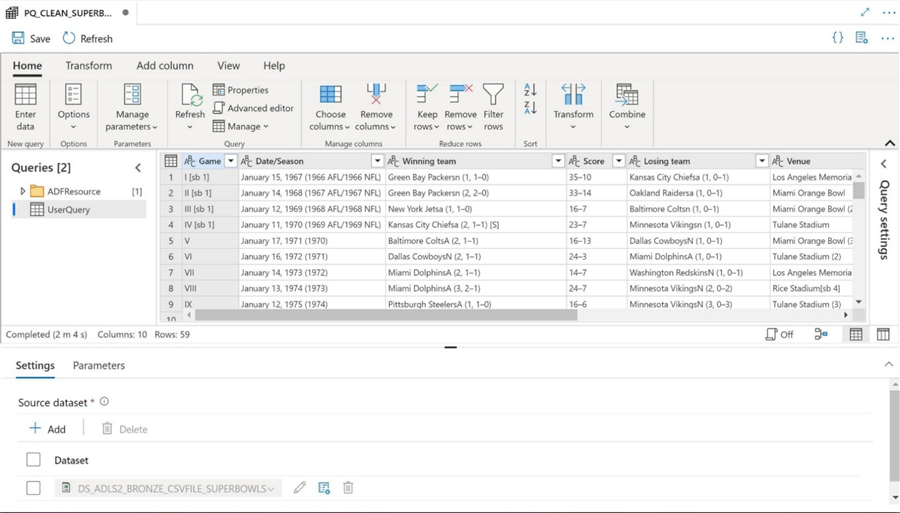
If we execute the script within the graphical interface, we can see that the correct output is shown below.

Unlike a regular pipeline, debugging a mapping or wrangling data flow requires computing power for the spark cluster. By default, this auto resolve integration runtime will stay active for 1 hour before terminating. See image below for details.

If we save and execute the pipeline, we get the following error. This issue took me some time to figure out. I am going to let the suspense build before I give you the answer.

The issue resides in the fact that the Spark Engine that executes the translated M language handles the malformed CSV file differently than the traditional pipeline. A traditional pipeline understands that a carriage-return or linefeed that occurs inside a quoted field should be ignored. Instead, the Spark Engine splits file into many more records than there are super bowls. The null value assert is triggered by the fact that many fields are null.
A quick fix is to modify the file to remove any unwanted character sequences. Just download the file from the raw zone. Use a text editor to modify the file. Last, overwrite the existing file with an upload action.

Please debug the completed pipeline with the updated input file. It will now run to completion without any errors. We can use the Azure Portal to explore the files in the silver (refined) quality zone. We can see that the Spark Engine create many output files. This is normal for a Spark program. We just need to use a directory path instead of fully qualified file name when reading data.

In summary, the Online Power Query interface allows for transformations that are not available with wrangling data flows. Consult the documentation when designing your mashup script. Because Spark appends to the output directory, there will be an issue in the future with duplicate records. The easiest way to fix this problem is to insert a delete folder activity to remove the folder before writing the output.
I did open an issue on the git hub repository for the Product Team at Microsoft who maintains the code base for the Power Query activity. Either the functionality of parsing a malformed CSV file needs to be corrected for the Spark Engine that runs the Power Query script or a pre-processing step needs to be added to look for malformed files and display a more user-friendly error message.
Product Team Update
I want to thank the Microsoft product team for getting back to me on this issue. There are some advanced settings on the source data set when you specify the name in the Power Query Designer. Please see above image in last section that deals with the source data set. Use the settings icon to bring up this option box.

The first setting allows for multiple rows in the delimited data file as long as the text fields that contains the row delimiters is quoted. The second setting allows for two additional actions that can be use to post-process the file. Unfortunately, these settings are not documented online. I did a test after picking the above options. The pipeline completed successfully without any issues.
Copy ADLS file to SQL table
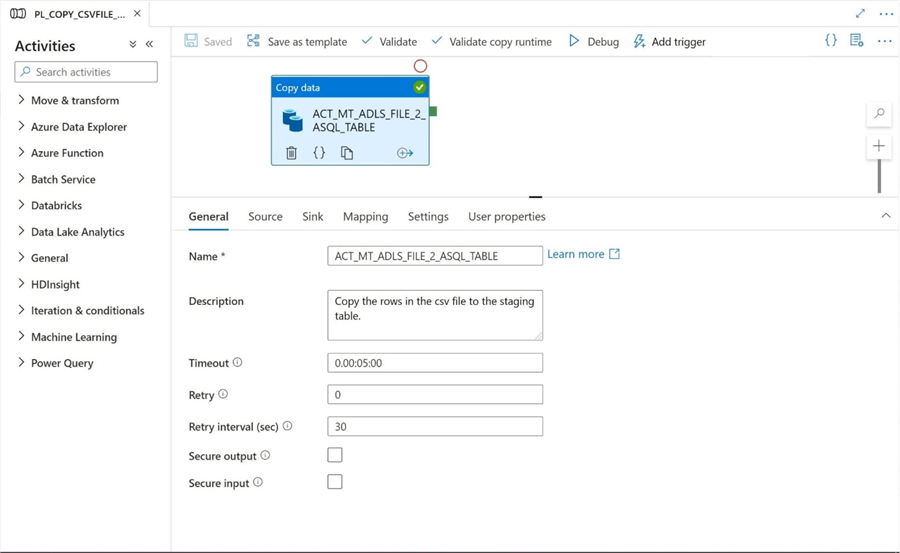
The third leg of the data flow (information journey) is to read the source data from the CSV file in the refined zone of the data lake and write this information to an Azure SQL Server Table. Please drag over a copy activity over to the canvas, name the object properly, add a valid description, set the time out value and choose your retry settings. The ultimate name of the pipeline will be PL_COPY_CSVFILE_2_ASQL_TABLE.
The next step is to fill out the details about the source data set. I am going to hard code the output path. However, we can see a wild card is being used to find the CSV file. This is due to the fact that the Spark Engine writes out multiple files. The CSV file can be found with the following search pattern “*.csv”.

The last step is to fill out the details about the destination data set. Make sure you choose the [stage].[superbowl] table as the destination location. We need to use a pre-copy script to truncate the destination table to prevent duplicates.

We can use SQL Server Management Studio to verify the contents of the target table.

Redesign and unit test
We can see that using a CSV file format for an intermediate file staging is problematic since it is a weak file format. A better solution is to use the Apache Parquet file format which is considered a strong file format. The following components were used in the final solution.
| Name | Description |
|---|---|
| LS_WEB_TABLE_WIKIPEDIA | Connection information for Web Page. |
| LS_ADLS2_DATALAKE_STORAGE | Connection information for Azure Data Lake. |
| LS_ASQL_TIPS_2022 | Connection information for Azure SQL Database. |
| DS_WEB_TABLE_SUPERBOWLS | Source Web Table. |
| DS_ADLS2_BRONZE_PARQUET_FILE | Raw dataset. Parquet file format. |
| DS_ADLS2_SILVER_PARQUET_FILE | Refined dataset. Parquet file format. |
| DS_ASQL_TABLE_SUPERBOWLS | Destination Azure SQL Server table. |
| ACT_MT_CPY_WEB_TABLE_2_ADLS_FILE | Copy activity for stage 1 of data journey. |
| ACT_GEN_DEL_SILVER_DIR | Remove refined folder to prevent duplicates. |
| ACT_PQ_FLOW_SUPERBOWL | Execute Power Query for stage 2 of data journey. |
| PQ_CLEAN_SUPERBOWL_DATA | Actual Power Query |
| ACT_MT_ADLS_FILE_2_ASQL_TABLE | Copy activity for stage 3 of the data journey |
| PL_COPY_N_CLEAN_SUPERBOWL_DATA | Overall ADF pipeline object. |
If we execute the pipeline program, we see a successful execution.

As a developer, I always want to verify the output of any program that is executed during testing. The image below shows the delimited file was created in the correct BRONZE folder. This is the raw data before transformation by the Power Query.

We can verify that the files were created in the SILVER folder using the Azure Portal. The four files created by the Spark Engine are show below.

Finally, we can verify if the data in the target table is correct. If you look closely at the winning and losing team columns, you can see additional information at the end. I fixed the files manually when we were prototyping the program. Now, we have to add code to fix this issue. The root cause of the issue is the web site page that superscripts the name of the teams for which division they are in.

The best way to fix this is to manually create a translation table within Power Query that has old and new values. This table can be joined at the end of the script to provide a lookup and replace value task. I leave this exercise for you, the reader to accomplish.
Summary
I really like the fact that wrangling data flows allow the citizen developer to transform data using a code free environment. The preview release of this product was in 2019 and a general acceptance release was available in October of 2021. However, the graphical interface that is shared with Power Query Online must be modified before wide acceptance is gained. Otherwise, end users will get in trouble by creating scripts that will not be able to be executed.
Today, we found out that the CSV file format is weak in nature. Any characters that represent a column or row delimiter will cause issues with the Spark Engine which interprets the generated M language script. There are some advanced source data set options that can fix this issue. While the Excel file format is better than CSV, we can’t generate this file format as a destination in Azure Data Factory Pipeline. Additionally, it does have a limit on the number of rows of data that can be stored. The best file format is Apache Parquet which is considered strong. This format allows for compression, is binary in nature and does not have a limit on the number of rows.
In summary, I look forward to when the Microsoft Product team updates the Power Query GUI (Graphical Interface) so that transformations that are not valid with wrangling data flows are not shown to the end user. If you are familiar with the M language, you will have no problems creating transformations that adhere to the restrictions outlined in the documentation. Have fun transforming data with wrangling data flows!
Next Steps
- Check out these other Azure Data Factory Articles

John Miner is a Senior Data Architect at Insight Digital Innovation helping corporations solve their business needs with various data platform solutions.
He has over thirty years of data processing experience, and his architecture expertise encompasses all phases of the software project life cycle, including design, development, implementation, and maintenance of systems.
His credentials include undergraduate and graduate degrees in Computer Science from the University of Rhode Island. Also, he has earned certificates from Microsoft for Database Administration (MCDBA), System Administration (MCSA), Data Management & Analytics (MCSE), Data Science (MPP), Databricks Certified, and Fabric Certified.
John has been recognized with the Microsoft MVP award nine times for his outstanding contributions to the Data Platform community.
When he is not busy talking to local user groups or writing blog entries on new technology, he spends time with his wife and daughter enjoying outdoor activities. Some of John’s hobbies include wood working projects, crafting a good beer and playing a game of chess.
- MSSQLTips Awards: Author of the Year – 2019, 2022, 2023 | Champion (100+tips) – 2023


Dear Hristo Hristov,
That sounds like another article.
Here are main types of integration runtimes.
1 – One that is SSIS compatible. Run existing packages in the web using Azure SQL Server or SQL MI.
2 – Self hosted integration runtime. Used for hybrid as well as certain data sources. Get data from on-premise to in-cloud.
3 – Auto resolve integration runtime. The one that typically runs cloud based datasets and code.
Under section 3, I think there are three flavors.
A – Execute classic pipelines (ELT).
B – Execute Mapping Data Flows (T)
C – Execute Wrangling Data Flows (T)
Both the B and C flavors run under some type of spark engine. That is why they can scale but you have to pay attention to Time To Live (TTL). You do not want to take a hit for a spark cluster spin up every time you run a job.
In short, I hope this gives you some insight into the integration runtimes. Please look at this website and MSFT documentation for details.
Sincerely
John
Hey John, this is an incredibly thorough piece and is very helpful. Thanks for sharing. It could be useful to know more about integration runtimes and what one can do with the different types.