Problem
What visual / GUI type tools can assist you with the design and development of Power BI Dashboards?
Solution
Power BI is known for its high-quality visuals and ease of use in importing data. One point that was often brought up by report designers was that dealing with the query editor, which showed the steps included in obtaining and transforming the data did not meet the expectations for viewing the queries in a more "visual" format. Within other tools such as SQL Server Reporting Services (SQL Server Reporting Services SSRS 2017 Installation and Configuration Setup), Report Builder (SQL Server Reporting Services Report Builder Tips) and even Management Studio, the ability to visually design and display your data sources is available.
As such, report designers suggested, and the Power BI developers have rolled out a new diagram view along with a schema view to make the Power Query "Online" editing easier on report designers. These two views provide a visually appealing way to review the data that is being sourced and also a method of interacting with those sources. It should be noted, though, that currently the diagram view is ONLY available in Power Query online. Hopefully, Microsoft will push these great changes to Power Query in Power BI Desktop. Along those same lines, in order to access Power Query Online, a Power BI Pro license is required (What licenses do you need to use dataflows – Power Query | Microsoft Docs).
Getting Started with Power BI Diagrams
To get started with this particular solution, we first need to head over to the Power BI online service. Once you are on the Power BI site, navigate to the Workspace section (shown below) and then find a dataset or dataflow that can be edited.

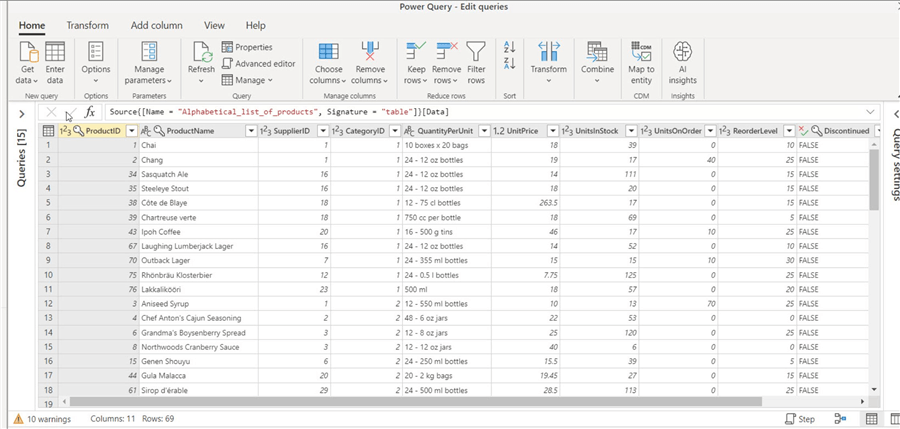
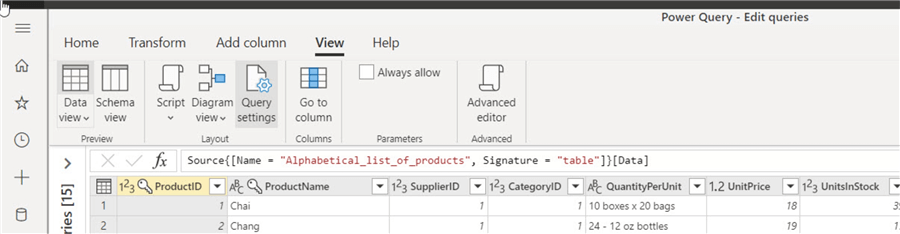
As shown subsequently, the Power Query window opens with the queries being listed on the left side and the data grid for the selected query shown in the middle area.
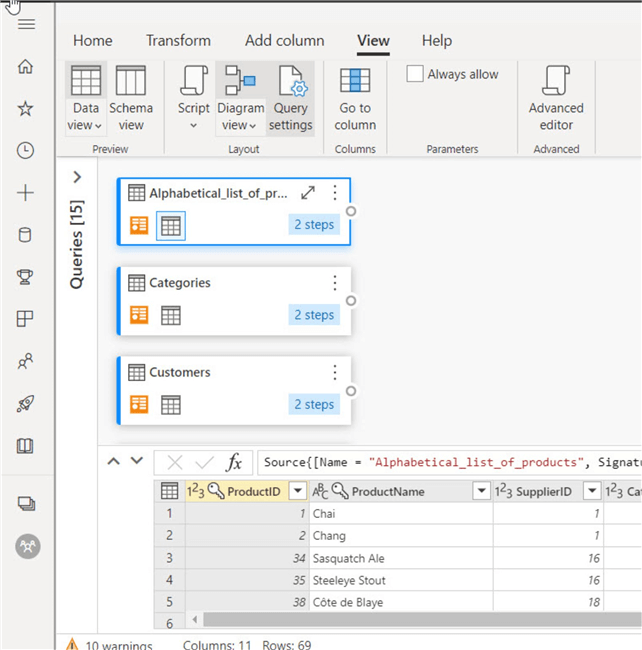
By clicking on View toolbar menu and then selecting the Diagram view button, the data grid now moves to the lower half of the screen and diagram view area opens in the upper middle part of the screen. Note how diagram view provides several quick pieces of information including:
- Name of the query
- Number of steps in the query
- Button for each step
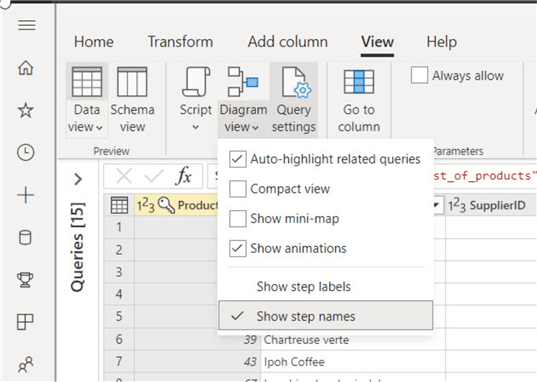
In addition to the default view, several additional items can be added to the diagram view including:
- Auto highlight related queries which adds accent colors to queries that have an established relationship
- Compact view which makes the items smaller and shows more objects on the screen
- Mini map which shows a small thumbnail visual of the diagram view grid
- Show animations which shows animations related to the steps.
Additionally, either the step name or the step label can be set in the header box.
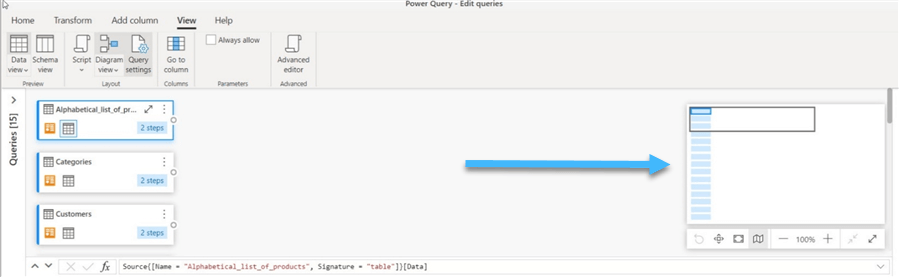
The below screen print illustrates the mini map view.
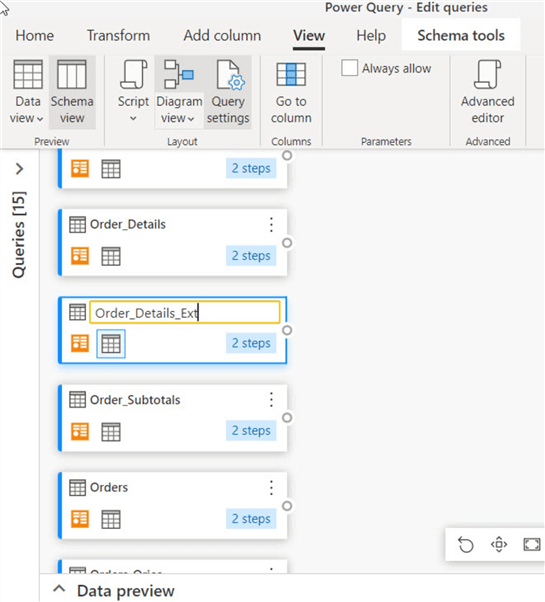
As needed within each query box, the label for the step can be renamed by double clicking in the header area, as illustrated below. Likewise, the data preview (data grid) can be minimized to show more queries in the main design area.
Up to this point, the focus has been on the diagram view display, but its real potential is in the visual way you can edit the steps being applied to the query. As shown below, clicking on the query boxes provides a plus button between the steps.
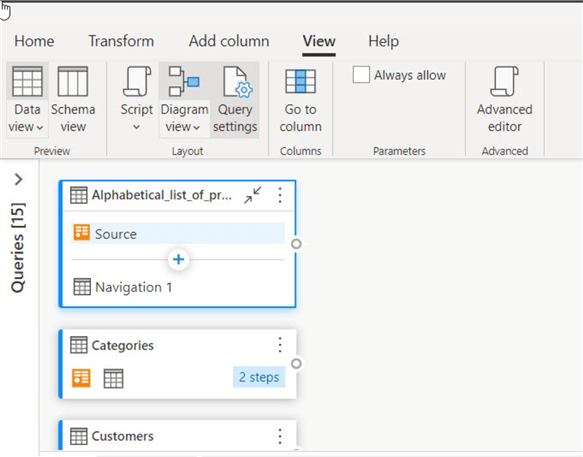
Clicking on the plus button opens a drop-down box that provides all the available steps that can be inserted into the query load process. You will notice that the current steps included in this query were 1) source-setting up the dataset source connection and 2) navigation – picking the appropriate table from the dataset source. The list of available steps encompasses all the various items that can be added using the menu bar. You want to also note that a search text box exists at the top of the list which is very helpful to narrow down the long list of available steps.

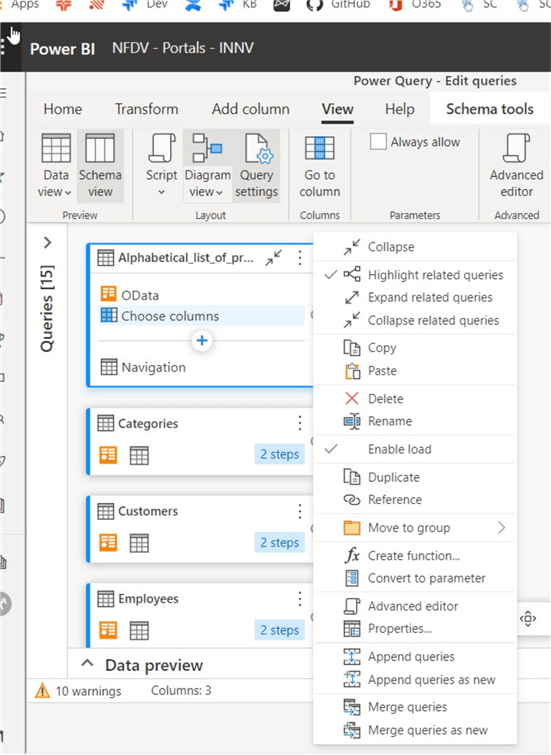
In the below example, the "choose columns "was added to the query steps between the source and the navigation steps. In a similar fashion we could have selected the plus bar after the navigation step to add a step at the end of the query steps.

An additional view which is helpful is the show related queries option which are related to each other. Clicking on the 3-dot ellipse button to right of the query label, provides a number of options that can be used to perform a broad array of tasks on the query itself including copy/pasting, duplicating, appending, and merging.
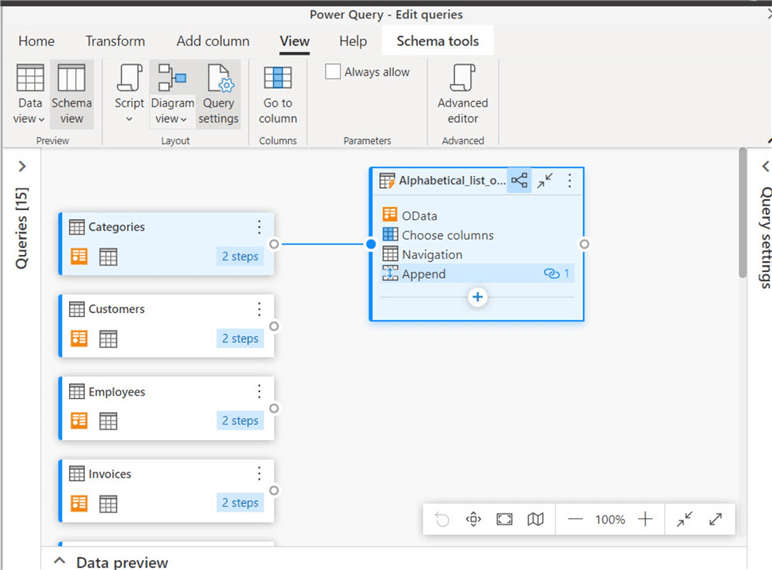
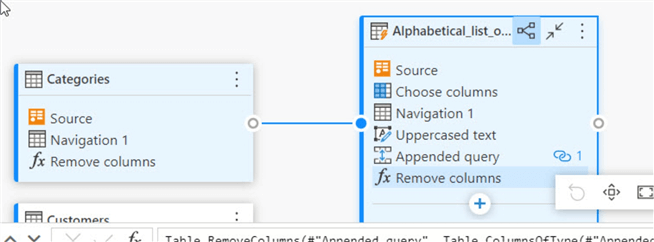
Using the below example, the categories query is related to the alphabetical list of products query. The diagram view shows the relationship between the queries, which in complicated data models, can be very helpful in showing the data lineage from one query to the next query.
Using the buttons at the bottom right corner of the design grid, we do have the ability to show and hide different views to our design grid including the related view noted above or the data view noted in the 2nd screen print below. Clicking on the design view button switches back from the data view to the design view.

Within the highlight related queries option, notice how a new option is emphasized in the upper right corner of the label bar in the alphabetical list… query. This tells us that the view is related while we can also work on the query by adding additional steps such as a new column, shown below.
Now that modifications to our query steps are completed, they need to be saved. Click on the Save and close button in the bottom right corner of the design grid saves the query steps along with validating any changes that were made to the query.

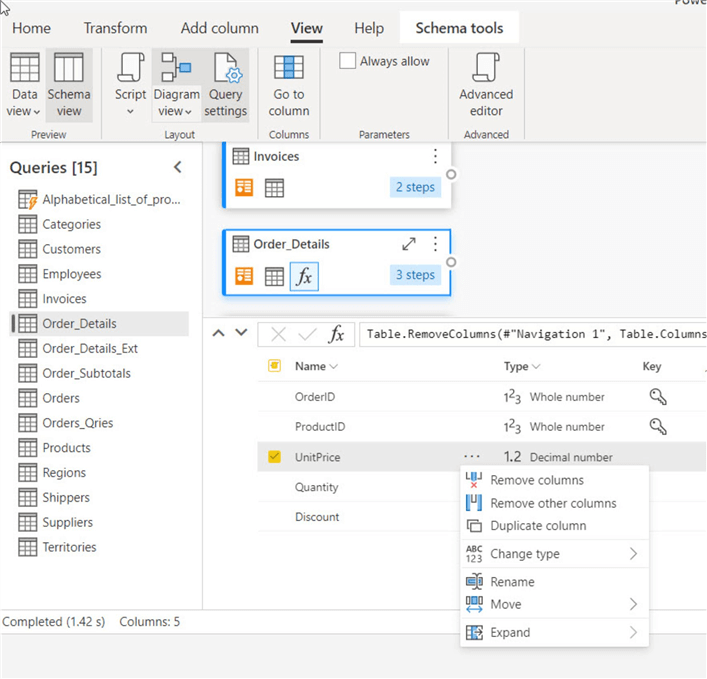
In addition to the design view, the schema view can also be added to the design grid. The schema view provides a detailed look into the particulars of each query including items like column names, data types, and primary key identification. Thus, these items can be quickly changed in the schema view which will be reflected in the steps of the query.

For example, in the illustration below the unit price field is set to be removed.
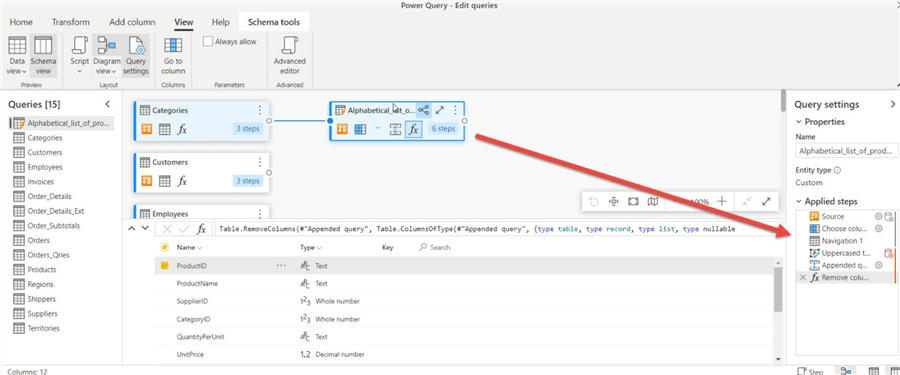
Note that the removed column is reflected in the below screen print showing as the last step on the alphabetical list… query.

Lastly, notice how in the below view, we can see all the different methods of changing our query steps.
- The middle top half shows the diagram view (not expanded) which can be used to add steps visually.
- The toolbar up top allows for transforming and adding columns.
- The schema view allows for maintaining the individual query columns and data types.
- The query setting shows the steps to be performed in a serial path and allows for deleting or maintaining those steps.
Within this tip the new diagram view along with the schema view are described in detail. A designer should note that these views are only available, for now, in Power Query online.
Next Steps

I have a passion for crafting Business Intelligence Solutions for my user groups. My experience includes almost 15 years of SQL Server involvement with the last 12 years focused specifically on Business Intelligence, SharePoint, OLAP, SSRS, and Decision Support solutions. Currently, I am a Business Intelligence Architect in the healthcare industry, and I also teach database and analytics classes for Kennesaw State University, Southern New Hampshire University, and Reinhardt University. My education includes an MBA and an undergraduate in Accounting (yes I am a reformed accountant!), both from Kennesaw State University. I enjoy every day by trying to grow my faith and spend precious time with my family. I have been happily married to my wife of over 20 years, and we have two teenagers one who we home school with the help of a University Model School, Cornerstone Prep in Acworth, GA (cornerstoneprep.org). Our other child is a Construction Management major at KSU’s Southern Poly / Marietta campus. We are a soccer and Cross Country (XC) family who play, coach, and referee soccer or run for fun most every day. For several years, our family has volunteered (and played with the dogs and cats) at Etowah Valley Humane Society in Cartersville, GA.
- MSSQLTips Awards: Champion (100+tips) – 2016 | Author of the Year – 2015 | Author Contender – 2014, 2016-2021


