Problem
Many companies use the Apache Spark ecosystem for data engineering and discovery. Knowing how to filter and/or aggregate data stored in hive tables is important. How can we accomplish these tasks with Spark SQL?
Solution
Both Azure Synapse and Azure Databricks support using PySpark to work with data. This library supports the core features of ANSI SQL. The WHERE clause can be used to filter unaggregated data, and the HAVING clause can be used to filter aggregated data. Finally, the Spark SQL language has many aggregate functions.
Business Problem
There are several objectives that our manager wants us to learn today. First, how do you convert a dataframe into a temporary hive view? Second, how can we use the WHERE clause to filter rows from the table when searching for information? Third, experiment with some of the most popular aggregate functions. Fourth, how do you filter aggregated data using the HAVING clause?
At the end of the tip, we will create a complex query that pulls all these concepts together.
Create Temporary View
Today, we will use an Azure Databricks Workspace to explore hive tables with Spark SQL, as well as a python notebook. To run SQL code, we need to prefix the name of the language with the % magic command.
The code below reads the low-temperature CSV files into a dataframe. The data is in the weather directory within the sample Databricks datasets directory. There are many fine datasets that can be used by the data engineer when learning to use Spark SQL. Since we are not defining the data types, the Spark engine must infer the types from the data. For large sets of files, not supplying the schema will increase the processing time. Use the createOrReplaceTempView to publish the data files as a temporary table named tmp_low_temps.
#
# 1 - read in low temps
#

path1 = "/databricks-datasets/weather/low_temps"
df1 = (
  spark.read
  .option("sep", ",")
  .option("header", "true")
  .option("inferSchema", "true")
  .csv(path1)
)

# make temp hive view
df1.createOrReplaceTempView("tmp_low_temps")
The code below reads the high-temperature CSV files from the same weather root directory into a dataframe. Use the createOrReplaceTempView to publish the data as a temporary table named tmp_high_temps.
#
# 2 - read in high temps
#

path2 = "/databricks-datasets/weather/high_temps"
df2 = (
  spark.read
  .option("sep", ",")
  .option("header", "true")
  .option("inferSchema", "true")
  .csv(path2)
)

# make temp hive view
df2.createOrReplaceTempView("tmp_high_temps")
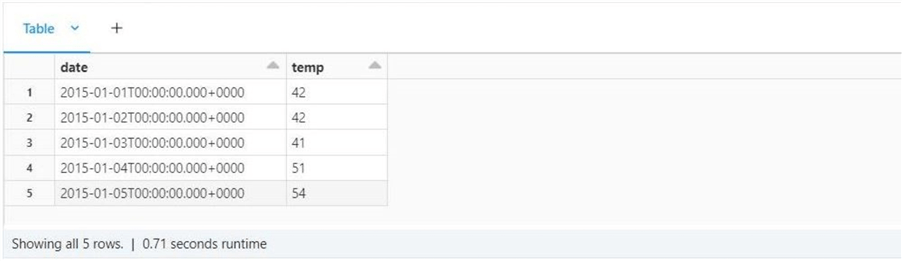
The code below shows a great example of how compute engines differ. In SQL Server, if we want to return the first five rows, we use the TOP expression. On the other hand, in Spark SQL, we want to use the limit clause. The code below returns the first five rows of the low-temperature temporary view.
%sql

--
--  3 - Show 5 rows for low temps
--

select * from tmp_low_temps limit 5;
The screenshot shows the low-temperature data from 2015.

The code below returns the first five rows of the high temperature temporary view.
%sql

--
--  4 - Show 5 rows for low temps
--


select * from tmp_high_temps limit 5;
The screenshot shows the high temperature data from 2015.
At this point, we have low and high temperature data in two different views. How do we combine the data into one queryable view? We can use an inner join discussed in my previous article. We know that we have both high and low data for each date. If this is not so, we might consider using a full outer join.
The code below renames two columns, drops one column, and combines the data into one logical view.
%sql

--
--  5 - Join low and high tables and show 5 rows
--

select l.date, h.temp as high_temp, l.temp as low_temp
from tmp_high_temps as h
join tmp_low_temps as l
on h.date = l.date
limit 5;
The image below shows the high and low temperatures for Jan 1, 2015 to Jan 5, 2015.

Is this the optimal way to work with data used multiple times by various users? The answer is NO. Using temporary views is acceptable for data processing pipelines that run in a batch file. However, the two views only live within a given Spark Session (connection). Once the session is broken, the views go away. A better way to present data is to create hive tables within a user-defined database. In the next section, we will talk about databases, tables, and views.
Hive Objects
The recent release of the unity catalog adds the concept of having multiple catalogs with a spark ecosystem. Traditionally, there is one hive catalog that data engineers carve schemas (databases) out of. The image below shows that tables can be managed or unmanaged. Unmanaged tables are metadata only. On the other hand, dropping a managed table results in removing the data from the hive meta-store.

The Spark SQL code below creates a new schema (database) called sparktips. You should review the Databricks documentation on the create database statement for more details. Unless you want to prefix every table with the schema (database) name, please execute the use schema statement to set the current schema.
%sql

--
--  6 - Create a new database
--

-- new database (schema)
create database sparktips;

-- choose database (schema)
use sparktips;
Often, a data engineer wants the code to restart if an error occurs. For example, a create table statement will fail if the table exists. The code below uses the DROP TABLE statement to remove the table and the CREATE TABLE statement to recreate the table. What is great about Spark SQL is that the IF EXISTS clause exists for both statements. This will reduce the probability of errors. Another cool feature is the COMMENT clause, which allows the engineer to add metadata at column and table levels. The USING clause tells the Spark engineer what type of data to process, and the OPTIONS clause allows for further refinement when reading the files. It is important to note that we are defining the schema of the external table.
%sql

--
--  7 - Create low temps table
--

-- remove existing table
DROP TABLE IF EXISTS low_temps;

-- create table
CREATE TABLE IF NOT EXISTS low_temps
(
    low_date DATE COMMENT 'The day of the observation.',
    low_temp INT COMMENT 'The low temp of the day.'
)
USING CSV
LOCATION '/databricks-datasets/weather/low_temps'
COMMENT 'Table containing low temperature for a given day.'
OPTIONS
(
    header = "false",
    delimiter = ","
);

-- show sample records
select * from low_temps limit 5;
The image below shows the output from the select statement returning low temperature data. The first row contains null values. This might be a data integrity issue with a data file. I leave it up to you, the reader, to follow up on this issue.

We want to repeat the same code with minor changes for the high temperature data. See the code below for details.
%sql

--
--  8 - Create high temps table
--

-- remove existing table
DROP TABLE IF EXISTS high_temps;

-- create table
CREATE TABLE IF NOT EXISTS high_temps
(
    high_date DATE COMMENT 'The day of the observation.',
    high_temp INT COMMENT 'The high temp of the day.'
)
USING CSV
LOCATION '/databricks-datasets/weather/high_temps'
COMMENT 'Table containing high temperature for a given day.'
OPTIONS
(
    header = "false",
    delimiter = ","
);

-- show sample records
select * from high_temps limit 5;
The image below shows the output from the select statement returning high temperature data.

Can we make it easier for the end users to reference this data set? It would be nice to see the low and high temperatures part of a single view. We can hide the base tables from the end users using table access controls.
The CREATE VIEW statement below joins the two tables on a given date. The end users have asked for additional dimension data to be supplied for a given date. The year, month, and day functions return the equivalent integers for their date parts. The extract function returns the quarter, week, and day of the week. Columns derived from calling these functions with the observation date have been added to the view. Don’t forget to use the COMMENT clause to add metadata describing the columns and the view.
%sql

--
--  9 - Create view to join low to high tables and include date attributes
--

-- create view
CREATE OR REPLACE VIEW daily_temps
(
    obs_date COMMENT 'Observation Date',
    obs_year COMMENT 'Observation Year',
    obs_quarter COMMENT 'Observation Quarter',
    obs_month COMMENT 'Observation Month',
    obs_week COMMENT 'Observation Week',
    obs_dow COMMENT 'Observation Day Of Week',
    obs_day COMMENT 'Observation Day',
    daily_low_temp COMMENT 'Daily Low Temp',
    daily_high_temp COMMENT 'Daily High Temp',
    daily_avg_temp COMMENT 'Daily Avg Temp'
)
COMMENT 'View of temperatures for a given day with associated date parts for aggregation.'
AS
  select
    l.low_date as obs_date,
    year(l.low_date) as obs_year,
    extract(quarter from l.low_date) as obs_quarter,
    month(l.low_date) as obs_month,
    extract(week from l.low_date) as obs_week,
    extract(dow from l.low_date) as obs_dow,
    day(l.low_date) as obs_day,

    l.low_temp as daily_low_temp,
    h.high_temp as daily_high_temp,
    (h.high_temp + l.low_temp) / 2 as daily_avg_temp
  from
    sparktips.high_temps as h
  join
    sparktips.low_temps as l
  on
    l.low_date = h.high_date;

-- show sample records
select * from daily_temps limit 5;
The image below shows the output from running a SELECT against the new view that contains descriptive data about the observation date and the low, high, and average daily temperature.

In a nutshell, setting up the hive catalog is worth the time. Schemas (databases) can group tables and views by business functionality. Don’t forget to use comments on both the columns and tables/views. Creating tables allows us to supply the file schema, decreasing the processing time. Next, we will explore how to filter data.
Filtering Data
The WHERE clause is used to filter unaggregated data, and the HAVING clause is used to filter aggregated data. In this section, we will see some simple examples of filtering.
The business analyst might want to know how many temperature observations were collected for a given year. The query returns a result set to answer that exact question. The GROUP BY clause is used to group the data by observation year. The count function returns the number of records per grouping. The last step is to use the ORDER BY clause to return the result in ascending order.
%sql

--
-- 10 - How many rows of data by year?
--

select obs_year, count(*) as obs
from sparktips.daily_temps
group by obs_year
order by obs_year
The image below shows the output of the query. We have complete data for 2015, 2016, and 2017 and partial data for 2018.

The code below compares the reading on the 5th day of May between 2015 and 2017. We need to supply an expression to filter data in the WHERE clause. The expression can be as simple as does the observation month equal 5. The IN predicate function allows testing if the year column is within a set of dates.
%sql

--
-- 11 - Where Clause - filtering data
--

select
    *
from
    sparktips.daily_temps
where
    obs_year in (2015, 2016, 2017)
    and obs_month = 5
    and obs_day = 4
order by
    obs_year
The output below shows the recorded high, low, and average temperatures for 05/04 given three separate years.

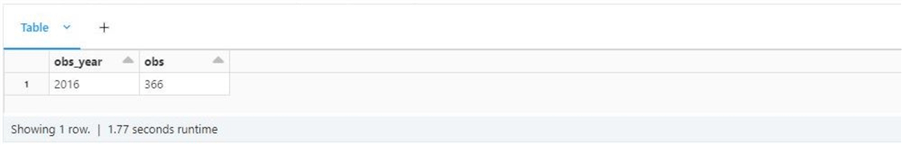
How do we identify any leap years? A leap year is defined as having 366 days. We can use the HAVING clause to find this condition with the correct GROUP BY clause. The query below finds the one year in our dataset identified as a leap year.
%sql

--
-- 12 - Having Clause - filtering data
--

select obs_year, count(*) as obs
from sparktips.daily_temps
group by obs_year
having obs = 366
The output below shows that 2016 was a leap year.
To recap, use the WHERE clause to filter unaggregated data and the HAVING clause to filter aggregated data.
Aggregate Functions
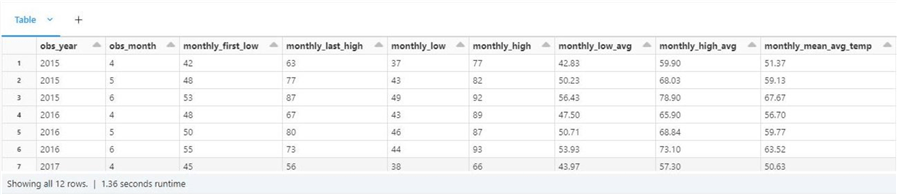
The Spark SQL language contains many aggregate functions. Let’s explore a small subset of what is available. The idea is to group the data by year and month and calculate values using the high and low temperatures. The first and last functions return the non-null value of the column given an ordinal position in a bunch of records. Since the data is not ordered by date, we cannot guarantee the information is from the first and last day of a given month. The max, min, and avg functions are common between SQL dialects. The mean function is another name for the avg function and is applied to the daily average.
%sql

--
-- 13 - Show off popular aggregations
--

select
  obs_year,
  obs_month,
  first(daily_low_temp) as monthly_first_low,
  last(daily_high_temp) as monthly_last_high,
  min(daily_low_temp) as monthly_low,
  max(daily_high_temp) as monthly_high,
  cast(avg(daily_low_temp) as decimal(4,2)) as monthly_low_avg,
  cast(avg(daily_high_temp) as decimal(4,2)) as monthly_high_avg,
  cast(mean((daily_low_temp+daily_high_temp) / 2) as decimal(4,2)) as monthly_mean_avg_temp
from sparktips.daily_temps
where obs_quarter = 2
group by
  obs_year,
  obs_month
order by
  obs_year,
  obs_month;
The cast function rounds the last three calculations to two digits right of the decimal place. The image below shows the output from the above query.
In short, there are many aggregate functions. Please use the online Apache Spark reference page to learn more.
Capstone
So far, we have been working with a small data set containing low and high temperatures for a given date. Let’s now work with a larger dataset. The lending club data set has 145 columns and 130,776 rows of data. Because this is a tip, I will not provide data types and comments for all columns. The code below creates a new table in our sparktips schema.
%sql

--
-- 14 - Create table for lending club data
--

-- choose schema
use sparktips;

-- remove existing table
DROP TABLE IF EXISTS lending_club;

-- create table
CREATE TABLE IF NOT EXISTS lending_club
USING CSV
LOCATION '/databricks-datasets/lending-club-loan-stats/LoanStats_2018Q2.csv'
OPTIONS
(
    header = "true",
    delimiter = ","
);

-- show sample records
select * from lending_club limit 5;
The output below was generated from running the above SELECT query on the lending club table.

With that many columns, how can you produce a list for analysis for a business analyst? The SHOW COLUMNS statement returns a list of columns within a given table. The Python code shows how to turn this list into a dataframe. Optionally, the data engineer can write this data to a CSV file for the business analyst to look at.
#
# 15 - Show columns in table
#

df1 = spark.sql("show columns in sparktips.lending_club")
display(df1)
The screenshot below shows the first seven columns in the lending club tables.

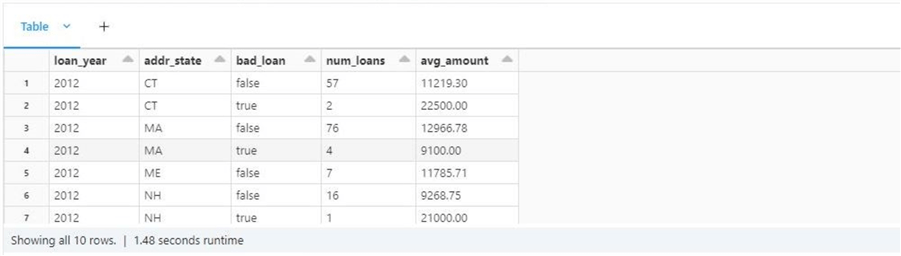
The query below is the most complex shown so far. It is our capstone problem. How can we get the number and average amount of loans by year, state, and loan status?
Only four columns need to be pulled from the original data set. A common table expression (CTE) is used to transform the data. First, the loan status column is a text. We want to have this data as a Boolean label. The loan is either bad or good. Second, the year is stored as two digits in a larger date string. This is considered bad practice, and we will use an educated guess to create a four-digit year. Any year less than 50 is regarded as the 21st century and all other years are the 20th century.
Now that we have a CTE, we want to group by loan year, address state, and loan status. The HAVING clause drops any combinations that do not have any loans. The WHERE clause is used to FILTER the data for only New England states. Finally, we only want loans given out in the year 2012.
%sql

--
-- 16 - Capstone query - use CTE to select and format data, show the
--      count and average amount of loans by year, state, and loan status
--

with cte_loan_data
as
(
select
  addr_state,
  case
    when loan_status = "Current" then "false"
    when loan_status = "Fully Paid" then "false"
    else "true"
  end as bad_loan,
  case
    when cast(substring(earliest_cr_line, 5, 4) as double) < 50 then cast(substring(earliest_cr_line, 5, 4) as double) + 2000
    else cast(substring(earliest_cr_line, 5, 4) as double) + 1900
  end as loan_year,
  loan_amnt
from
  sparktips.raw_lending_club
)
select
  loan_year,
  addr_state,
  bad_loan,
  count(loan_amnt) as num_loans,
  round(cast(avg(loan_amnt) as decimal(12, 4)), 2) as avg_amount
from
  cte_loan_data
where
  addr_state in ('RI', 'CT', 'MA', 'NH', 'VT', 'ME')
  and loan_year = 2012
group by
  loan_year,
  addr_state,
  bad_loan
having
  count(loan_amnt) > 0
order by
  loan_year,
  addr_state,
  bad_loan
The screenshot below shows the output from the capstone query.
The spark engine considers the table and views as the same. The image below shows the sparktips database that contains three tables (low_temps, high_temps, and lending_club) and one view (daily_temps). Please create a table in the hive catalog for data files that are used repeatedly. This will allow you to provide a schema and fully document the table/fields.

Summary
Working with tables is a lot easier than working with dataframes. If you have a file that you want to load, use the read method of the spark session to place the data into a data frame. Once in a dataframe, use the create or replace temporary view method to publish the information as a temporary hive table. This process is great for data engineering notebooks. If the data needs to be persistent, consider creating a hive table.
Unless you use the unity catalog, the big data engineer must understand that each workspace has a single catalog. The catalog can have zero-to-n databases (schemas) to logically group objects. Under each database, tables and views can exist.
Spark SQL is just like the ANSI SQL that you grew up with. Yes, there are some idiosyncrasies that you might need to get used to. For instance, the TOP expression is replaced by the LIMIT clause. However, there is more in common than it is different. The WHERE clause can be used to filter the unaggregated data. For example, show me all rows from the daily temperatures view that occurred in 2015. The HAVING clause can be used to filter the aggregated. To illustrate, we can create a query that calculates the AVERAGE high temperature by year and month. We can filter the rows to months with an average temperature greater than 70 degrees.
Today, we started our introduction to windowing functions by talking about aggregations. However, we did not discuss the OVER, PARTITION BY, and ORDER BY syntax. Next time, we will review ranking functions.
Finally, enclosed is the notebook that contains the complete code used in this article.
Next Steps
- Read this related article – Exploring Hive Tables with Spark SQL

John Miner is a Senior Data Architect at Insight Digital Innovation helping corporations solve their business needs with various data platform solutions.
He has over thirty years of data processing experience, and his architecture expertise encompasses all phases of the software project life cycle, including design, development, implementation, and maintenance of systems.
His credentials include undergraduate and graduate degrees in Computer Science from the University of Rhode Island. Also, he has earned certificates from Microsoft for Database Administration (MCDBA), System Administration (MCSA), Data Management & Analytics (MCSE), Data Science (MPP), Databricks Certified, and Fabric Certified.
John has been recognized with the Microsoft MVP award nine times for his outstanding contributions to the Data Platform community.
When he is not busy talking to local user groups or writing blog entries on new technology, he spends time with his wife and daughter enjoying outdoor activities. Some of John’s hobbies include wood working projects, crafting a good beer and playing a game of chess.
- MSSQLTips Awards: Author of the Year – 2019, 2022, 2023 | Champion (100+tips) – 2023