Problem
Microsoft Power BI Desktop is not only a visualization tool, but it also has the capabilities for data modeling. If the data is not modeled correctly, it will cause redundancy, consume more storage, and make data retrieval difficult. Using a Star Schema is the mature modeling approach that overcomes most poor modeling problems. This article will leverage Microsoft Power BI Desktop to build a proper star schema that includes a fact table and dimensions.
Solution
One of the many choices a Business Intelligence (BI) developer has to make is to opt for a correct data model which will sustain analytical business operations for years to come. For the more seasoned BI developers, the choice is relatively simple: a Star Schema.
A data model is an abstraction of an enterprise’s data elements, their organization, and how they relate to one another. A star schema is a mature modeling approach that comprises a central large fact table that stores observational data. Surrounding the fact table are numerous small dimension tables that store attributes about the observational data elements you model.
In data warehouse modeling, fact tables store all the primary keys of dimensions and relevant facts or measures, such as product key, time keys, store key, salesperson ID, order quantity, etc. On the other hand, dimension tables provide descriptive information about business entities stored in the fact table, such as products, stores, geographical location, etc. Generally, fact tables contain a relatively large number of rows/observations, which continue to grow over time. While the measure is a fact table column that stores the summarized/calculated measure value, for instance, a product’s price, quantity, sales, etc.

As the illustration above shows, the central truth table is surrounded by several dimension tables, forming a star-shaped arrangement, hence the name, Star Schema.
Although as tempting as it may be to store everything in a single large table, this is not a desirable modeling approach as various security and duplication issues arise. The array of data in a single large table is also more confusing and difficult to interpret. Star schema is a more performance-optimized and flexible approach that offers simplicity, scalability, and a more straightforward pathway for data aggregation and integration with OLAP systems and multidimensional data matrices data cubes.
In this article, we will be setting up a Star Scheme in Power BI–Microsoft’s interactive data visualization software. For demonstration purposes, we will initially create a "monthly car sales" source table in MySQL.
Set Up Database
To start, we will first set up the database, then access it through the following statements:
CREATE DATABASE car_sales;
USE car_sales;
Create Source Tables
Let’s create three source tables highlighting product (car), customer, and sales staff data metrics.
To create our sales source tables, execute the following statements:
CREATE TABLE sales_product
(
    sales_person_ID int unsigned,
    customer_ID int unsigned,
    selldate date,
    manufacturer varchar(50),
    manufacturer_ID int unsigned,
    model varchar(50),
    model_ID int unsigned,
    vehicle_type varchar(50),
    price_in_thousands int unsigned
);

CREATE TABLE sales_customer
(
    customer_ID int unsigned,
    customer_Name varchar(50),
    manufacturer_ID int unsigned,
    model_ID int unsigned,
    selldate date,
    address text,
    location varchar(50),
    contact varchar(15)
);

CREATE TABLE sales_staff
(
    sales_person_ID int unsigned,
    sales_person_name varchar(50),
    gender enum('M', 'F', 'O'),
    manufacturer_ID int unsigned,
    model_ID int unsigned,
    selldate date,
    branch_location varchar(50)
);
We can infer from the syntax that the first source table, sales_product, contains information related to the product sold, i.e., manufacturer and model name, the commodity’s price, etc. The sales_customer table comprises customer-related information such as their name and address. Each row is matched to a particular sale of a commodity in every table. Lastly, our sales_staff table contains metrics related to the salesperson responsible for selling a particular commodity on a certain date.
Populate Source Tables
Table 1: sales_product
Now, let’s populate our source tables using the following commands:
INSERT INTO sales_product VALUES
(36912151, 71115192, "2018-07-02", "Audi", 21200, "A4", 2100, "Sedan", 23.99),
(61218243, 13579111, "2018-07-05", "Acura", 11220, "CL", 1310, "Coupe", 28.4),
(61218243, 37111519, "2018-07-10", "Audi", 21200, "A8", 2009, "Sedan", 62.0),
(24861012, 59131721, "2018-07-13", "BMW", 30910, "328i", 3101, "Coupe", 33.4),
(36912151, 71115192, "2018-07-15", "BMW", 30910, "528i", 3008, "Sedan", 38.9),
(48121620, 91317212, "2018-07-19", "Audi", 21200, "A6", 2001, "Sedan", 33.95),
(24861012, 37111519, "2018-07-20", "Audi", 21200, "A6", 2001, "Sedan", 33.95),
(48121620, 11151923, "2018-07-23", "Cadillac", 60710, "Eldorado", 6304, "Convertible", 39.67),
(36912151, 13172125, "2018-07-24", "BMW", 30910, "323i", 3710, "Coupe", 26.99),
(61218243, 15192325, "2018-07-27", "Cadillac", 60710, "Catera", 6009, "Sedan", 31.01);
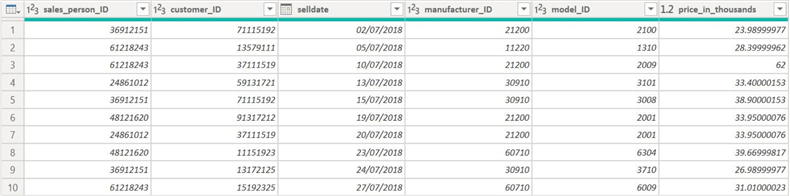
The sales_product table is now as follows:

Follow a similar methodology to populate the rest of the source tables.
Table 2: sales_customer
INSERT INTO sales_customer VALUES
(71115192, "Susie Bowman", 21200, 2100, "2018-07-02", "585 Meadow Lane Oakland", "Oakland", "626-555-0150"),
(13579111, "Marlon Caldwell", 11220, 1310, "2018-07-05", "1037 North Avenue", "Plattsmouth", "510-555-0143"),
(37111519, "Alfred Vasquez", 21200, 2009, "2018-07-10", "1585 Harvest Lane", "Missouri", "417-555-0171"),
(59131721, "Katie Welch", 30910, 3101, "2018-07-13", "3688 Bicetown Road", "New York", "631-555-0151"),
(71115192, "Susie Bowman", 30910, 3008, "2018-07-15", "585 Meadow Lane Oakland", "Oakland", "626-555-0150"),
(91317212, "Terrance Cruz", 21200, 2001, "2018-07-19", "1450 Olive Street", "Toledo", "734-555-0173"),
(37111519, "Alfred Vasquez", 21200, 2001, "2018-07-20", "1585 Harvest Lane", "Missouri", "417-555-0171"),
(11151923, "Courtney Rogers", 60710, 6304, "2018-07-23", "2164 Southside Lane", "Los Angeles", "323-555-0136"),
(13172125, "Melissa Shelton", 30910, 3710, "2018-07-24", "3970 Freed Drive", "Stockton", "604-555-0101"),
(15192325, "Bethany Raeys", 60710, 6009, "2018-07-27", "1611 Bottom Lane", "Buffalo", "716-555-0168");
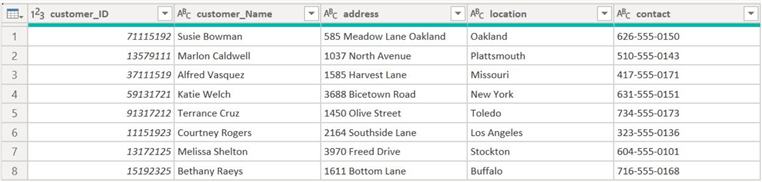
The resultant sales_customer table is:
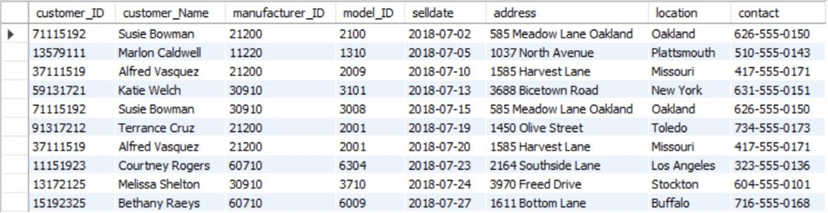
Table 3: sales_staff
INSERT INTO sales_staff VALUES
(36912151, "Floyd Clark", "M", 21200, 2100, "2018-07-02", "East"),
(61218243, "Morris Morales", "M", 11220, 1310, "2018-07-05", "East"),
(61218243, "Morris Morales", "M", 21200, 2009, "2018-07-10", "East"),
(24861012, "Pamela Schultz", "F", 30910, 3101, "2018-07-13", "West"),
(36912151, "Floyd Clark", "M", 30910, 3008, "2018-07-15", "East"),
(48121620, "Kurt Neal", "M", 21200, 2001, "2018-07-19", "West"),
(24861012, "Pamela Schultz", "F", 21200, 2001, "2018-07-20", "West"),
(48121620, "Kurt Neal", "M", 60710, 6304, "2018-07-23", "West"),
(36912151, "Floyd Clark", "M", 30910, 3710, "2018-07-24", "East"),
(61218243, "Morris Morales", "M", 60710, 6009, "2018-07-27", "East");
The sales_staff table is now as follows:

Create the Star Schema
Now that we have fully created our source tables, we can observe many technical defects in our data modeling approach. Most apparently, there is quite a bit of repetition of variables manufacturer_ID, model_ID, and selldate across all three source tables. At a large scale, this redundant approach induces expensive storage and is also more error-prone and difficult to maintain. An error in a single entry means that it will have to be corrected for all tables it was computed in.
To optimize our data model, we will split our source tables into a single truth table and multiple dimension tables and implement a star schema in Power BI.
First, we will connect Power BI with our database server.
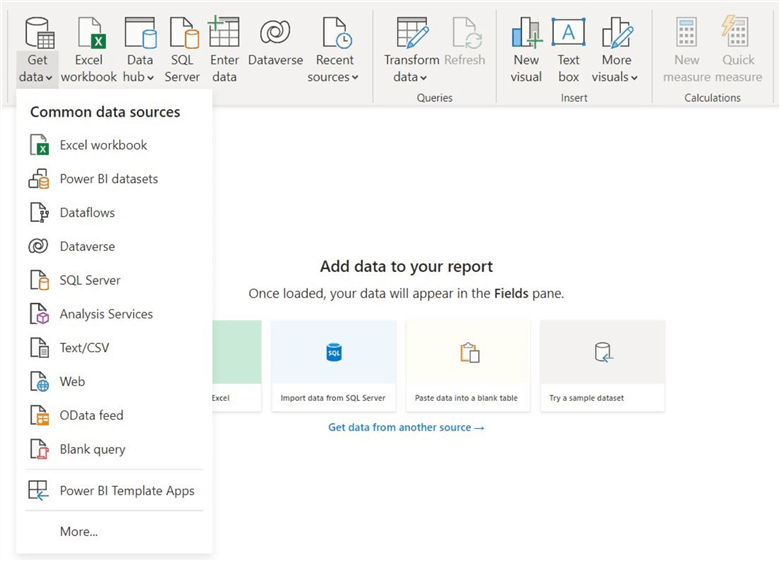
Step 1
At the top menu of the Data section, click on the "Get Data" option. This will yield a drop-down list with different channels to import your data.
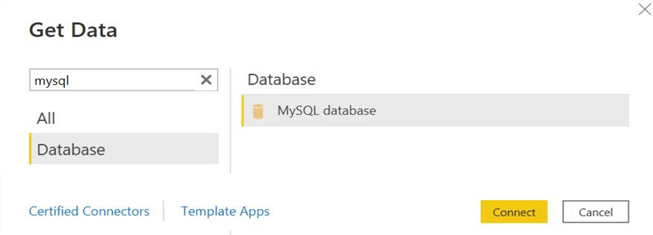
Step 2
Since we constructed our source tables on MySQL Workbench, click on the "More…." option at the bottom of the drop-down list and search for "mysql" in the resulting top left search dialog box. Click Database and select "MySQL Database". Click Connect.
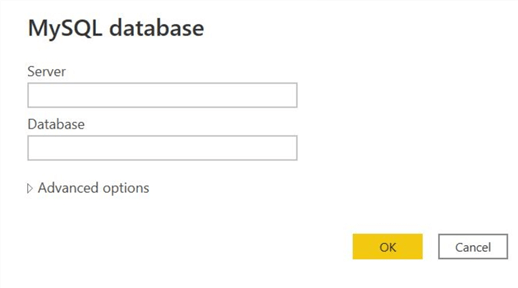
Step 3
The following window will appear. Input your server and database name and click OK.
Step 4
If the connection is successful, the following window will appear:
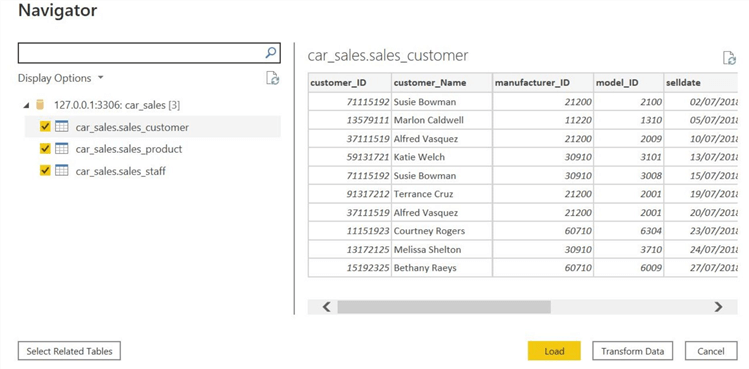
Now, we will select all our source tables. We can also individually preview them by clicking on each table’s name.
As discussed before, since we need to transform the source tables into fact and dimension tables, we will click on the "Transform Data" option.
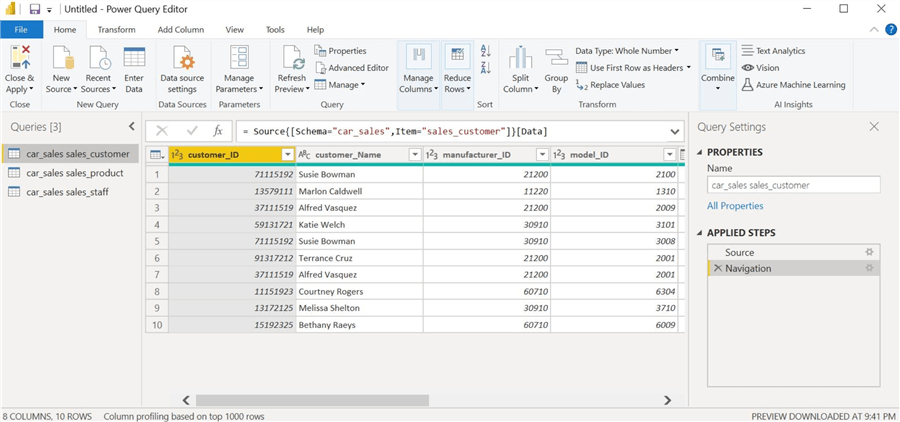
This will prompt the Power Query Editor window (below), enabling us to manipulate our source tables into a star schema in Power BI.
Step 6
Generally, at this point, a business entity will ensure that its sales datasets are clean and complete. This includes deleting duplicate entries, accounting for any missed observations, and any erroneous data entries. Our source tables are relatively clean with correctly formatted entries, so we will skip this step.
Step 7
We will now create our dimension tables.
Salespeople Dimension Table. We will duplicate our sales_staff query and then rename it to "DIM_salesperson" to prevent confusion and to mix with the original source tables.
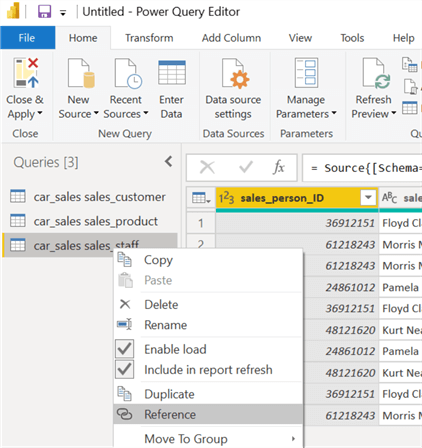
To do so, right-click on the table name. A drop-down list will appear. Select "Reference" to create a new query that references the actual sales_staff query. Select the "Rename" option from the same list to rename the query.
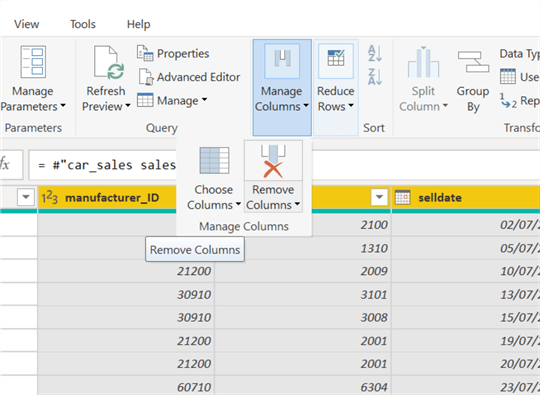
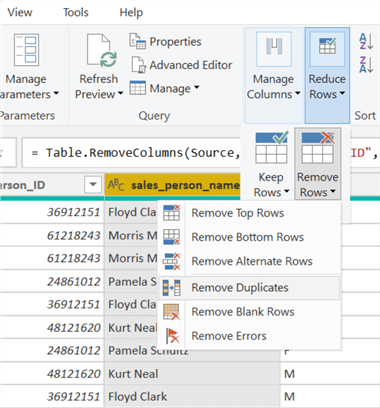
Drop manufacturer_ID, model_ID, and selldate from DIM_salesperson and proceed to delete any duplicate rows to preserve unique observations only.
Hold the "CTRL" key and select all unwanted columns. Then select "Manage Columns" and click "Remove Columns" as shown below.
To delete the duplicate observations, select any column, click "Reduce Rows" in the top menu, then "Remove Rows", and choose "Remove Duplicates," as shown below.
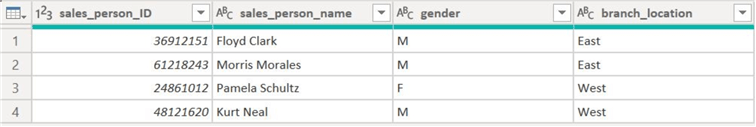
We will now be left with our salesperson dimension table, shown below.
We will follow a similar methodology to construct the rest of the dimension tables.
Customer Dimension Table. Let’s now create DIM_customer by referencing the sales_customer query. We will drop manufacturer_ID, model_ID, and selldate alongside any resultant duplicate rows to create our customer dimension table, as shown below.
Manufacturer Dimension Table. For our DIM_manufacturer, we will reference the sales_product query and drop everything but manufacturer_ID and manufacturer columns. We will also delete the duplicate rows and rearrange the column the get the following manufacturer dimension table:

Model Dimension Table. Again we will reference the sales_product query and drop all columns except manufacturer, model_ID, model, and vehicle_type. We will then delete the duplicated rows and rearrange the resultant table to yield DIM_model:

Step 8
Now, let's make our central fact table. Reference sales_product and rename the new query to FACT_carsales. Now, delete the manufacturer, model, and vehicle_type columns. There is no need to delete any observation as we are recording all car sales in our fact table.
Step 9
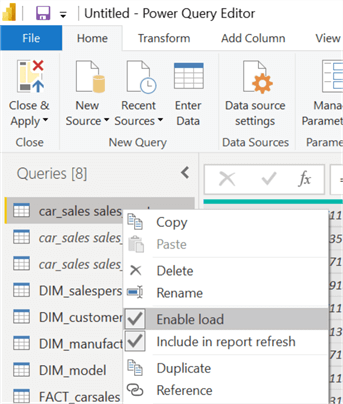
Since we are referencing the fact and dimension tables from the source tables, we cannot delete them. An alternate strategy would have been to duplicate the source tables and delete them later. In our current scenario, however, we can ensure they do not load on Power BI. To do so, right-click on your source query and click on the "Enable Load" option, so the checkbox remains empty. Repeat that for all of the source queries.
Step 10
Select the "Close & Apply" option in the upper left menu. This will load the queries on Power BI’s main interface.
Step 11
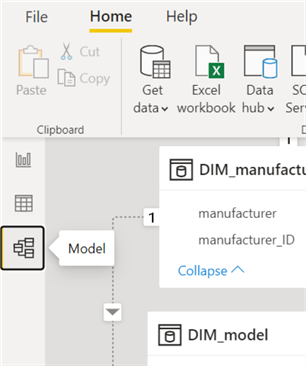
Once the data is loaded, we will go to the model view, as shown below.
Step 12
We can now set up relationships between the tables.
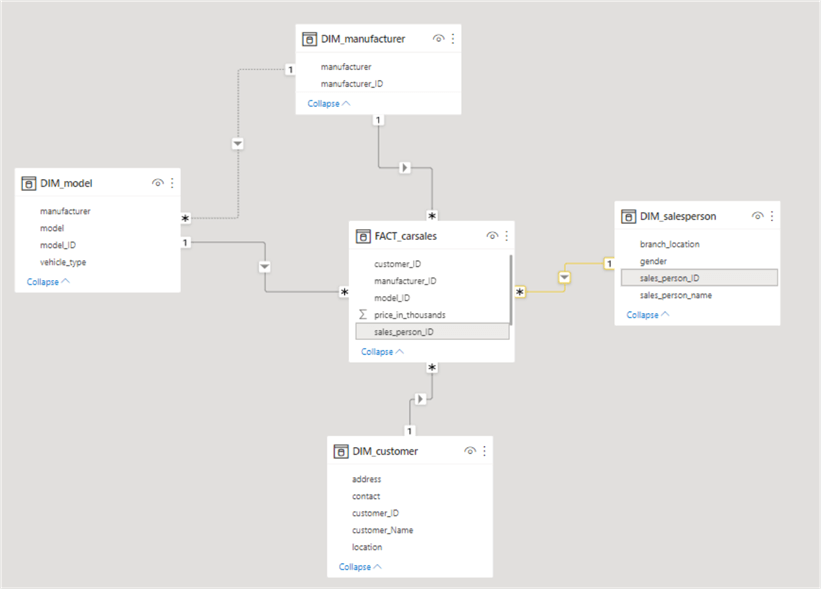
We can observe that Power BI has automatically connected our tables as the column names match. If we hover over the branches, the relationship becomes more apparent, as highlighted in the above demonstration. We can also see the one-to-many relationship between the DIM_salesperson and FACT_sales, as evident by the "1" and a "*" at the end of the branch.
We have now successfully implemented a star schema in Power BI. The model created can be quickly used for effective visualization in Power BI desktop.
So in the star schema, it is evident from above that it is easier to scale and maintain. If a new measure/fact comes in, we can easily manage it in the fact table. If necessary, we will add another dimension table to accommodate the entities associated with the new fact. However, on the contrary, in the source schema, it will be a hassle to decide where the new fact/measure will reside and how it will be managed. Similarly, if manufacturer_ID gets changed, we only have to change it in one table in the star schema, but in the source schema, it has to be modified in all three tables.
This is how we can leverage Power BI desktop to build the star schema quickly and effectively.
Next Steps
- Check out other Power BI Tips

Harris Amjad currently works as a Software Engineer at Strategic Systems International. He is Microsoft Certified Data Analyst and Microsoft Certified Trainer. A rigorous, task-driven Data Enthusiast with substantial experience in Data Science, Data Analysis, and Data Engineering.
- MSSQLTips Awards: Trendsetter (25+ tips) – 2024 | Author Contender – 2023, 2024 | Rookie Contender – 2022


Good
Good article.