Problem
I created some reports in Power BI Desktop. I loaded all the data as-is to the data model, but I find that writing DAX formulas are overly complex, and I’m not sure all the numbers are even correct. How can I optimize my model?
Solution
When building a dataset in Power BI Desktop, it’s important to model it correctly. Failing to do so can lead to incorrect numbers – the biggest fear of any data analyst – but also decreased performance. To fix these issues, you might need to write complex DAX. But writing long, complicated formulas can lead to mistakes and, even worse, performance. A good data model can prevent most, if not all, of these issues. This tip will go through some guidelines for an optimized data model.
Model Everything as a Star Schema
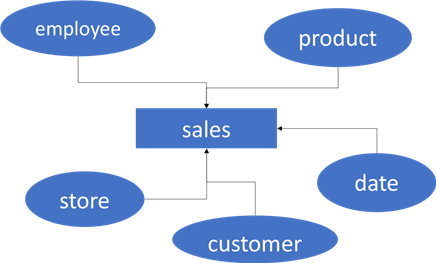
The best model for Power BI Desktop is a star schema. Star schemas have two types of tables:
- Dimensions. These contain descriptive data. They have many columns but typically not that many rows (hundreds to thousands, sometimes hundreds of thousands). Common examples of dimensions are customer, store, product, employee, and date.
- Facts. These track a process and contain measurements. They generally have fewer columns than a dimension but much more rows. Having fact tables with millions of rows or even more is common. Typical examples are sales, invoices, complaints, and consumption.
A star schema is created by linking multiple dimensions with a fact table, forming a star (hence the name):
Another name for star schema modeling is dimensional modeling, which was popularized decades ago in the book, The Data Warehouse Toolkit by Ralph Kimball. Using this type of modeling doesn’t mean you can only create one star schema in a Power BI Desktop file. You can create multiple and link them together using dimensions. These “shared dimensions” are called conformed dimensions. The following diagram shows product, date, and customer as shared or conformed dimensions. Employee and store are dimensions specific to the sales fact table, while return reason is a dimension specific to the returns fact table.

But why are star schemas recommended for Power BI?
- Modeling your data using facts and dimensions feels intuitive for the report users. Dimensional modeling is very common in data warehouse models. Even when another method is used (such as a data vault of 3rd normal form), dimensionally modeled data marts are put on top of the data warehouse to make reporting easier and faster. Instead of data being all over the place, it is neatly categorized in these two types of tables. When building a pivot table, for example, it’s easy to remember that dimensions go on the axis or the filters; fact tables show the actual measurements in the table.

- When the descriptive data is in the dimensions, you’ll typically use it in filters or slicers. Since dimensions are much smaller than facts, performance will be faster since Power BI doesn’t have to search the fact table for the distinct values to show on the filter/slicer, but also the filtering will be pushed down from the smaller dimension to the larger fact table.
- A star schema will lead to more intuitive DAX formulas and fewer “accidental errors.”
In the following two sections, we’ll show two use cases where changing the model to a star schema leads to easier DAX and fewer mistakes.
Use Case 1: One Big Table
A common “design method” is getting all the data into one big table. In some business intelligence tools, this is sometimes the only option. However, if you’re not careful, this can lead to mistakes in certain calculations. Let’s illustrate this with an example. Imagine we have a sales table that also includes some customer data:

Now we want to know the average number of children per customer. It would be tempting to calculate a normal average on the TotalChildren:
AVG Children = AVERAGE(Sales[TotalChildren])
However, this is incorrect. The problem is that if a customer makes multiple orders, their details are repeated in the table. This means you are calculating a weighted average. The more orders a customer makes, the more their numbers influence the average. To fix this with code, we need to write a more complex DAX function:
AVG Children Correct = AVERAGEX(
    SUMMARIZE(Sales,Sales[CustomerKey],Sales[TotalChildren])
    ,Sales[TotalChildren])
This formula first creates a virtual table with all the customers and the number of children they have. Then, the average is calculated. Here’s the result of the two formulas side-by-side:

We get more complex formulas because the dimensional data is stored together with the fact data. In a star schema, the customer data has its own table, and you only have one row per customer. Once this is done, you can calculate the average using the first formula.
You can download the sample .pbix file to test it.
Use Case 2: Normalized Data
When your source for the Power BI report is a normalized database, importing the data as-is into the model is tempting. However, leaving the data normalized can lead to more complex DAX as you need to traverse more relationships. Normalized databases are optimized for writes (inserts, updates, or deletes) but not necessarily for reads. Let’s suppose we have the following data model based on the Adventure Works OLTP database:

When a user who’s not familiar with the model tries to analyze the Total Due amount (which is found in the sales order header) by product size (which is in the product dimension), the following is returned:

The reason for this is that the relationship between the sales order header table and the sales order detail table only allows filtering from header to detail:

Because selecting a product size doesn’t filter the header table, we get the same result on every row: the total due amount for all rows. There are two ways this can be solved without significant remodeling:
- We set the relationship to bi-directional filtering. This allows the product table to filter the header table. But setting relationships to bi-directional is not considered a best practice. It can lead to unwanted side effects, performance issues, and possibly an ambiguous model (where one filter action can lead to multiple filter paths to another table, which can give inconsistent results).
- Instead of setting the relationship to bi-directional filtering on the model itself, we can explicitly set it in a measure. This has the advantage that it’s only allowed for a specific use case. This can be done with the CROSSFILTER function. The DAX for this measure becomes:
TotalDue_CrossFilter = CALCULATE(SUM(SalesOrderHeader[TotalDue]),CROSSFILTER(SalesOrderHeader[SalesOrderID],SalesOrderDetail[SalesOrderID],Both))
A better method would be to remodel. By combining the header and detail table into one sales fact table, we can avoid the issue, preventing the use of more complex DAX formulas.
Check out the model by downloading it here.
Conclusion
By modeling the Power BI dataset as a star schema, we can avoid complex DAX formulas for specific use cases. It also makes the model more intuitive, and it has better performance.
Next Steps
- Do you know exceptions to this best practice? Let us know in the comments!
- Power BI experts Marco Russo and Alberto Ferrari explain why a star schema is usually the best option in the articles Star Schema or Single Table, The importance of star schemas in Power BI, and Header/Detail vs Star Schema models in Tabular and Power BI.
- Patrick from Guy in a Cube explains the same benefits in the video Why Power BI loves a Star Schema.
- Check out the tips Power BI Best Practices and Development Best Practices for Power BI for more guidelines around Power BI development.

Koen Verbeeck is a seasoned business intelligence consultant with over a decade of experience with the Microsoft Data Platform. He holds several certifications, including Azure Data Engineer. He’s a prolific writer, with over 375 articles on technologies such as Microsoft Fabric, SSIS, ADF, SSAS, SSRS, MDS, Power BI, Snowflake and Azure services. He has spoken at various events such as PASS, SQLBits, dataMinds Connect and many others. He frequently delivers educational webinars on MSSQLTips.com. For his efforts, Koen has been awarded the Microsoft MVP data platform award for many years.
- MSSQLTips Awards:
- Leadership Award (200+ Tips) – 2021
- Author of the Year – 2014/2020/2022
- Author Contender – 2024/2025


Nice article. I like how you show the dangers of one table and just taking the relational DB. I’ve been reading the Kimball books. I especially recommend the Kimball Group Reader, a collection of blog posts from 1995 to 2015. Also Chris Adamson’s blog is a good source of star schema goodness, as well as his Star Schema book.