Problem
Microsoft Power BI is used by more and more data professionals each day. Just like with any tool, there are good practices and bad practices. In this article, we will look at things you should know in order to make the best use of Power BI for your reporting needs on-premises as well as in the Azure and AWS clouds.
Solution
As Microsoft Power BI has grown and matured over the past five years or so, certain practices have surfaced that provide a rich and successful report consumer experience. This tip will discuss several best practices, some practices will be rooted in common sense solutions, while others will not seem as clear, common, or obvious. Some of the practices will even permeate to design work you for additional tools such as SQL Server Reporting Services or even other reporting and dashboard tools.
As with any best practice, there will be variations in opinion, so be sure to review the opinion of other well-versed writers on Power BI. However, generally, you will find several common threads throughout these practices.
Getting started with Power BI Desktop begins by downloading Power BI Desktop from Microsoft’s website. A tip called Power BI – How to Download and Get Started is a great first read to get you moving with Power BI Desktop. We will also use the WideWorldImportersDW database from GitHub as a basis for our data sources.
Best Practice #1: Prepare and Know the Data
The first best practice to follow when using Power BI is to use “finely curated” data. All too often, a BI designer will immediately dive into developing the dashboard without first checking the data being used as the data sources and if data sets are in a state suitable for Power BI. As we all know, some data come to the dashboard designer as a fine-grained end product with a detailed data dictionary and maybe even a well-documented data model. Of course, the availability of those items is often the exception and not the standard order of business in many organizations. Thus, as the report and dashboard designer, it behooves you to get to know both structure and content of the data being used.
Note: It is recommended to check out this tip, SQL Server Database Diagram Tool in Management Studio, for the SQL Server version of database diagrams. Additionally, see this tip, SQL Server Database Diagram Index was Outside the Bounds of the Array, if you are running into an error with the Management Studio diagrams.
To understand the context of the data, the following are helpful ideas to consider:
- Discuss the data, its purpose, and its source with the business/data owner
- Determine the quality, timeliness, accuracy, and privacy of the data
- Determine the valid values and metrics for many of the common fields
- Ask the business/data owner to prototype a report for you
- Determine the uses of the dashboard – real-time, data analytics, statistics, trending, etc.
- Determine who will be using the dashboard – the view for the CFO would likely be very different from the view of a sales executive
- Determine if interactions and drill down are needed
Next, you will want to learn about the technical specifications of the data, including:
- If primary and foreign keys are set up, which will assist with relationships
- If appropriate data types are used, and, if not, determine what the appropriate data should be
- What are the data sizes
- How the data can be imported into Power BI, including appropriate drivers/sources in Power BI
- The level and grain of the needed data
- The performance of the data imports/queries
One area open for discernment centers on whether your business logic should reside in the database or in Power BI. This is up to the organization’s philosophy and whether you envision Power BI as the main business processes tool or if the database will handle that item.
Certainly, there are other ramifications surrounding data knowledge and structure, but these items are the first steps to creating a great dashboard.
Best Practice #2: DAX or M
Within Power BI, there are multiple ways to complete a task or process, with the decision centering on whether you would use M in the Power Query Editor.

Alternately, many similar tasks can be completed in the Design grid, specifically using DAX formulas and the Modeling tab. A few DAX items will be covered later in this tip.

Generally, the decision is dependent on the data and its structure. For instance, if two tables need to be appended together, then that process should be handled in the Query Editor. Likewise, if joins need to be completed with some complexity or involve multiple fields, that should often occur in the Query Editor. However, if the joins are simple, then that process can usually be completed in the Manage Relationship area of the design grid modeling tab.
The best practice here is to create a data set/data source as nimble as possible in the Query Editor/M option. This method means a smaller data size, likely faster load/import time, and the ability to take advantage of query folding. On the other hand, if you need to perform row-by-row calculations or create dynamic-type calculations, DAX is often the better option for completing those tasks.
Best Practice #3: Choose Visuals Wisely in Apps
Ever heard the phrase, “Just because you can, does not mean you should.”? Dealing with visuals, a dashboard or report designer is telling a story. No one likes a confusing story, especially in most corporate or government organizations. Yet, all too often, a well-meaning but inappropriate set of visuals is created to convey specific information about a set of data. Unfortunately, using a visual not designed to convey a specific story can easily lead to confusion or misunderstanding by the report viewer.
Here is a list of several tips that can help in deciding which visual is best in a particular situation:
- Correlation Analysis using Correlation Plot in Power BI Desktop
- Power BI Key Influencers Visual
- Power BI Visual Interactions
- Power BI Small Multiples Visual Example
- Power BI Pulse Charts
- How to Increase the Vertical Orientation of Power BI Report Page
- Analyze Interrelationships with Chord Diagram Visualization in Power BI Desktop
Of course, there are additional helpful tips available in this area, including Story Telling with Data.
Best Practice #4: Performance is Key in Apps
Performance is a critical component of the dashboard experience. As such, a Power BI designer needs to know the best ways to speed up performance on a dashboard.

Image source: http://dev3lop.com/wp-content/uploads/2018/01/plotly-data-visualization-dashboard-example-1.jpg
Several practices can assist with keeping performance at its peak and that starts with planning the dashboard’s design, meaning a report designer should limit the number of individual visuals and other objects on a dashboard. Including too many visuals and other objects, such as slicers, can slow down initial views and refreshes after a slicer or filter is changed. If either of these views takes more than 10 to 30 seconds, maybe up to a minute, it is likely too long to wait between initial viewing or refreshes of the dashboard. Report consumers expect dashboards to be fully interactive. Due to the interactive nature, the expectation is often that changes will occur in seconds, not minutes. The more visuals on a report tab, the longer the refresh will take of those visuals.
An idea to address this type of issue is instead of having copious amounts of cards on the dashboard, rather consolidate all the cards into a single table or matrix. This will decrease the refresh time by many multiples.
Likewise, limiting the number of calculated columns and measures that use DAX can also improve the performance of the dashboard itself. Reminder: a calculated column happens on every row. If these calculations are moved to the Query Editor and M, the calculation time will occur when the data set is loaded in the Query Editor (on the online service refresh).
Finally, attempt to limit the level of detail shown initially. Set the grain for the graphics appropriately and at the highest level available. If drill down or drill through is needed for further detail, it can easily be added to the visual through filters and slicers on top of regular drill through actions. See these tips for some ideas on how to best use drill down and drill through techniques:
- Power BI Drill Through Example
- Data Exploration, Drill Down, and Analysis Using Decomposition Tree in Power BI Desktop
Best Practice #5: Security in the Design
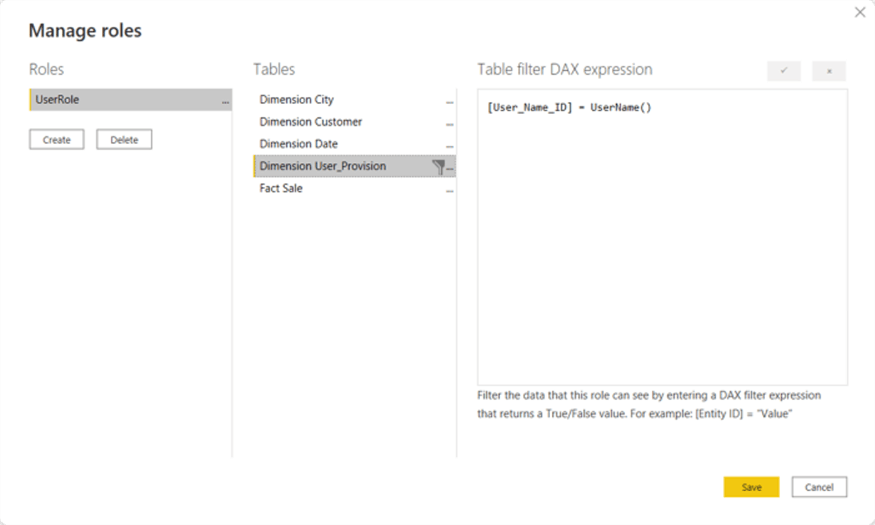
Most database professionals, including data engineers, analysts, and scientists, are well aware of the ramifications and impacts security has on our job duties, design efforts, and development work. We need to be continually monitoring the best practices in this area. For Power BI, Row Level Security is one of the deeper layers to restrict access to data based on the setup of the security roles. Through the user of roles (see below), dynamic or static, data access can be restricted to only those authorized to access the data on a Power BI report.
Here are two tips that can help get the security set up and working for your organization:
In addition to providing restricted access at the data set level, Power BI also offers the opportunity to control access at the workspace level on the Power BI Service. Workspaces are somewhat like a file directory; however, this level of access limits users from seeing the note dashboards in a particular workspace.

Here is an article that dives deep into setting up the workspace security: Power BI Workspace Permissions and Roles.
Best Practice #6: Dashboard Visual Flow
Although some folks would say this item is not important for most Power BI users and consumers, they need to follow the flow of the story the dashboard is telling. This means using appropriate colors and, more importantly, placing the most significant visual in the appropriate location. In western cultures, where one reads left to right, that means putting the most crucial visual in the upper left corner of the dashboard.

As visuals become less critical to the user or are tangents to the vital visual, they should be placed to the right and downward, as shown below. In other cultures, reading occurs from right to left, so dashboard visuals should be created to flow in that direction. Ultimately all these items are to benefit the dashboard consumer.

Other ways to help with telling the story on the Power BI dashboard include:
- Using a standard theme on all reports
- Using appropriate formatting on visuals
- Setting up appropriate report page sizes
- Creating reports for mobile apps (iOS and Android), if needed
Conclusion
Power BI continues to be a go-to tool for dashboard and business intelligence development. As this growth continues, it would be wise to establish both community and organizational best practices that can be followed. In this tip, we covered some of the basic best practices that can be used in Power BI development.
Next Steps
- Check out these other Power BI Tips
- Analyzing Power BI data with Excel
- Create Power BI Connectors to Azure SQL Database

I have a passion for crafting Business Intelligence Solutions for my user groups. My experience includes almost 15 years of SQL Server involvement with the last 12 years focused specifically on Business Intelligence, SharePoint, OLAP, SSRS, and Decision Support solutions. Currently, I am a Business Intelligence Architect in the healthcare industry, and I also teach database and analytics classes for Kennesaw State University, Southern New Hampshire University, and Reinhardt University. My education includes an MBA and an undergraduate in Accounting (yes I am a reformed accountant!), both from Kennesaw State University. I enjoy every day by trying to grow my faith and spend precious time with my family. I have been happily married to my wife of over 20 years, and we have two teenagers one who we home school with the help of a University Model School, Cornerstone Prep in Acworth, GA (cornerstoneprep.org). Our other child is a Construction Management major at KSU’s Southern Poly / Marietta campus. We are a soccer and Cross Country (XC) family who play, coach, and referee soccer or run for fun most every day. For several years, our family has volunteered (and played with the dogs and cats) at Etowah Valley Humane Society in Cartersville, GA.
- MSSQLTips Awards: Champion (100+tips) – 2016 | Author of the Year – 2015 | Author Contender – 2014, 2016-2021


