Problem
How do I download and get started using Microsoft Power BI for my organization’s business intelligence needs?
Solution
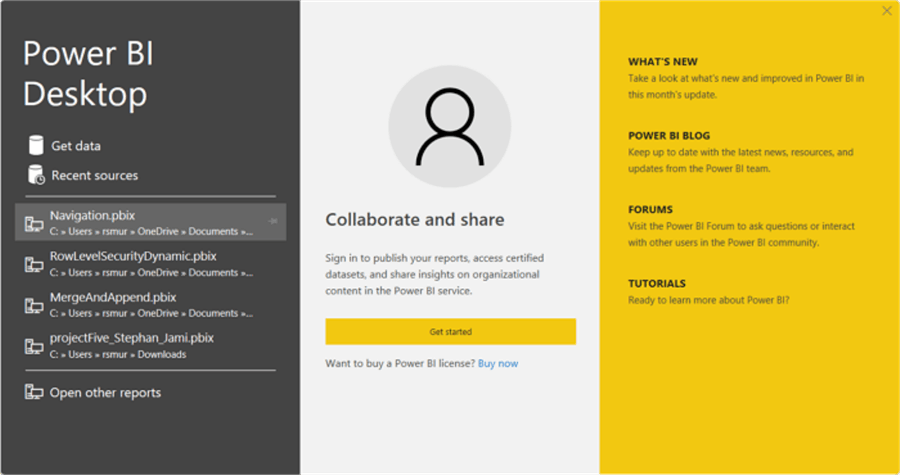
Getting started with Microsoft Power BI Desktop is actually not significantly complicated at the base level, but thinking about using Power BI in an enterprise context certainly requires research, analysis, use case reviews, and ultimately at budget evaluation. Furthermore, Power BI can be used at all levels of organizations along with all sizes of organizations from a small 1-person organization to a large multi-location, global organization. However, to get started without answering all the above questions, is as easy as downloading Power BI, selecting your data source type (on-premises data, cloud platform, etc.), and then creating a query against that data source. Thus, the first step is to download the Power BI application as noted below.
Within this tutorial, we will be showing how to install the Power BI Desktop, and then use it for several next steps. Thus, to get started Power BI Desktop must be downloaded. Additionally, we will be using the WideWorldImportersDW database as a basis for our data sources. This database can be downloaded from GitHub.
Download Power BI Desktop, Install, and GO!
Downloading any tool can be a challenge on just about any machine. A couple of quick requirements are required for the machine where you will be installing Power BI. These requirements include:
- Use a Windows based machine including Windows 10, Windows 11, Windows Server 2019, Windows Server 2016 among some other Windows machines versions
- Use 32 bit or 64-bit machine and compare it to the installation file
Downloads can take place manually from the above-mentioned site. As an alternative to the manual download, Power BI Desktop can be downloaded from the Microsoft.com APP Store.

One of the advantages of using the Microsoft Store is that updates are often automatically pushed to your machine. As these updates generally occur monthly, having an automated push certainly helps to keep you on the latest version of Power BI Desktop with minimal interaction. Certainly, some organizations block access to the Microsoft store, which leaves the report designer needing to update the application manually. Note, you will get a prompt in Power BI Desktop, in the bottom right corner of your application, which notes that a new update is available.
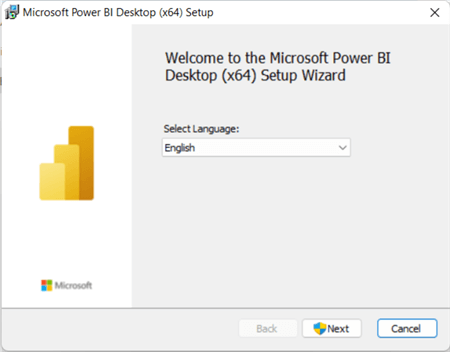
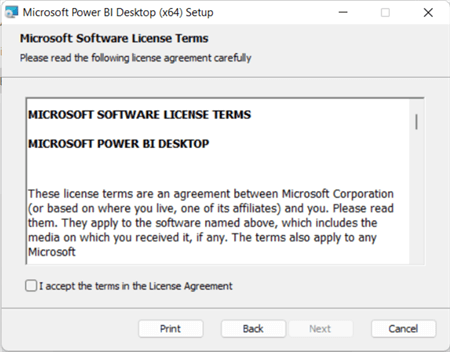
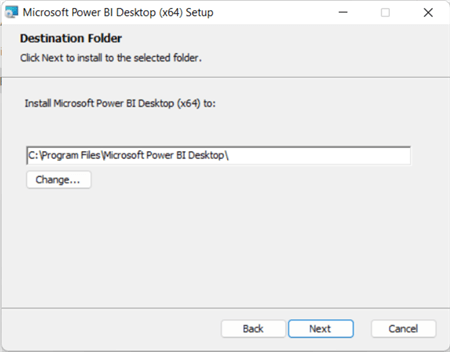
Installing Power BI Desktop is as easy as most Windows installs; you select a language, agree to the terms of service (you read them, right?), and selecting the install file location.
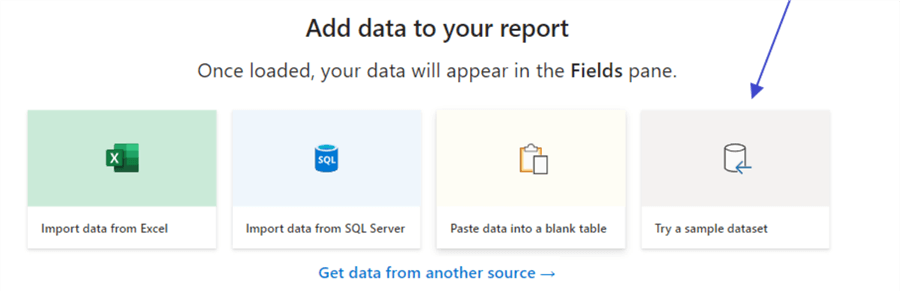
Once you are ready to get started with Power BI Desktop, you must decide where your data sets will be sourced. Obvious choices would be database systems such as SQL Server, Oracle, or Teradata, but also some not so obvious choices like html tables from a website or json files sourced either locally or maybe on a website or API. Similarly, you could also use content that was published to the Power BI service by your organization (curated data sets).
If you do not have any readily available datasets, the best option is to use the sample dataset provided with Power BI. Selecting the Try a sample dataset option provides a tutorial option along with an option to load sample data set.
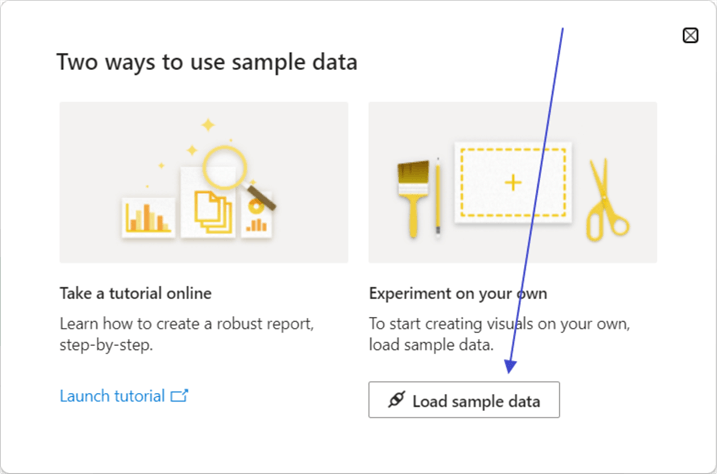
The sample dataset contains a set of basic sales details, but it a useful place to start designing your first dashboard. To be frank, if you have your own dataset, especially one that may contain multiple tables, it would be useful to use that dataset if available for testing and exploration.

Likewise, Microsoft has provided some additional and more complex sample datasets and pbix files (pbix files are the file type used by Power BI). If you use these samples, it is best to download Excel files or pbix files for your use.
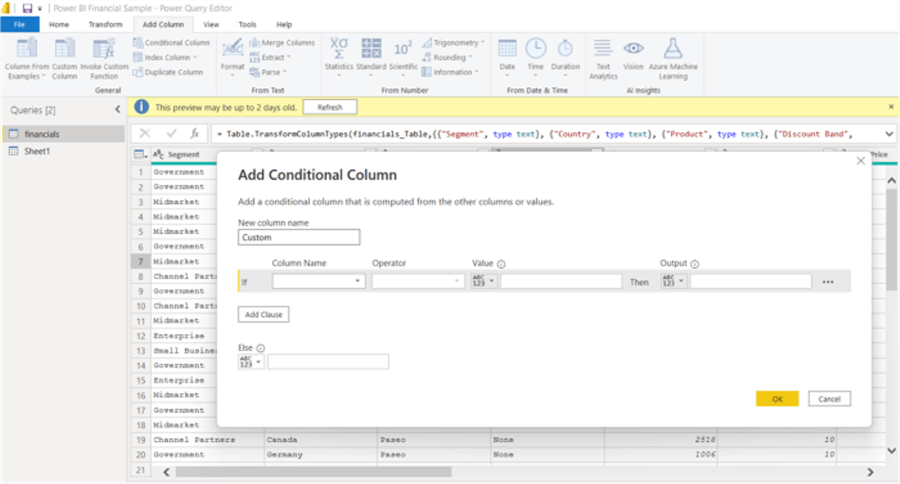
You will notice in the above screen print that upon selecting the data import, the load data “Navigator” screen opens, often this is where some of the confusion with Power BI starts. First you must select the tables / queries you would like to use as your data source(s) by checking the appropriate boxes next to each data source name. However, the broader choice that must be made is whether you select the load option or the transform option. The transform option brings up the Power Query Editor. This allows for the implementation of steps to adjust the data in columns in rows by doing such things as filters, adding columns, modifying data types, parse column data, and just about any other way to transform data or adjust columns.
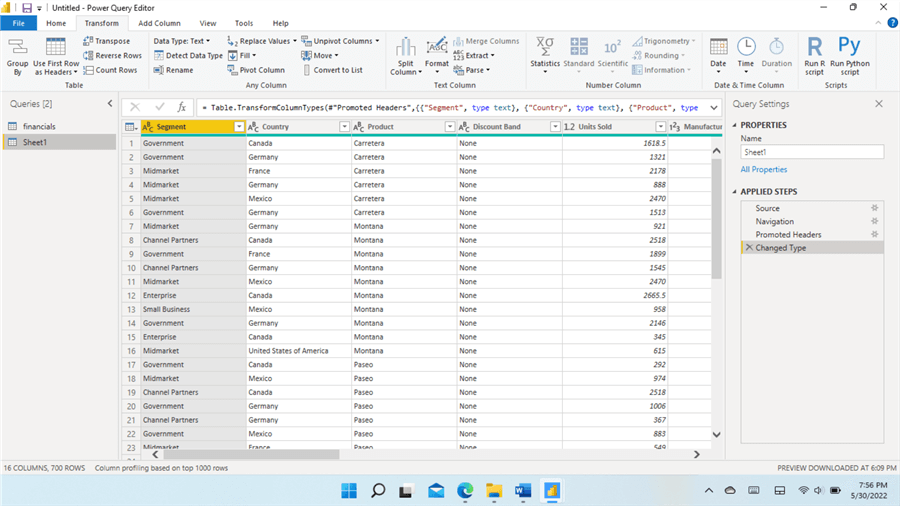
All of these changes are completed in the M language, step by step. The ordering of those steps can be rearranged while steps can also be deleted / removed completely as needed.

As shown above the advanced editor allows for the writing of M code by hand which is convenient when special coding in M is required, or you need to copy a large number of steps.
As an alternative, many, but not all of the transformation that can be achieved in the query editor can also be achieved in the design grid by creating new columns or measures via DAX or by adding filters or slicers. Like M, DAX is a tool that can be used to create and add logic to new columns and measures.

As you are just starting out, the broader question is whether to do all your work in the query editor or the design grid. Which is better, more efficient? Where should I do my database modeling? Of course, the answer to these questions is….. it depends. However, we can certainly provide some guidance. Generally, if work can be completed in the query layer, I will often recommend completing transformations in that layer. Especially when dealing with filtering methods, completing the processes in the query editor can provide performance and storage benefits which are not available in DAX. Additionally, joins can take place both in query editor via merge which allows for multiple key joins (and append for unioning)); on the contrary, joins are easy to complete in the design grid using the manage relationship option (see below). However, using this method, only one field can be used as the join field.

Similar to the relationship options for joins, both query editor and design grid allow for the creation of new fields, and each offer both manual and GUI.
Nevertheless, using the design grid, two options exist for adding a field, and unlike the previous option about where to work with the data model, the selection of a particular option here much clearer. Either a column can be added or a measure. The difference between the two is significant, although both are created and coded using DAX. A column occurs row by row, so every row is evaluated to determine the appropriate values. However, a measure evaluates based on the entire data set, so it is generally used for aggregation type of fields; something like a total of ALL sales for instance. Since a DAX column evaluates row by row, it can trigger performance issues when interacting with the design grid within extremely large data sets.
A couple of other points need to be made at this juncture. Depending on the structure of your organization, business logic and related code may reside in the data model in Power BI OR it may be such that business logic resides completely with the database via ETL/ELT using tools like SSIS or DBT. Either way the data must reside within the model in query editor which establishes the source for the next steps in the design process.
A second item that is often recommended is the establishment of a data table. Depending on the granularity and the level or aggregation need for your date and time series, it is often advantageous to create a data table as opposed to using the built-in date hierarchy added to every date field in a data set. This tip shows the process of creating a data table in M: Create Calendar Table Using Power Query M Language while this tip reviews the process for creating a date table in DAX: Creating a Date Dimension Table in Power BI. Furthering this point is this tip which outlines why using a date table can improve performance and create a much more nimble process: Improve Power BI Performance with Auto Date/Time and DAX Variables.
At this point, you are probably wondering when we will ever get to the dashboard creation step; that is the next step in the process, but to get here, the data need to be well formed and be ready to use which was all the prior steps. Likewise, this step may seem to be “easy”, but the report designer must keep in mind that the visuals tell a story. That story needs to be:
- Clear
- Easy to follow
- Require little additional explanation
- In many cases interactive including filtering and drill down
- Be properly labeled, both at the visual, sheet, and dashboard levels
- Use appropriate colors and color palettes (choosing colors for data visualization — storytelling with data)
- Garner additional questions (but not from lack of clarity)
- Follow any organizational standards including coloring, logos, and security
- Not too cluttered (3×3 objects is often a good starting point)
The actual process of adding the visual is simple; select the visual and drop it on the grid. Add appropriate measures, categories, series, legends, etc.
The tips can help you with the design:
- Power BI Visual Interactions
- Power BI Desktop Custom Visualization
- Generate visualizations in Power BI using Python Scripts
- Power BI Report Conditional Formatting for Matrix and Table Visuals
- Power BI Custom Infographics
- Power BI Small Multiples Visual Example
- Dynamically Show or Hide a Visual in Power BI Based on Slicer Selection
- Anomaly Detection without any coding using Power BI
Plus, many more tips you can search for at: SQL Server Power BI Tips.

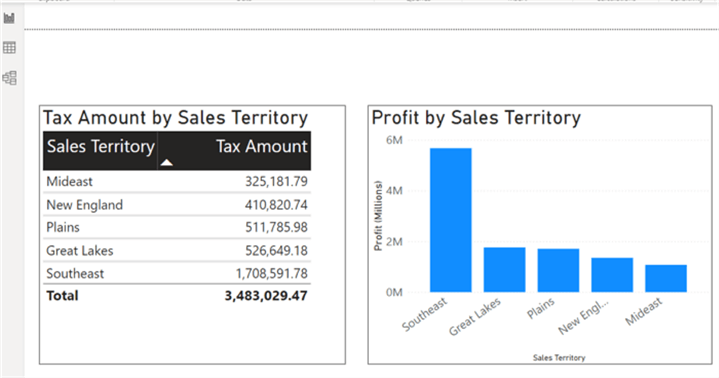
Thus, using the example below, we can start to formulate a better dashboard view. The below visuals have several good points with the table headers being clear as is the bar chart header. The ordering of the figures in the table and the bars on the chart are both inline with easy reading. However, we could do better. First, borders around both visuals would likely be helpful. Also, the x axis is easy to read (except the label), but y axis is not. Also, it is normally a good practice to set the headers to an equal height and width if possible.

By adjusting a few of the formatting properties for the visuals on the dashboard, a more well-balanced dashboard begins to take shape, as illustrated next.
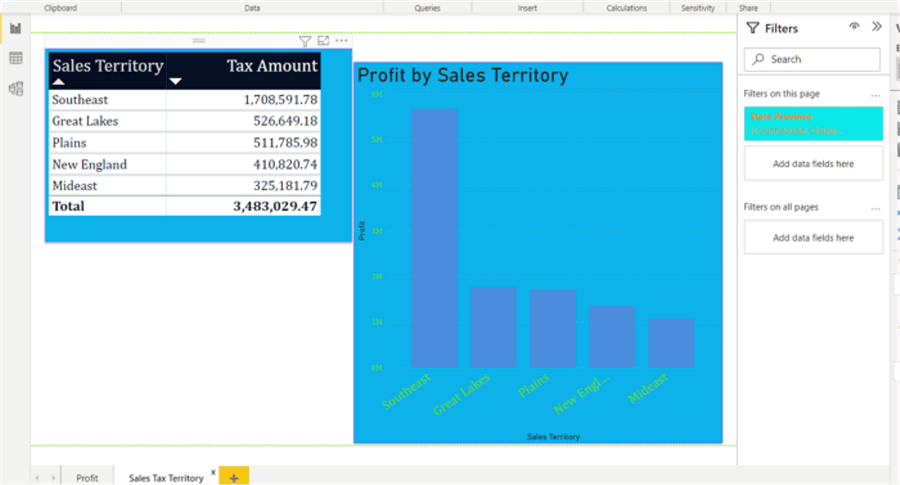
The below example actually shows going in the wrong direction for the design. The color palette is hard to see with the blue background, and then yellow labels on the axis. The actual visual tiles are not balanced at all. Between just those two items, the effectiveness of the dashboard diminishes.
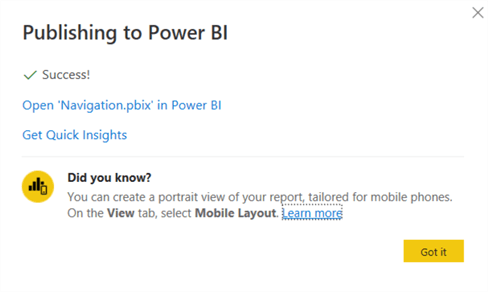
Once your dashboard is complete in Power BI desktop, the next step is to publish to the Power BI Web Service online. By publishing to the web, you are taking the dashboard that was available only to you (outside of sharing the PBIX file) and allowing others to view it. You will need a Power BI organization account in order to complete the publishing process as Microsoft only allows organizational emails to setup an account (i.e., no gmail.com, yahoo.com, outlook.com, etc). After logging into the account and clicking the Publish button provides the ability to select which workspace (which is sort of like a container or folder) to publish the dashboard to; these tips could be helpful concerning workspaces: Power BI Workspace Permissions and Roles and Managing Power BI Workspaces with PowerShell.
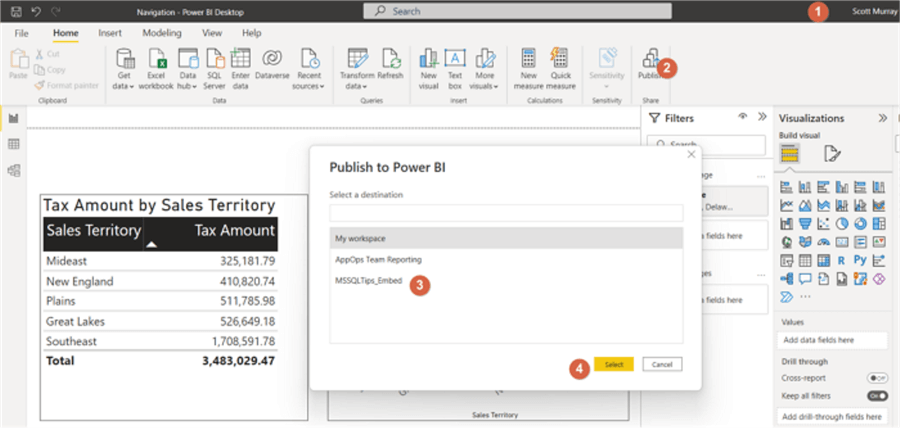
Finally, once publishing is complete, we can navigate to the Power Bi Service.

In this tip, we covered the basic steps to getting started with Power BI. The first step centers around importing the data. Next, the data must be curated to get the model in a position to be used for the last step which is adding visuals along with related data fields and measures.
Next Steps

I have a passion for crafting Business Intelligence Solutions for my user groups. My experience includes almost 15 years of SQL Server involvement with the last 12 years focused specifically on Business Intelligence, SharePoint, OLAP, SSRS, and Decision Support solutions. Currently, I am a Business Intelligence Architect in the healthcare industry, and I also teach database and analytics classes for Kennesaw State University, Southern New Hampshire University, and Reinhardt University. My education includes an MBA and an undergraduate in Accounting (yes I am a reformed accountant!), both from Kennesaw State University. I enjoy every day by trying to grow my faith and spend precious time with my family. I have been happily married to my wife of over 20 years, and we have two teenagers one who we home school with the help of a University Model School, Cornerstone Prep in Acworth, GA (cornerstoneprep.org). Our other child is a Construction Management major at KSU’s Southern Poly / Marietta campus. We are a soccer and Cross Country (XC) family who play, coach, and referee soccer or run for fun most every day. For several years, our family has volunteered (and played with the dogs and cats) at Etowah Valley Humane Society in Cartersville, GA.
- MSSQLTips Awards: Champion (100+tips) – 2016 | Author of the Year – 2015 | Author Contender – 2014, 2016-2021


