Problem
I’m trying to tune a Microsoft SQL Server query for improved performance and not having much luck. Could the user defined function (UDF) in the SQL Server query be part of the problem? How can I determine that? If it is part of the problem, what can I do about it?
Solution
UDFs can be very appealing to new T-SQL developers, especially those from a more traditional procedural programming background. They allow for higher code reuse and can simplify the readability of code. Unfortunately, SQL Server uses set-based programming and often does not perform as well when UDFs are used. Making matters worse, many common T-SQL performance tuning methods don’t accurately report the effects of UDFs on queries. This tip will explore this problem and how to work around the issues.
All the demos will be run using SQL Server Management Studio (SSMS) against an instance of SQL Server 2019. The target database is WideWorldImporters, a free sample database from GitHub.
Create a Baseline for Comparison
To start, a baseline of expected performance needs to be set. Then a UDF will be introduced to see how SQL Server reacts. Consider this simple query:
SELECT OrderID FROM Sales.Invoices WHERE OrderID = 11323;
Using traditional performance tuning methods of including statistics io, statistics time, and an actual execution plan returns these statistics. If these concepts are new to you, check out How to Make Query Execution Faster in SQL Server and SQL Server Performance Tuning with Exeuction Plans and New Indexes.


The query needed only 2 page reads on a single index seek operation. It completed in under 1 ms (millisecond). This is about as tuned as a query can be.
Now consider this query:
SELECT MSSQLTIPS = AVG(Temperature)
FROM Warehouse.ColdRoomTemperatures_Archive
WHERE ColdRoomSensorNumber = 2;
This query runs against a much larger table and reports the need for over 9000 reads. It took about 750 ms.

The plan is much more involved than the previous query.

Finally, the bad query will be turned into a UDF. The data type for sensor was chosen incorrectly on purpose to make the UDF as bad as possible.
CREATE FUNCTION dbo.GetTemp (@Sensor CHAR(12)) RETURNS DECIMAL(10,2)
AS
BEGIN
  DECLARE @MSSQLTIPS DECIMAL(10,2);

  SELECT @MSSQLTIPS = AVG(Temperature)
  FROM Warehouse.ColdRoomTemperatures_Archive
  WHERE ColdRoomSensorNumber = @Sensor;

  RETURN @MSSQLTIPS;
END;
Missing Query Plan Information Doesn’t Help Tuning Queries
It is time to combine the first demo query, which ran in under 1ms, with the UDF of the second query, which took 750ms.
SELECT OrderID, dbo.GetTemp('2') Temp FROM Sales.Invoices WHERE OrderID = 11323;
This query will read data from both tables, Invoices and ColdRoomTemperatures_Archive, yet somehow, the statistics io output reports only the Invoices table. The execution time appears to be accurate.

The query plan is no help either. It shows only the seek associated with the Invoices table.

How does one tune a query that only does two reads as part of a single index seek operation but takes almost 1 second to complete? We know another table is involved in this demo, but that won’t always be the case when reviewing existing code in a real-world scenario. Imagine a scenario where the query is hundreds of lines long. The plan is long and involved. If the real problem was in one of several UDF calls, it could be incredibly difficult to diagnose the root cause of the performance issue without visibility into the execution of those UDFs.
Finding the Hidden Query Cost of UDFs Using Query Plans
The first place to look for UDF execution information is the estimated execution plan. Earlier in the demo, the actual execution plan was used. This feature is activated via a different button or keystroke operation. This screenshot shows the button and keyboard shortcut needed to get the estimated plan.

Unlike the actual execution plan, this plan will appear almost immediately. That is because it does not execute the query first and then display the plan; it just generates and displays a plan. The query is not executed as a part of this operation. Other scenarios where an estimated plan is useful are situations where a plan is desired, but the query cannot be executed. This could include when tuning insert, update or delete statements or when the query execution is expected to take too long, and the developer doesn’t want to wait for it to finish to view the plan.

While the actual execution plan left out information related to the UDF, the estimated plan includes it! The UDF itself is listed by name (green highlight in the plan). It is immediately apparent that the UDF is where the performance problem is. The percentages at either end of the red line make that very clear. It even suggests how to improve the performance of the UDF in the yellow highlighted section.
Finding the Hidden Query Cost of UDFs Using Live Query Statistics
Another way to get performance details related to UDFs within a SQL query is to use Live Query Statistics. Just like the actual execution plan button, to view this information, the feature must be enabled on the query window before executing the query. The button to include Live Query Statistics is shown in the screenshot below.
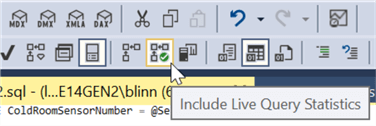
Executing the query again with this feature enabled brings about a new tab in SSMS that shows the query plan. This query finished in under 1 second, but if the query takes long enough to execute, the data can be viewed moving in real-time. Just like running the estimated execution plan, the output includes information about the UDF.

Final Thoughts
SQL Server often works better when UDFs are not part of queries. Resist the temptation to add them to the database. Instead, use common table expressions, subqueries, or views as much as possible. While there might be less code reuse, these allow for more set-based operations and will almost always perform better than their UDF counterparts.
If there is no way around using UDFs, then make sure you know how to find the slow ones so they can be tuned.
Next Steps
- Tune Queries Using STATS IO and Plans
- Tune Queries Using Plans and Missing Indexes
- How to Use Live Query Stats

Eric has been a SQL Server DBA and Architect in the legal, software, transportation, and insurance industries for over 10 years. Currently he is the Sr Data Architect for Squire Patton Boggs, a leading provider of legal services with 47 offices in 20 countries.
Eric is a 2018-2019 Idera Ace and has co-authored 2 Idera Whitepapers.
He has been a presenter at PASS Summit, IT/DevConnections, SQLSaturdays, the in.sight transportation conference, and the Ohio North SQL Server User’s Group.
- MSSQLTips Awards: Author of the Year Contender – 2021, 2022 | Trendsetter (25+ tips) – 2021


