Problem
In this tip, we will go through the steps to change a Power BI report data source from a Multidimensional SSAS cube to the Tabular model and how this can be done with minimal impact.
Solution
We have a Power BI report with a table from a Multidimensional cube with an import mode connection as one of its sources. A few measures were created on this imported table and used in the report. The Multidimensional cube was recreated using the SSAS Tabular model instead. The need is to reconfigure the Power BI reports to read from the SSAS Tabular model.
Anyone who hears this task will instantly think they must rebuild everything and go through each report chart to read from the new source. However, thankfully by doing a few steps in the Power BI editor (Power Query) and checking a few things on a checklist, you can easily change the report source from Multidimensional to Tabular.
Here are a few things to note:
- Using an import mode connection with the SSAS Cube database will generate fields based on checked dimensions and measures and create one table (dataset) on the desktop. All used fact tables and their relationship in the cube will not be imported.
- In Power BI, the names of the columns of the checked dimensions will include the dimension name as follows: DimensionName.ColumnName
- The recreated SSAS Tabular model has identical tables names and measures to the Multidimensional cube; if not, a few transformation steps must be applied.
So now comes the fun part. We are going to use the powerful and mighty Power BI (Power Query) editor, which Microsoft defines as a:
"Data transformation and data preparation engine. Power Query comes with a graphical interface for getting data from sources and a Power Query Editor for applying transformations." (Microsoft documentation)
If you are new to Power Query, check out this tip (Power Query Introduction) for more information.
Before I go through the solution step by step, I want to make a few correlations between the table (query) you see in the Power BI editor and the related table in the Power BI desktop used for all sorts of modeling operations. Those with a database background will like this:
- The table in Power BI Desktop is like a SQL Materialized View, physically pointing to the table (query) in the Power BI editor, which in simple terms, is like a SQL view. And each transformation step we apply is like writing multiple With Statements; each With Statement depends on the previous one that does transformations, column renaming, and many other things that were applied.
- As we said, the table (query) in the Power BI editor is like a view which is a logical layer that we can edit the code using the Advanced Editor while considering that the logical structure of the columns (datatype and length) should not be changed, so we don’t affect the table in Power BI Desktop (SQL Materialized View). This point is the core of our solution.
For more info on SQL Materialized Views and Views, check out these links:
- Differences between Views and Materialized Views in SQL
- SQL VIEW Comparison in SQL Server, Oracle and PostgreSQL
For more information about Power Query Advanced Editor, see this Microsoft link: Power Query Advanced Editor
Overview of the Power BI Report
For this tip, I created the following:
- A Multidimensional cube using Visual Studio 2019 with AdventureWorksDW2019 database as a source. To download the database .bak, use this link: AdventureWorks sample databases.
- A Tabular model using Visual Studio 2019 with AdventureWorksDW2019 database as a source. To download the database .bak, use this link: AdventureWorks sample databases.
- Power BI report that fetches data from a Multidimensional cube with an import mode connection.
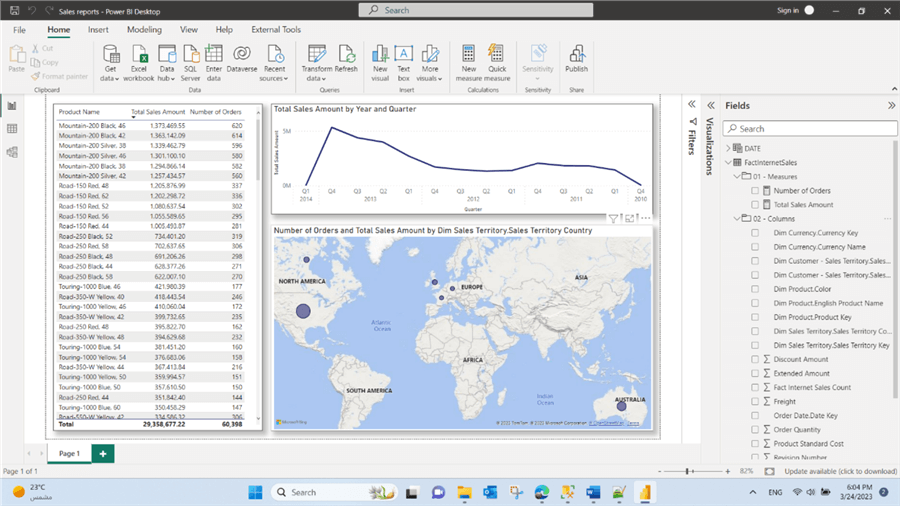
- Copy of the Power BI report. Golden rule: Always take a copy of the solution for backup. You never know what will happen.
Power BI Report change source from Multidimensional Cube to Tabular Model
Step 1
Open the Power BI solution, then create a new connection to the deployed Tabular model.
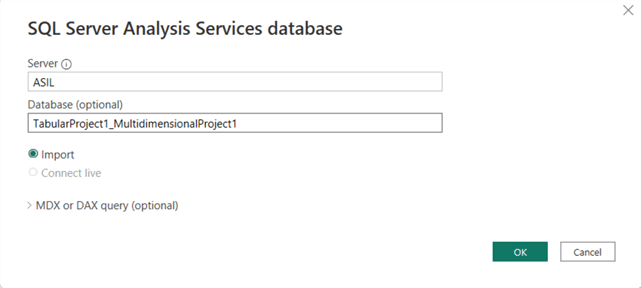
Step 2
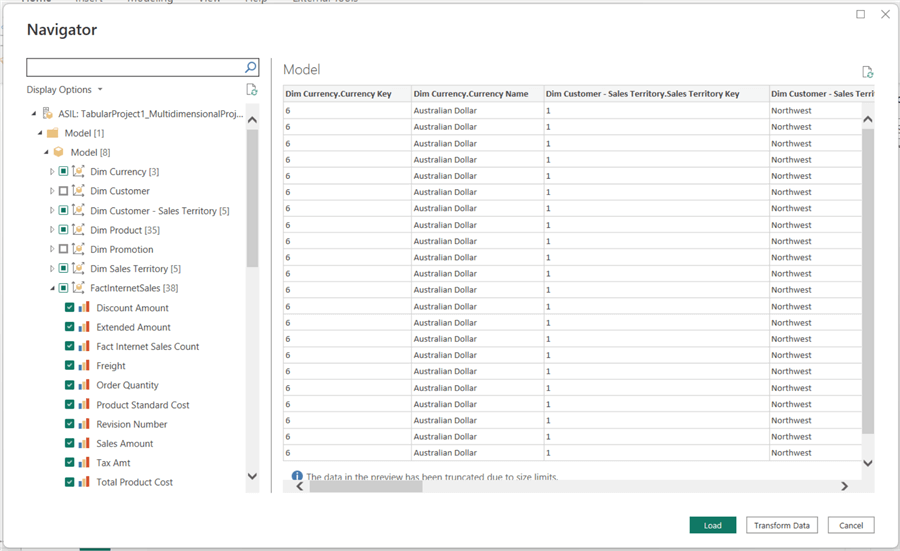
Select at least the same columns and measures that were used previously to create the table that reads from the Multidimensional cube, then click the Transform button to open the Power BI editor.
Step 3
A table (Query) named Model will be created. Ensure that all the columns are the same on the new replica (data types, names) and that all the needed and used columns exist. If data types and names differ, match the original by creating a few transformation steps.
Step 4
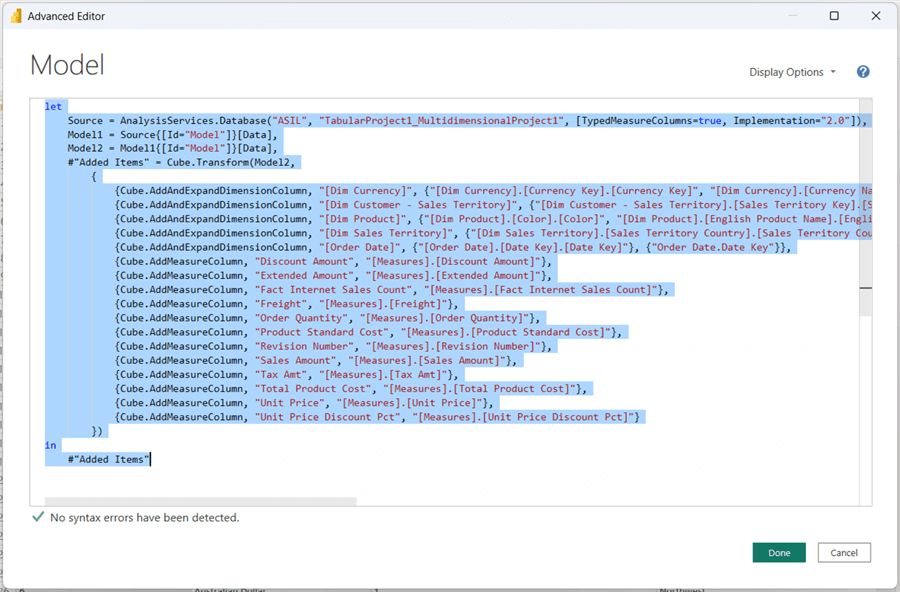
Right-click the new table (Query) and choose the Advanced Editor option.

Step 5
Copy the entire code from the Advanced Editor window.
Step 6
Right-click on the table (Query) that reads the data from the Multidimensional cube called FactInternetSales in my example, then choose the Advanced Editor option.
Step 7
Paste the copied code from Step 5 and then click Done.
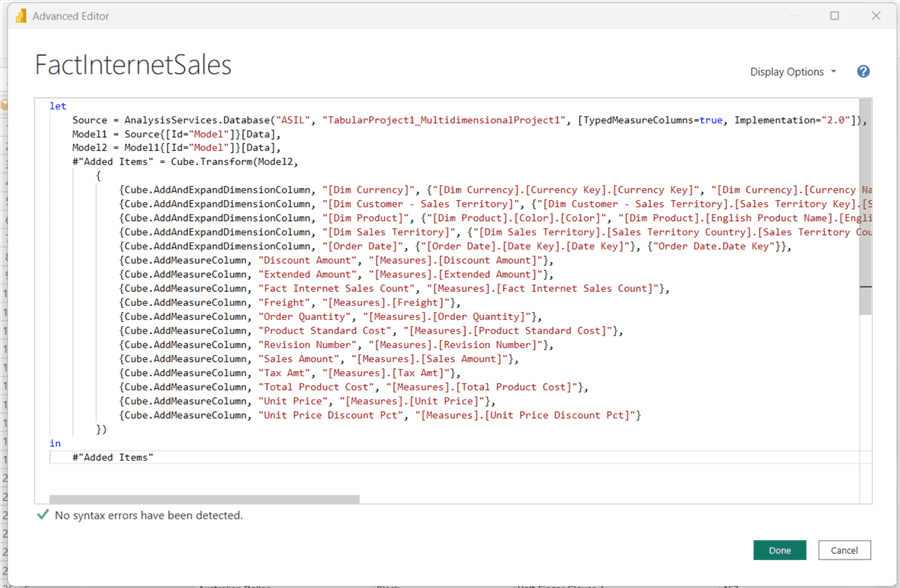
Step 8
Delete the new table (Query) named Model.
Step 9
Apply the changes and close the Power BI editor. That’s it.
Step 10
We should check up on a few things:
- Relationships built on different named columns or data types will be deleted, and you must rebuild those relationships.
- Data type formatting or conversions using the Power BI model (Data tab) may need to be reformatted and re-converted.
In conclusion, any previously created measures on the Power BI model will not be affected or deleted; hence no extra effort is needed to recreate the measures on a new table, and no need to go through all the report charts to reconfigure to fetch the data from a new source table.
Next Steps
- Check out these other Power BI articles.

Aseel AL-Laham is a Business Intelligence Specialist at Jordan Payments & Clearing Company (JOPACC) with over eight years of experience in the Business Intelligence field. She started as a Quality Assurance engineer for BI & Databases, which opened the path to becoming a Business Intelligence Specialist with a QA soul.
She holds a Bachelor of Engineering degree in Computer and Software Systems. And she is a Microsoft Certified Solutions Associate: SQL 2016 BI Development.
She has a strong analytical mind with problem-solving abilities. Data excites, inspires & amazes her. Discovering patterns in large volumes of information makes her want to roll up her sleeves and start digging. And she loves to write complex SQL queries; in a nutshell, she will always try to write one Query equivalent to the whole ETL process (if she can).
Her work revolves around the following:
- Designing Dimensional modeling from requirements to support data warehousing informational needs.
- Implemented several DAX functions for various fact calculations for efficient data visualization in Power BI.
- Designed and developed a variety of reports and dashboards using SSRS and Excel/Pivot Chart, and Power BI.
- Perform thorough unit testing on all relevant platforms to ensure proper implementation.
- Creating and optimizing objects in the database, e.g., Tables, Stored Procedures, Views, Indexes, User-defined Functions, and Triggers as required (Oracle/SQL Server).
- Designing and developing packages for ETL using various ETL tools such as SSIS.
Aseel believes that Dimensional modeling-architecting is the primary biller for a successful Business Intelligence project. As the data landscape becomes more massive and complex and the need to harness data wealth effectively is rising, dimensional modeling will continue to serve as a practical and effective approach to accessing and utilizing data to gain insights. Aseel is an Inmon kind of gal with a few Kimball tricks.
Through Aseel’s work experience, she developed expertise using the following tools:
- Analysis Services (SSAS Tabular & Multidimensional); skilled in writing DAX queries.
- Data Visualization (Power BI, Tableau).
- Reporting Services (SSRS).
- Integration Services (SSIS).
When she is not at work, Aseel is an avid walker and beginner hiker and loves spending time gardening