Problem
Microsoft Power BI Desktop provides a wide variety of custom visuals. When making dashboards, we often want to slice and filter the data at runtime. Although the in-built slicers have simplistic use cases, Power BI also provides a full range of custom visualizations. Therefore, when we want to create interactive slicers which contain images, text, and extensive formatting features, a Chiclet Slicer can be used instead of simple slicers with limited options. This article will explain how to create a Chiclet Slicer in Power BI.
Solution
As quintillion bytes of data flood our digital systems daily, data visualization software like Power BI helps us derive compelling stories and understand the underlying patterns in the informational statistics to make sense of it all. One key aspect of Power BI is its strength lies in the flexibility of data visualization where you can juggle hundreds of different custom visuals and choose the one that best fits your needs. Often, one may need a user-friendly way to dynamically control and alter the data displayed in dashboards to create different subsets of data. Although the native slicer in Power BI does the job, we can achieve a far more streamlined experience using the custom Chiclet Slicer.
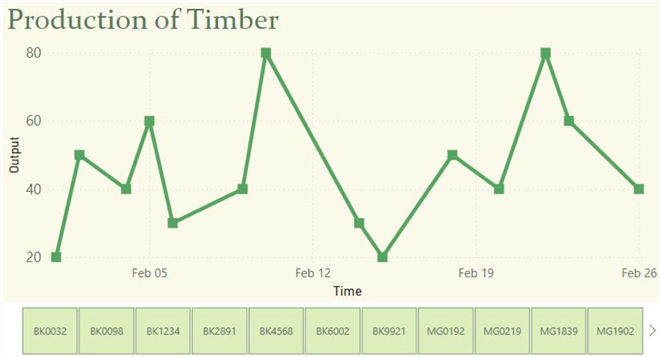
Consider the simple illustration above. Although one can view the total production of timber over the month of February in the displayed line chart, we can also slice and partition our dataset to view the production in terms of different types of wood, which are shown in the blocks of varying product IDs below the line graph. These categories together constitute the total production trend.
Now that we understand a typical use case of a Chiclet Slicer, it’s time to look at its components:
- Data Categories: The slicer will comprise different data categories, which can be used as buttons to filter data accordingly. The data tiles can be displayed as a row, a column, or a grid, depending on whichever style fits well in the reports. An appropriate category label and individual selection controls accompany each tile. Power BI also enables the selection of multiple categories, and a selection indicator is enabled to differentiate the selected tiles from the rest. As an example, in the above image, our data are timber with their IDs such as BK0032, BK0098, and so on.
- Search: Since the data categories may be numerous, Power BI also offers a search functionality to enable quick selection.
- Styling: A distinguishing feature of a Chiclet Slicer is that we can alter the appearance of our tiles and even incorporate relevant data category images instead of a simple text label in our tiles.
At this point, it is important to ask a question: Since both filtering and slicing refine data in Power BI, are they similar functionally? Although we are already familiar with the concept of slicing in Power BI, filtering, on the other hand, refers to setting specific conditions to limit the data displayed in visualizations with more granular control over data display through complex filtering rules based on multiple conditions, ranges, or expressions. It is typically employed by developers before the dashboards are provided to consumers.
Thus, the key takeaway is that a Chiclet Slicer is a great tool when one wants to:
- Encourage data exploration and segmentation interactively. Comparison of different data subsets helps to uncover patterns, trends, and outliers.
- Display commonly used filters.
- Eliminate or hide unnecessary data.
- Create focused and interactive dashboards by putting slicers next to important visuals.
Creating a Schema in MySQL
Now that we understand the basics and the need for a slicer, it’s time for a more practical demonstration. For that, we will analyze the sales data of a global textile business for the initial ten days of February 2022 by partitioning our data using the Chiclet Slicer regarding the country and type of product purchased. Our first step involves the creation of our sales fact table and the relevant dimension tables using MySQL.
First, create and access the database using the following commands:
CREATE DATABASE textile_sales;
USE textile_sales;
Now, we can create our tables in our database. Our database schema will consist of a central fact table showing the information related to the daily textile sales, including the revenue, product ID, and the region ID where the item was purchased. We will then also have two dimension tables of products and regions. To get started, we will create our three tables using the following commands:
CREATE TABLE fact_sales
(
   purchase_date date,
   sales int unsigned,
   product_id varchar(4),
   region_id varchar(3)
);

CREATE TABLE product_category
(
   product_id varchar(4),
   type_name varchar(10),
   color varchar(10)
);

CREATE TABLE location
(
   region_id varchar(3),
region_name varchar(20)
);
Now, we can populate our tables using the "INSERT" command as shown:
INSERT INTO fact_sales VALUES
("2023-02-01", 200, "00A1", "CHN"),
("2023-02-01", 200, "00A1", "CHN"),
("2023-02-01", 650, "00C0", "AUS"),
("2023-02-01", 340, "00B3", "JAP"),
("2023-02-02", 200, "00A1", "JAP"),
("2023-02-02", 340, "00B2", "CHN"),
("2023-02-03", 340, "00B2", "PAK"),
("2023-02-03", 220, "00A0", "RUS"),
("2023-02-03", 300, "00A2", "AUS"),
("2023-02-03", 200, "00A1", "AUS"),
("2023-02-04", 650, "00C0", "JAP"),
("2023-02-04", 340, "00B3", "CHN"),
("2023-02-04", 200, "00A1", "IND"),
("2023-02-04", 220, "00A0", "CHN"),
("2023-02-05", 340, "00B2", "PAK"),
("2023-02-06", 700, "00C1", "JAP"),
("2023-02-07", 200, "00A1", "RUS"),
("2023-02-07", 700, "00C1", "PAK"),
("2023-02-07", 300, "00A2", "PAK"),
("2023-02-07", 220, "00A0", "CHN"),
("2023-02-07", 220, "00A0", "IND"),
("2023-02-07", 340, "00B2", "AUS"),
("2023-02-08", 700, "00C1", "RUS"),
("2023-02-08", 340, "00B3", "CHN"),
("2023-02-08", 200, "00A1", "JAP"),
("2023-02-09", 220, "00A0", "JAP"),
("2023-02-09", 650, "00C0", "PAK"),
("2023-02-09", 340, "00B2", "IND"),
("2023-02-10", 340, "00B3", "RUS"),
("2023-02-10", 700, "00C1", "CHN"),
("2023-02-10", 220, "00A0", "CHN");

INSERT INTO product_category VALUES
("00A0", "BOTTOMS", "black"),
("00A1", "BOTTOMS", "white"),
("00A2", "BOTTOMS", "blue"),
("00B2", "TOP", "blue"),
("00B3", "TOP", "red"),
("00C1", "Accessory", "gold"),
("00C0", "Accessory", "silver");

INSERT INTO location VALUES
("AUS", "australia"),
("JAP", "japan"),
("PAK", "pakistan"),
("RUS", "russia"),
("IND", "india"),
("CHN", "china");
Lastly, we can view our created tables using the "SELECT" command as shown below:
SELECT * FROM textile_sales.fact_sales;
Executing this statement will output the initial rows of our sales table, as shown below:

SELECT * FROM textile_sales.product_category;

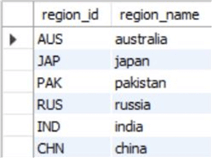
SELECT * FROM textile_sales.location;
Creating a Visualization in Power BI
Having created our database schema, we can import it to Power BI and use the custom Chiclet Slicer.
Step 1
We will start by importing our dataset to Power BI. To do so, in the "Home" ribbon of the main interface of Power BI, click the "Get data" option in the "Data" section, and then click on "More…" as shown below. We can observe the range of data sources that Power BI allows its users to use.

Step 2
The "Get Data" window will appear. Since we initially worked with a MySQL database, click "Database" below the search box and select the "MySQL database" option, as shown below. Then click "Connect" at the bottom of the window.

Step 3
The "MySQL database" window will appear, as shown below. Enter the relevant server and database credentials and click "OK."

Step 4
If connecting with the database is successful, another window will appear. In this "Navigator" window, select all the tables below the "Display Options" list and click on "Transform Data." We are not directly loading our dataset; we need to add another column to our location dimension table.

Step 5
This new column will encode the URLs of the flags of the different countries in our location table. This step will highlight the flexibility of our Chiclet Slicer as the URLs will be used to load images of the corresponding data category tiles instead of just text labels. As shown below, the "Power Query Editor" window will open after our previous step. Below the "Queries [3]" section, select the location table and then click on "Add Column," as shown.

In the resulting "Add Column" ribbon, click on the "Custom Column" option, as shown below.

The "Custom Column" window will appear. To set up our country flag images, we will use a conditional DAX formula to create a new column comprising a flag image URL of corresponding countries. The code is shown below:
URL = if [region_id] = "AUS" then "https://cdn.pixabay.com/photo/2013/07/13/14/14/australia-162232_1280.png" else
if [region_id] = "JAP" then "https://cdn.pixabay.com/photo/2012/04/10/22/59/japan-26803_1280.png" else
if [region_id] = "PAK" then "https://cdn.pixabay.com/photo/2012/04/10/22/59/pakistan-26804_1280.png" else
if [region_id] = "RUS" then "https://cdn.pixabay.com/photo/2013/07/13/14/17/russia-162400_1280.png" else
if [region_id] = "IND" then "https://cdn.pixabay.com/photo/2012/04/10/23/03/india-26828_1280.png" else https://cdn.pixabay.com/photo/2017/05/12/09/07/china-2306580_1280.png
We can then click "OK," as shown below.

We will be redirected to the "Power Query Editor," where we can observe our new column.

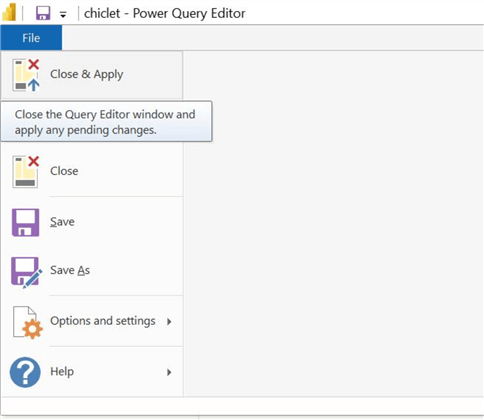
Now that our database schema is finalized, we can exit the query editor by clicking "File" and then the "Close & Apply" option.
To ensure that Power BI handles the images properly, once the data is adequately loaded, select the "URL" column in the "Data section." In the resulting "Column tools" ribbon, select the "Image URL" option from the drop-down list in the "Data category" field, as shown below.

Step 6
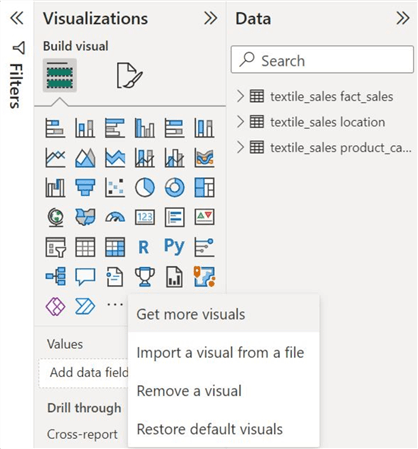
Since the Chiclet Slicer is not a native visual, we must import it from external sources. In the "Visualizations" section, click on "…" and then "Get more visuals," as demonstrated below.
The "Power BI Visuals" window will then open.

Type "chiclet slicer" in the search box and add the extension shown below.
Step 7
To start building and slicing our visualizations, we will opt for a simplistic line chart to partition with the Chiclet Slicer. As shown, select the line chart icon in the "Visualizations" panel, and from the "fact_sales" table, drag the "purchase_date" column to the x-axis field and the "sales" column to the y-axis field to build our line graph.

After some general and visual formatting, our textile company’s sales trend for the first few days of February is as follows:

Step 8
We will use the Chiclet Slicer to demarcate our sales data according to region or product category. As shown below, select the Chiclet Slicer icon.

Now, drag the "region_id" column to the "Category" field, the "sales" column to the "Values" field, and finally, our "URL" column to the "Image" field, as shown below.

As shown below, we can now observe our line chart and slicer in unison. Most importantly, our data categories in the slicer are now marked with appropriate flag images.

Step 9
We will now repeat "Step 8" and create another Chiclet Slicer. This time, however, instead of creating a slicer for different regions, we will create one which partitions data based on the product category. To do so, replicate "Step 8" and drag "product_id" to the category field. We can now observe our two slicers, as shown below.

Customizations
Although our work may seem done and ready for analysis, we can still beautify our report and make it more practical. In the "Visualizations" panel, there are two main streams for editing in the "Format your visual" option.

Visual Formatting
Under this section, we will find numerous parameters to directly alter how the visual conveys the information. These options are shown below:

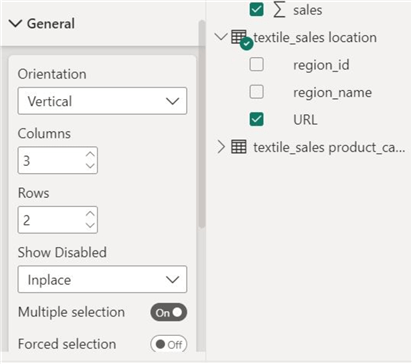
General. This option allows us to alter our slicer’s dimensions and order regarding the number of rows and columns.
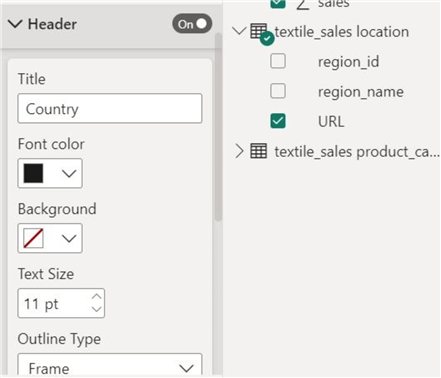
Header. This will allow us to change the heading of our slicer alongside its presentations.
Chiclets. This parameter enables us to change the dimensions and the size of the text labels in the data category tiles of our slicer.

General Formatting
Under this formatting stream, we can edit the attributes of our chart that are generally common to all the visuals. These attributes are shown below:
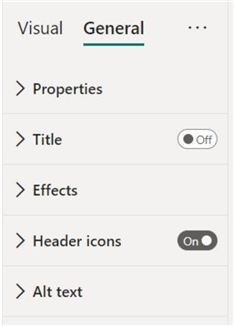
Properties. Here, we can alter the size, position, and padding of our visual.

Our finalized version of the visual is as follows:

Conduct Analysis with Report
Now that we have a well-formatted visual, we are finally ready to utilize the Chiclet Slicer to deeply inspect our sales data. Firstly, we will consider the slicer that partitions data by country. For instance, if we click on China, as shown below, a new sales trend will emerge in our line chart that depicts data solely based on purchases made in China. We can inspect each country to rank the daily highest sales score.

On the other hand, if we select a specific product in the "Product" Chiclet Slicer, our sales trend evolves once again. It now encodes the data about the sales of the particular item only over a period of time. It is also interesting to note how choosing the "00A0" product ID reduces the number of countries and the sample space in our other slicer. This indicates that this product did not make a sale in the missing countries.

In this article, we have discussed the basics of a slicer, its components, and its importance in the context of data visualization in Power BI. We expanded upon the concept by creating a star database schema in MySQL and analyzed it using the Chiclet Slicer in Power BI.
Next Steps
- Check out all the Power BI Tips on MSSQLTips.com.

Harris Amjad currently works as a Software Engineer at Strategic Systems International. He is Microsoft Certified Data Analyst and Microsoft Certified Trainer. A rigorous, task-driven Data Enthusiast with substantial experience in Data Science, Data Analysis, and Data Engineering.
- MSSQLTips Awards: Trendsetter (25+ tips) – 2024 | Author Contender – 2023, 2024 | Rookie Contender – 2022
