Problem
Microsoft Power BI Desktop provides users with various certified custom visuals. Sometimes one wants to highlight multiple key performance indicators, justifications, and supporting evidence; in that case, the Power KPI matrix provides all the support to fulfill the need. This visual has a wide variety of customizable options, making it easier to meet all the desired requirements. In this tip, we will use this custom visual and guide you through each step to maximize its usage.
Solution
For an organization to achieve its desired goals and implement an effective business strategy, measurement is an essential management tool, and a good senior management team understands their firm’s measurement system is strongly required for them to be up to date with the overall business performance. Businesses must assess their overall standing to deploy timely strategies in areas that need improvement and satisfy their stakeholders when analyzing factors like profit margins and market share. Typically, business performance is evaluated using Key Performance Indicators (KPIs), essentially a set of quantifiable measurements designed to gauge the overall long-term performance of a company.
A KPI demonstrates how well a company is performing in a specific area by comparing the actual value obtained from the company’s database with the desired target value set by management. This information can be condensed graphically, as shown below.

In the above illustrated KPI visual, we can see the following components:
- Actual Value: The actual value is encoded by the green sales trend, reaching the value of ‘400’.
- Target: The target set for the previous year’s sales was 350.
- KPI Index: This metric categorically encodes the relationship between the target and actual value. For example, if the actual value exceeds the target, the KPI index can be encoded as 1; otherwise, it can be set to 0.
- Status Indicator: Building upon the previous example, if our KPI index for a particular month’s sale is ‘1’, we can use a green symbol to indicate that the KPI exceeds targets, as shown above.
Although the above visual captures only a single KPI, we can use a KPI matrix to display unlimited business metrics in a single tabular form. As we will see later, a KPI matrix visual can group KPIs according to their category and display the current actual value, comparison value, KPI status, and the trend for all the required metrics in a formatted tabular list.
One widespread application of a KPI matrix, which we will also demonstrate in this tip, is the Balanced Score Card (BSC). Devised by the Harvard Business Review, BSC is a strategic management performance metric that gives managers a fast and comprehensive view of the business. This measure is different as it complements financial and non-financial measures, giving a bigger picture of a business’s standing. Often the traditional KPIs are solely focused on a business’s financial metrics, which communicates an incomplete and false view of organizational performance.

As illustrated above, BSC allows managers to look at the business from four critical perspectives:
- Finance: How do we look to the shareholders? This includes traditional financial measures such as profitability, revenue growth, and return on investment.
- Customer: How do customers see us? This perspective analyzes organizational performance from a customer’s point of view. It includes measures such as customer satisfaction, customer retention, and customer acquisition.
- Internal: What must we excel at? This perspective assesses what a company must do internally to meet customer and stakeholder expectations. Process efficiency, productivity, and cycle time that drive organizational performance are monitored.
- Learning & Growth: Can we continue to improve and create value? This perspective emphasizes the organization’s ability to learn, innovate, and develop its people and capabilities. Here, we can assess employee retention, training and development, and organizational culture.
Creating a Data Model in SQL Server
Now that we understand the fundamentals of KPIs and BSC, it is time for a more practical demonstration. We will create a schema using SQL Server to represent the yearly performance of a business entity in areas specific to dividends, net profit, customer engagement feedback score, active customer base, employee engagement feedback score, labor efficiency, and losses due to equipment failure. These metrics will later form our KPIs.
To start, we first need to create our database:
--MSSQLTips.com
CREATE DATABASE KPI;
USE KPI;
Now we will create individual tables for each KPI metric mentioned above. The tables will include a monthly date column, the actual value, and our target value for that specific area.
--MSSQLTips.com
CREATE TABLE dividends
(
    date Date,
    actual_value int,
    target int
);

--MSSQLTips.com
CREATE TABLE net_profit
(
    date Date,
    actual_value int,
    target int
);

--MSSQLTips.com
CREATE TABLE customer_engagement_feedback_score
(
    date Date,
    actual_value decimal(3, 1),
    target decimal(3, 1)
);

--MSSQLTips.com
CREATE TABLE active_customer_base
(
    date Date,
    actual_value int,
    target int
);

--MSSQLTips.com
CREATE TABLE employee_engagement_feedback_score
(
   date Date,
    actual_value decimal(3, 1),
    target decimal(3, 1)
);

--MSSQLTips.com
CREATE TABLE labor_efficiency
(
   date Date,
    actual_value int,
    target int
);

--MSSQLTips.com
CREATE TABLE losses_due_to_equipment_failure
(
    date Date,
    actual_value int,
    target int
);
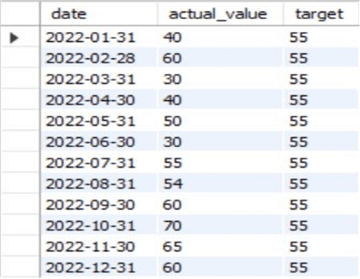
Now we can populate these tables.
--MSSQLTips.com
INSERT INTO dividends VALUES
('2022-01-31', 40, 55),
('2022-02-28', 60, 55),
('2022-03-31', 30, 55),
('2022-04-30', 40, 55),
('2022-05-31', 50, 55),
('2022-06-30', 30, 55),
('2022-07-31', 55, 55),
('2022-08-31', 54, 55),
('2022-09-30', 60, 55),
('2022-10-31', 70, 55),
('2022-11-30', 65, 55),
('2022-12-31', 60, 55);
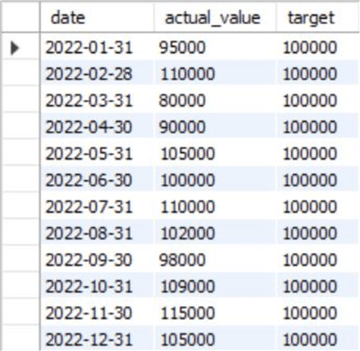
--MSSQLTips.com
INSERT INTO net_profit VALUES
('2022-01-31', 95000, 100000),
('2022-02-28', 110000, 100000),
('2022-03-31', 80000, 100000),
('2022-04-30', 90000, 100000),
('2022-05-31', 105000, 100000),
('2022-06-30', 100000, 100000),
('2022-07-31', 110000, 100000),
('2022-08-31', 102000, 100000),
('2022-09-30', 98000, 100000),
('2022-10-31', 109000, 100000),
('2022-11-30', 115000, 100000),
('2022-12-31', 105000, 100000);
--MSSQLTips.com
INSERT INTO customer_engagement_feedback_score VALUES
('2022-01-31', 7.0, 8.0),
('2022-02-28', 7.6, 8.0),
('2022-03-31', 7.8, 8.0),
('2022-04-30', 7.6, 8.0),
('2022-05-31', 7.9, 8.0),
('2022-06-30', 8.0, 8.0),
('2022-07-31', 8.1, 8.0),
('2022-08-31', 7.9, 8.0),
('2022-09-30', 8.2, 8.0),
('2022-10-31', 8.3, 8.0),
('2022-11-30', 8.4, 8.0),
('2022-12-31', 8.5, 8.0);
--MSSQLTips.com
INSERT INTO active_customer_base VALUES
('2022-01-31', 630, 600),
('2022-02-28', 620, 600),
('2022-03-31', 625, 600),
('2022-04-30', 635, 600),
('2022-05-31', 630, 600),
('2022-06-30', 635, 600),
('2022-07-31', 640, 600),
('2022-08-31', 645, 600),
('2022-09-30', 650, 600),
('2022-10-31', 645, 600),
('2022-11-30', 640, 600),
('2022-12-31', 635, 600);
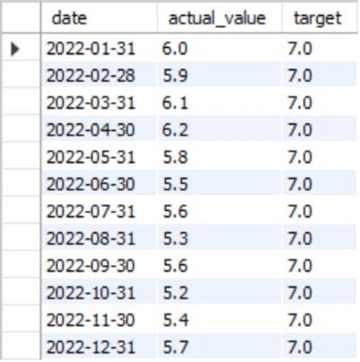
--MSSQLTips.com
INSERT INTO employee_engagement_feedback_score VALUES
('2022-01-31', 6.0, 7.0),
('2022-02-28', 5.9, 7.0),
('2022-03-31', 6.1, 7.0),
('2022-04-30', 6.2, 7.0),
('2022-05-31', 5.8, 7.0),
('2022-06-30', 5.5, 7.0),
('2022-07-31', 5.6, 7.0),
('2022-08-31', 5.3, 7.0),
('2022-09-30', 5.6, 7.0),
('2022-10-31', 5.2, 7.0),
('2022-11-30', 5.4, 7.0),
('2022-12-31', 5.7, 7.0);
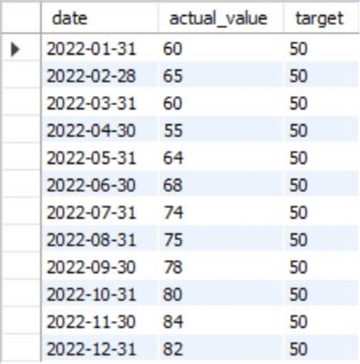
--MSSQLTips.com
INSERT INTO labor_efficiency VALUES
('2022-01-31', 60, 50),
('2022-02-28', 65, 50),
('2022-03-31', 60, 50),
('2022-04-30', 55, 50),
('2022-05-31', 64, 50),
('2022-06-30', 68, 50),
('2022-07-31', 74, 50),
('2022-08-31', 75, 50),
('2022-09-30', 78, 50),
('2022-10-31', 80, 50),
('2022-11-30', 84, 50),
('2022-12-31', 82, 50);
--MSSQLTips.com
INSERT INTO losses_due_to_equipment_failure VALUES
('2022-01-31', 1400, 1000),
('2022-02-28', 1600, 1000),
('2022-03-31', 800, 1000),
('2022-04-30', 600, 1000),
('2022-05-31', 1800, 1000),
('2022-06-30', 340, 1000),
('2022-07-31', 400, 1000),
('2022-08-31', 1200, 1000),
('2022-09-30', 300, 1000),
('2022-10-31', 500, 1000),
('2022-11-30', 570, 1000),
('2022-12-31', 1900, 1000);
To view the created tables, use the ‘SELECT’ statement, as shown below.
--MSSQLTips.com
SELECT * FROM kpi.dividends;
--MSSQLTips.com
SELECT * FROM kpi.net_profit;
--MSSQLTips.com
SELECT * FROM kpi.customer_engagement_feedback_score;

--MSSQLTips.com
SELECT * FROM kpi.active_customer_base;

--MSSQLTips.com
SELECT * FROM kpi.employee_engagement_feedback_score;
--MSSQLTips.com
SELECT * FROM kpi.labor_efficiency;
--MSSQLTips.com
SELECT * FROM kpi.losses_due_to_equipment_failure;

Now that we are done with our individual KPI tables, we must create a table that compiles all the KPIs. This will be useful later when developing our visualization in Power BI. This table will consist of a column of the relevant KPI type and its corresponding BCS category, alongside a threshold status for that KPI.
--MSSQLTips.com
CREATE TABLE KPI_definitions
(
    KPI_id int,
    KPI_type text,
    threshold text,
    category_id int,
    BSC_category text
);

--MSSQLTips.com
INSERT INTO KPI_definitions VALUES
('1', 'dividends', 'Above Is Good', 1, 'Finance'),
('2', 'net_profit', 'Above Is Good', 1, 'Finance'),
('3', 'customer_engagement_feedback_score', 'Above Is Good', 2, 'Customer'),
('4', 'active_customer_base', 'Above Is Good', 2, 'Customer'),
('5', 'employee_engagement_feedback_score', 'Above Is Good', 3, 'Learning & Growth'),
('6', 'labor_efficiency', 'Above Is Good', 4, 'Internal'),
('7', 'losses due to equipment failure', 'Below Is Good', 4, 'Internal');
We can view our table below.
--MSSQLTips.com
SELECT * FROM kpi.kpi_definitions;

Creating a Visualization in Power BI
With a rudimentary data model, we can import it into Power BI and create BSC using the Power KPI matrix.
Step 1
In the main interface of Power BI desktop, click “Get Data” in the “Home” ribbon and select the “SQL Server” option, as shown below. Power BI also offers a range of other sources from which you can import your dataset.

The “SQL Server database” window will open. Enter the relevant server and database credentials and click “OK,” as shown.

Step 2
If the connection with the database has been successful, the “Navigator” window will pop up. Select all the tables and click “Transform Data.” Power BI also allows us to preview our tables, as seen below.

Step 3
The “Power Query Editor” will open. Our goal is to consolidate the individual KPI tables previously created. Before we can append them, we need to introduce another column in our tables that mentions the KPI name for that table for each observation. This step will differentiate each row according to its relevant KPI in the final appended table.
Select any KPI table under the “Queries” tab, as shown below. Let’s start with the “dividends” table.

In the “Add Column” ribbon, select the “Custom Column” option, as shown below.

The “Custom Column” window will open. Enter the new column name and the KPI name in the syntax box, as shown below. Click “OK.”

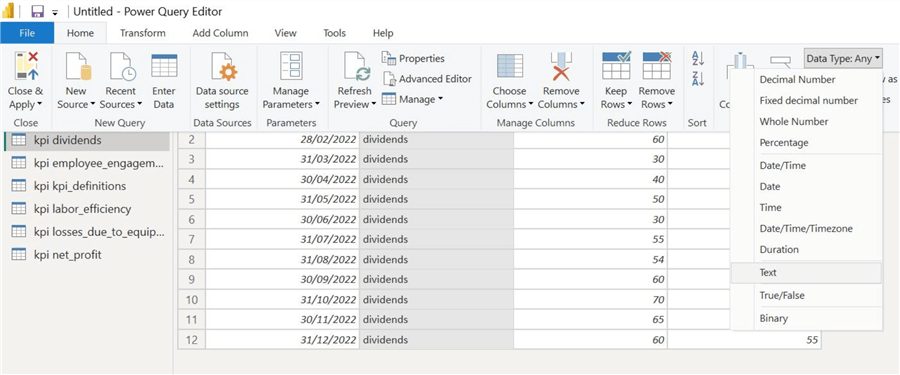
This will take you back to the “Power Query Editor,” where we can observe our newly appended column. To assign it a valid data type, in the “Home” ribbon, click the “Data Type” box shown below to the far right, and then select the “Text” option.
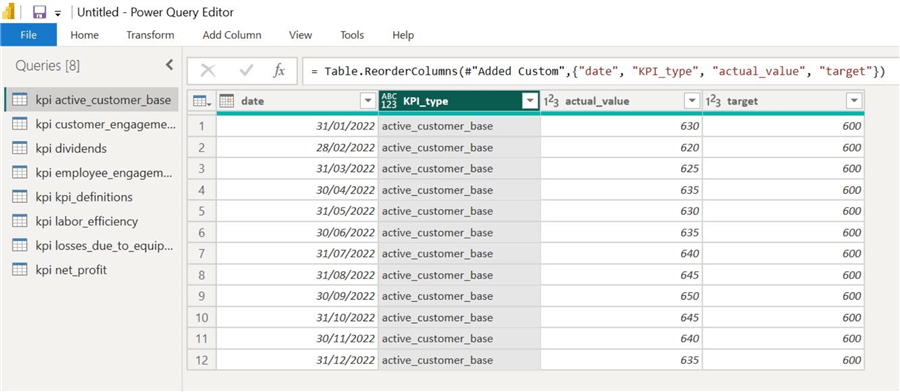
Repeat this step for all remaining KPI tables (excluding the KPI_definitions) to get the tables shown below:


Step 4
Now we are ready to append all our KPI tables into one table. In the “Home” ribbon, click “Append Queries” and then “Append Queries as New,” as shown below.

The “Append” window will open. Select the “Three or more tables” option, as shown below, click on the KPI table names one by one, and click the “Add >>” option. Click “OK.”

We will now be able to observe our new table. In the “Properties” tab, change the table’s name and ensure all the data types of each column are correct.

Step 5
Now that we are done with the data manipulation, we can exit the query editor. In the “File” ribbon, click “Close & Apply” as shown.

Step 6
Once redirected to the main interface, click the “Model view” tab, as shown below. We need to ensure that the relationships in our data models are correct.

Our current data model will be illustrated below. As we now have the “Score Card KPI,” which appends all of the individual KPI tables, we don’t need the redundant connections between the “KPI_definitions” table and the individual KPI tables from before.

Thus, we will be deleting those connections. Click on the connection line and select the “Delete” option. Repeat for all the redundant connections.

Our final data model should look something like this:

Step 7
Now we can revert to the main interface and create our KPI matrix visualization. In the “Visualization” tab, click “Get more visuals,” as Power BI does not natively offer the visual we need.

The “Power BI Visuals” window will open. In the search box, type “KPI matrix” and install the custom visual extension shown below.

Note: This visual is developed by Power BI; therefore, it is safe to use.

Step 8
Select the Power KPI Matrix icon, as shown below.

Before populating our visual, we must create a column representing the KPI index (discrete integer quantity to determine whether KPI is ‘good’). In the “Data” field, as shown below, right-click the “Score Card KPIs” table and click “New column.”

Insert the following DAX code in the given formula box. Using a ‘SWITCH’ statement, provide the KPI index a value of 1 if actual value is equal to or above the target or 2 otherwise.

Now, from the “Score Card KPIs” table, drag the “date” column to the “Date” field and “actual_value” to the “Actual Value” field, as shown below.

Our “target” column goes to the “Comparison Value” field, and the newly created “KPI Indicator Index” measure goes to the similarly named field as shown.

To display all the KPIs and their trends in the visual, we must put the “KPI_type” column in the “Row-based Metric Name” box as shown. To group these KPIs by their BSC category, we first put the “BSC_category” and then the “KPI_type” column in the “Category” field.

Lastly, we can also sort our KPIs in the visual using our KPI and category IDs, as shown below.

We now have a prototype of our KPI matrix. We can observe the four BSC perspectives and relevant KPIs in that category alongside their overall trends and compare the latest current and actual value of that KPI.

Customizations
Our visual, however, remains incomplete as there is a lot of formatting that we need to implement before we can analyze the business performance. Power BI allows formatting in two different streams, as shown below.

Visual Formatting
This option lets us alter our visual’s appearance and some underlying mechanics. As we see below, these custom visuals have numerous choices we can change. We will be discussing a select few of them.

Header. This allows us to alter the appearance of our column heading. We can change the background color, the text’s font, size, style, and alignment to make the visual more appealing.

Category. Similar to the function of the “Header” setting described above, we can do the same for all of the observations present below a specific column, which is the “Category” column in this case.

As of Date. Since the visual compares the latest data points in the matrix, and all of our data ends at the end of December, we can disable our date column.

KPI Indicator. For some of our KPIs, it wasn't always ideal for the actual value to exceed the target value. For instance, for losses due to equipment failure KPI, having the actual data below the target will be preferred. There we can change the KPI Indicator symbol accordingly here.

General Formatting
This setting allows us to change the standard features to all visuals, as shown below. Here we can change the title and the size of our visual.

We now have a finalized version of our BSC using the Power KPI matrix.

This is an interactive visual. We can click on any trend and analyze it in more detail, as shown below.

Since the visual compares the latest data in the matrix, we can interact and click on any required part of the line graph to get the percentage change relative to the target and the corresponding KPI indicator, as shown below.

Conduct Analysis
When it comes to evaluating this business’s standing with the information we have, we can observe that the trends are generally improving for the financial and customer metrics, as well as labor efficiency. However, the company can improve its profit margins if it caters to above-target losses due to equipment failure. Employee satisfaction is also an alarming factor.
In this tip, we have discussed the basics and need for KPIs. We further developed the concept by using Power KPI Matrix to construct a balanced scorecard report.
Next Steps
- Check out all the Power BI Tips on MSSQLTips.com

Harris Amjad currently works as a Software Engineer at Strategic Systems International. He is Microsoft Certified Data Analyst and Microsoft Certified Trainer. A rigorous, task-driven Data Enthusiast with substantial experience in Data Science, Data Analysis, and Data Engineering.
- MSSQLTips Awards: Trendsetter (25+ tips) – 2024 | Author Contender – 2023, 2024 | Rookie Contender – 2022
