Problem
In today’s world of data, information must be retrieved, processed, and visualized immediately with little or no delay. The reverse is the case as most business users have to rely on centrally controlled data sources created by IT teams which may take months for the IT team to provision such data sources fully. As a result, delayed business users create their data storage using spreadsheets, OneDrive, SharePoint site, and other resources. This usually results in a lack of control and supervision to guarantee that such data sources are supported and perform well.
Solution
Microsoft introduced Datamarts, a self-service platform to bridge the gap between business users and the IT department. The need to wait for the IT department for specific resources used by business users has been eliminated, making information readily available.
What are Power BI Datamarts?
Before diving into what Power BI Datamarts are and what it is all about, we must understand what Datamarts accomplish for firms.
Datamarts are a subset of a data warehouse designed to focus on a specific area in an organization, thereby saving time and providing business users more control. It is a self-service analytic solution that enables business users to store, explore, and load it into a fully managed database.
It provides a LowCode/NoCode experience for performing the complete ETL process (requires data ingestion from multiple sources, which can also be done using Dataflows), data transformation (is done using Power Query in a Datamarts environment), and lastly loading transformed data into an Azure SQL database (serves as a warehouse for all the data). Datamarts also allow users to define relationships and policies and create reports and dashboards. You can also perform query data in Datamarts using the T-SQL endpoint.

Datamarts Architecture
Components of Power BI Datamarts
The Power BI Datamarts comprise existing components packaged together to provide a LowCode/NoCode interface.
Dataflow: Power BI dataflows are cloud-based and allow for the construction and management of reusable data transformations to improve the efficiency and accuracy of Power BI reports and dashboards. (Understanding Dataflow)
Data Warehousing: A central store that combines data from various sources designed to support the decision-making process by using historical, present, and predictive views of corporate data. Azure SQL database is automatically created when setting up Datamarts, does not require any tuning or optimization, and would not cost extra.
Shared Power BI Datasets: This feature within Power BI allows multiple reports and dashboards to be used simultaneously. This feature fosters data governance and lessens redundancy by enabling collaboration and consistency across several reports.
Features of Power BI Datamarts
The Power BI Datamarts come with a variety of features, namely:
- Web Based: The Datamarts are part of the Power BI SaaS and fully managed on the web without requiring software installation.
- No-Code Required: Datamarts provide users with the NoCode experience where the creation of resources can be done using the user interface.
- SQL Query and Visualization: Provides users with the ability to query, analyze, and visualize data all in the same environment.
- Easy Integration: Native interface with Microsoft Office, Power BI, and other Microsoft analytics products.
- Security: RLS (Row Level Security) is supported by Datamarts, allowing you to manage who has access to which data. Read more on RLS.
When to Use Datamarts
Datamarts, being a self-service product, are more compact, specialized data warehouses designed to meet the analytical requirement of organization business users.
The list below shows the different scenarios when to use Datamarts:
Improve Performance: Power BI developers can construct complete solutions independently of other tools or IT teams. These are all done using Azure SQL DB to support visual experiences for data searching and ad-hoc analysis.
Departmental Analysis: Utilize a self-service, fully managed SQL database to centralize modest to moderate data quantities (about 100 GB) for departmental self-service.
Business Independence: Datamarts provide business units with an elevated level of autonomy in decentralized companies. Each business unit can manage and analyze its data separately using Datamarts, enabling them to customize its analytics and reporting to meet its unique needs. For instance, the sales department might need sales and revenue data, while the marketing department might need customer and campaign data. Each department can have its data models and analysis by creating distinct Datamarts.
Differences Between Power BI Datamarts and Dataflows
Reusable extract, transform, and load (ETL) are provided by dataflows. Power BI Dataflows and Datamarts can work together by using dataflows to load data into your Datamarts. When you wish to reuse your ETL logic, you use dataflows. Learn more about Power BI Dataflows.
| Features | Datamarts | Dataflows |
|---|---|---|
| Purpose | A data warehouse designed to meet the demands of a particular business division. | An extract, transform, and load (ETL) solution that may be reused. |
| Security | Makes use of Row Level Security (RLS). | Secured using Azure Active Directory (AD). |
| Storage | Data are being stored in Azure SQL Database. | Stored in a CDM folder Common Data Model. |
| Query Support | Supports import and direct query. | Support import only. |
| Integration with Power BI | Support Power BI features such as connections, auto-generated datasets, and DAX. | Support connections, DAX, and custom datasets. |
Getting Started with Power BI Datamarts
Datamarts, being self-service applications, aim to bridge the gap between business users and the IT department. For you to be able to use the Datamarts feature, you must first have the prerequisite.
Prerequisite of Power BI Datamarts
To follow along in this article, you need the following:
Power BI Knowledge: Basic knowledge of Power BI Desktop and Power BI Services.
Premium Workspace: Workspace functions as a container for our resources on Power BI service, such as dataset, report, dashboard, and dataflow. To use the Datamarts feature, you will either have a Premium per user or Premium per capacity License.
Create Power BI Datamart
The following steps are required to create a Datamart in Power BI.
Step 1: Create a Premium Per User Workspace
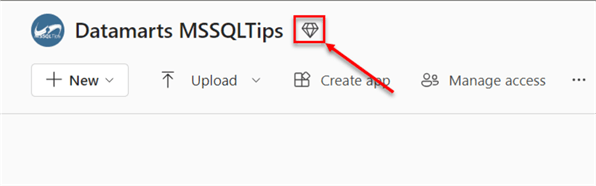
The workspace is a shared environment for a group of resources under a tenant. Function as a container for Power BI dashboards, reports, apps, workbooks, datasets, and dataflows. Check out our previous article on Power BI Workspaces. The diamond icon indicates it is a premium workspace.
Step 2: Create Datamart
In your created workspace, click the New icon and select Datamart (Preview) in the dropdown. This should open a new window.

In the new window, you must fill in the Datamart name, then click Create. This should take you to the Datamart environment, where we can perform the ETL process.

Possible Issues with Datamart. If you cannot find Datamart in your workspace, it might be because it needs to be activated in the admin portal.
To activate your Datamart, click on the setting (Gear Icon) and select Admin portal.
In your Admin portal, search for Datamart settings and enable Datamart.

Get Data Using Datamart
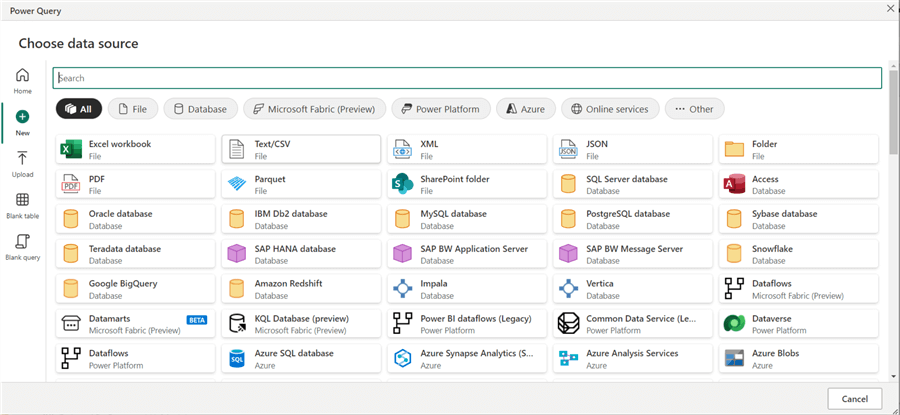
Datamart provides you with the option of getting data from multiple sources. For this article, we will be getting data from Microsoft Excel Online.
Start by clicking the Get data from another source.

In the new window, you will notice the similarity of Dataflows to get the data we did in our previous article.
Get Data from Excel Online
Microsoft Excel Online is a cloud-based version of the Microsoft Excel Desktop, allowing users to create, edit, and collaborate with others on the web. By default, when working with Excel Online, it automatically saves in your OneDrive or SharePoint, depending on the file location.
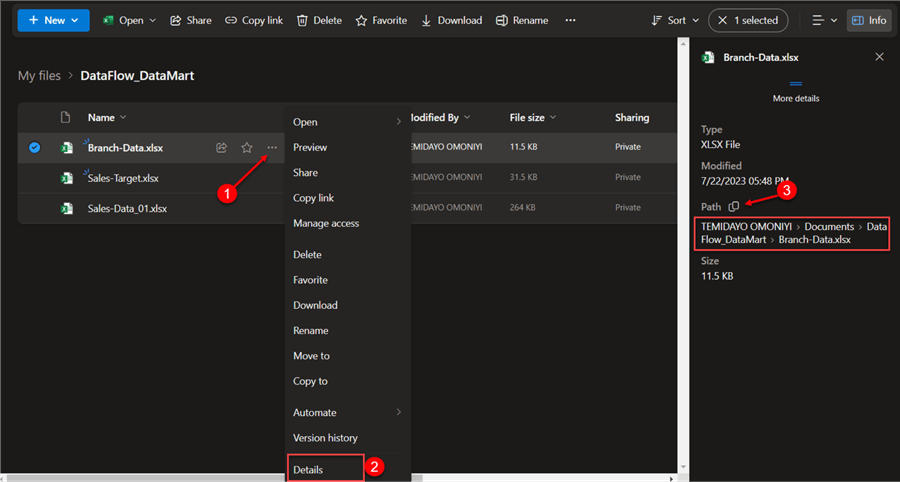
Step 1: Get the File API Link
To get the file URL link, navigate to your OneDrive, where the Excel Online files are located. Click the three dots and select Details. This will open a pane on the right side of the window. Copy the file path and navigate back to your Power BI Datamart.
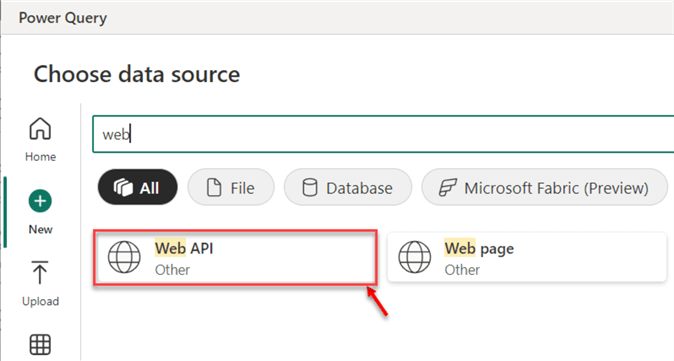
Step 2: Connect to Excel Online
In your Datamart Get Data environment, search for web API; this should take you to another window.
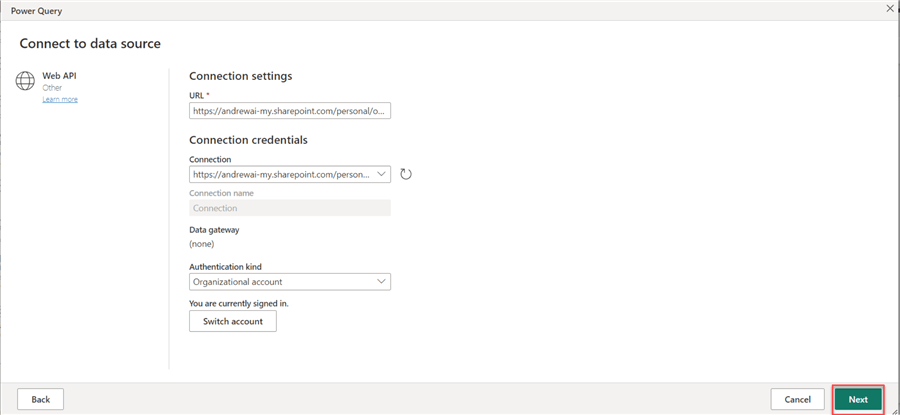
Step 3: Connection Settings
In the new window, fill in the following credentials. For Authentication Kind, we will be using the Organizational Account.
Step 4: Get Other Data
In the Power Query Editor, click Get Data to load other data into the Editor.
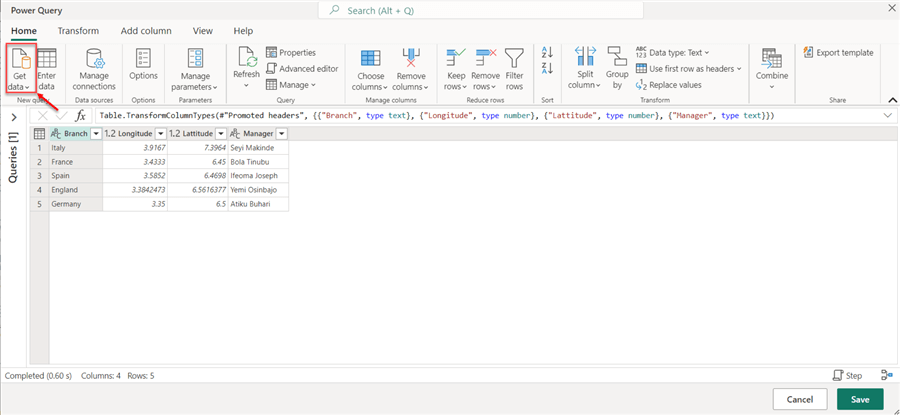
Now that you have loaded all the necessary data, you can perform all data transformations in the Power Query Editor to structure your data to the desired format.
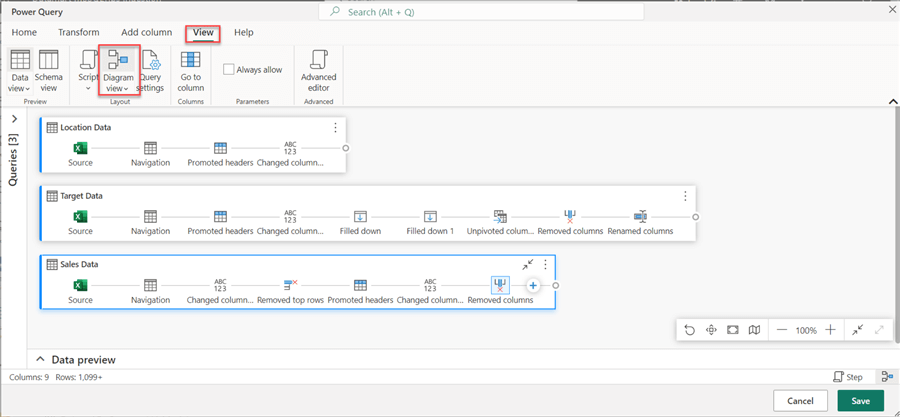
Diagram View. You may use the diagram view option to see the relationships between your dataflow’s various tables and columns. This might help you comprehend the layout of your data and manage any potential problems. Note: The entire data-wrangling process is made simpler by the diagram perspective.
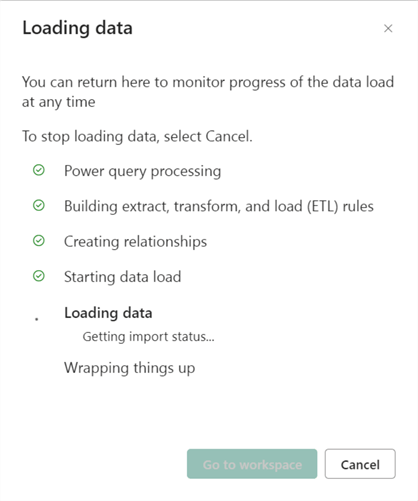
Step 5: Save and Load
After completing all the necessary transformations, load the data as a table back into the Datamart editor and Azure SQL Database.
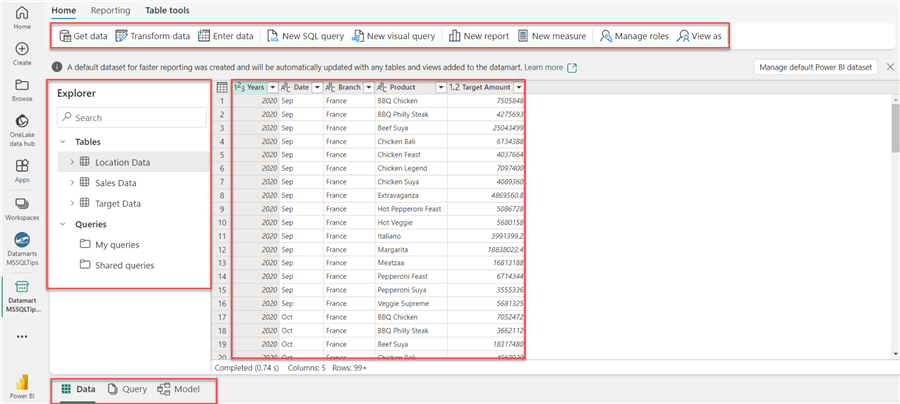
Exploring Datamart Interface
The Datamart editor has three major views like the Power BI Desktop: Data, Query, and Model.
Data View
All data in Datamart is displayed in a grid format in the Data view. The Data view lets you manage your tables and views, run new queries, and examine the data in your Datamart.
Incremental Refresh. Incremental refresh in Power BI Datamart allows the user to refresh data incrementally instead of doing a full data refresh every time. This can reduce the amount of data that needs to be sent between Power BI and the data source and significantly speed up data refresh.
To perform an incremental refresh in Datamart, you need to follow the step listed below:
Step 1: Select Table. Firstly, select the table where we want to base our incremental refresh.

Step 2: Incremental Refresh Configuration. Note: Incremental refresh works for the date and time fields. In your incremental settings, check “Use Incremental refresh on the table Sales Data“.
You are expected to fill in the Storage period and Refresh period, then click Save.

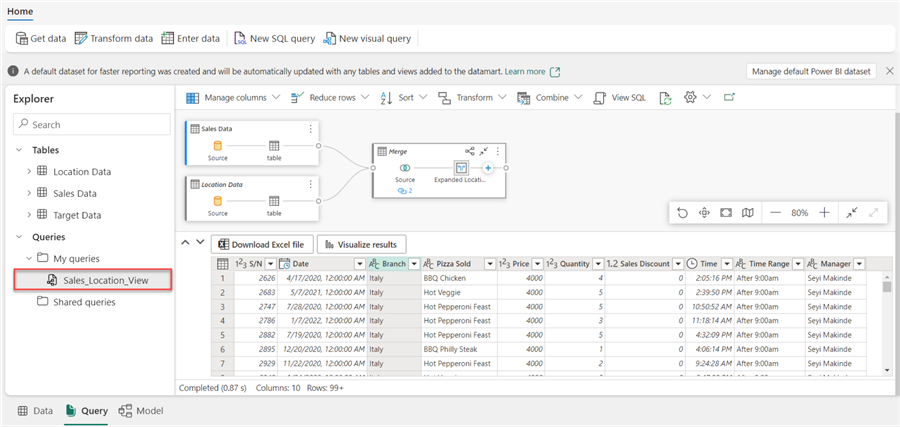
Query View
This has a visual query editor to build queries on your Datamart. It eliminates the need to write complex queries to find information.
Visual Query. The Visual query is similar to that of the Power Query Editor. Still, while using the Visual/New Query in the Azure SQL Database, this will be created as a VIEW behind the scenes.
The following steps should be followed in creating a Visual/New Query:
Step 1: Select Tables. Select the two tables you want to perform your query upon. For this exercise, we will use Sales Data and Location Data.

Step 2: Activity. Perform a merge action between the Sale and Location data. This is the same as JOIN in SQL queries.
In your Sales Data Visual table, click on the + icon and select Merge queries as new; this will open another window.

Select the columns you want to base your merge in the new window. Then select the type of join you want to use. For this article, we will use the Inner Join, which takes what is common in both tables.

Now you can see the preview of the view we just created. You can also rename the visual query by clicking on the three-dot and selecting rename.
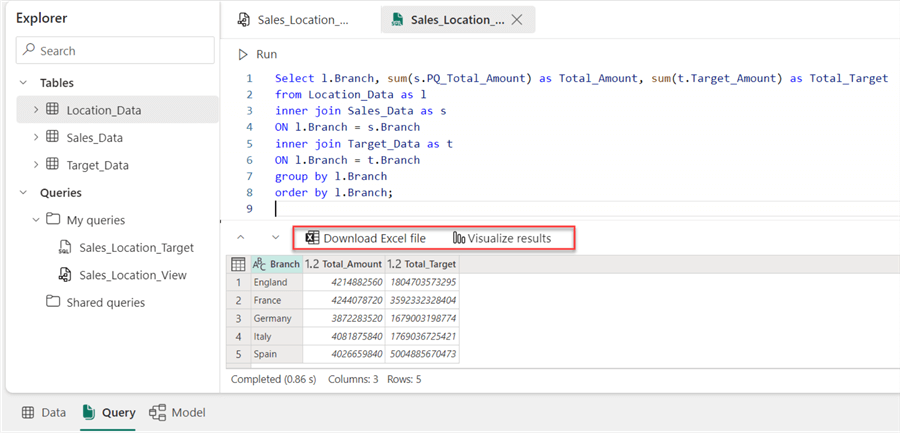
SQL Query. Datamarts support the writing of T-SQL queries in retrieving and manipulating data due to the fact that data is stored in Datamart in Azure SQL Database, which supports the structural database.
The SQL Query provides two options: download the query in Excel or visualize the result in Power BI Online.
Model/Relationship View
Datamart Model view allows users to define relationships between multiple tables and create calculated measures. It provides users with the same experience as that of Power BI Desktop.

Calculated Measures. Datamart allows users to write DAX expressions in the Datamart editor. It is coupled with IntelliSense, which helps users write better DAX formulas.

Row Level Security (RLS). Datamart also allows users to set security using the RLS feature. By limiting access to a database row, row-level security (RLS) gives users access to information they have been given authorization. Read our previous article to understand RLS in Power BI better.
The following steps can be used in setting up the RLS in Datamart:
Step 1: Manage Roles. In your Model view, click Manage roles at the top right corner. This will open another window. In the new window, click New and select the table you want to base your restriction on.

Step 2: Assign Roles. Unlike the Power BI Desktop, assigning roles to different users can be done directly in Power BI Datamart, providing users with ease and flexibility using the feature.
Firstly, save the roles just created and click the Assign tab at the top left. Assigning roles is based on the user’s email address under the same company tenant.

Report Creation. Datamart also supports report creation. This can be done by clicking the Reporting tab and selecting New Report, taking you to a Power BI report environment.

In the reporting environment, create a simple report and click Save when you are done.

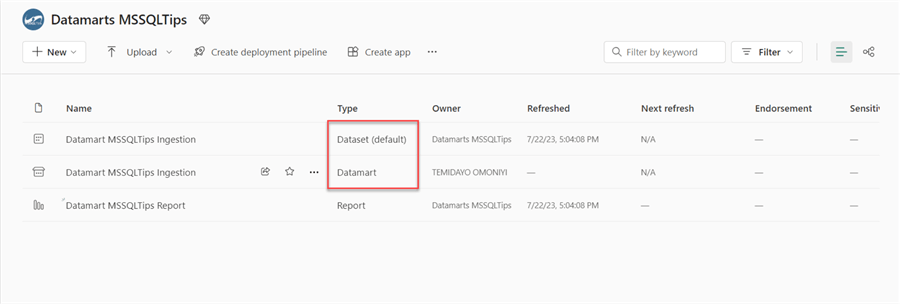
Connect Power BI Datamart to Platforms
Now that we are done creating the Datamart let’s head back to the Datamart workspace we created. In your workspace, two components are created automatically when working with Datamart: the Datamart and Dataset.
Connect Datamart to Power BI Desktop
To connect your Power BI desktop to Datamart, ensure you are signed in with the same account on the desktop as that of the Power BI Service.
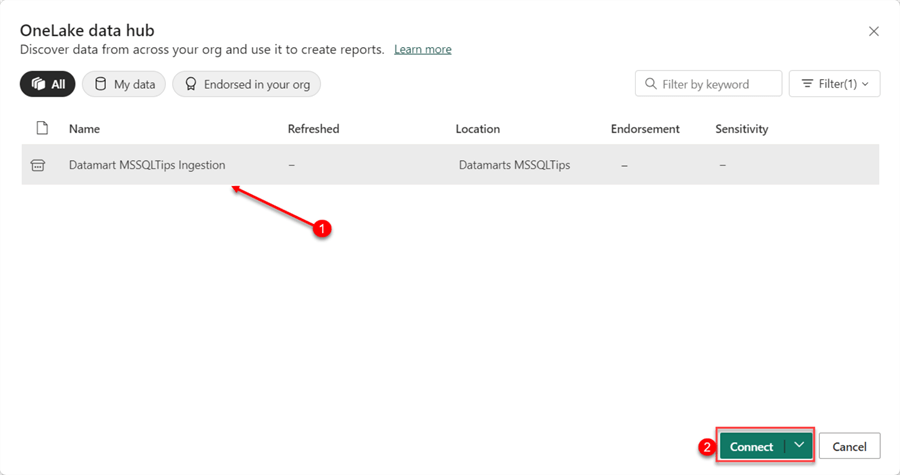
From your Power BI Desktop Home Tab, click the OneLake data hub and select either the Power BI datasets or Datamarts. Remember, Datamarts create both a dataset and Datamart when set in the workspace.

Select the Datamart you want to use and connect; this should load the entire table from your Datamart to Power BI Desktop. The same approach can also be done for Microsoft Excel. You will need to select the Power BI dataset (Power Platform).
Connect Datamart to Microsoft SSMS
The SSMS provides a unified platform for controlling all facets of SQL Server, including administration, development, security, and data.
The following steps are needed to connect Datamart to SSMS:
Step 1: Get the Connection String
In your Datamart workspace, click the three dots and select Settings. This will open another window for you.
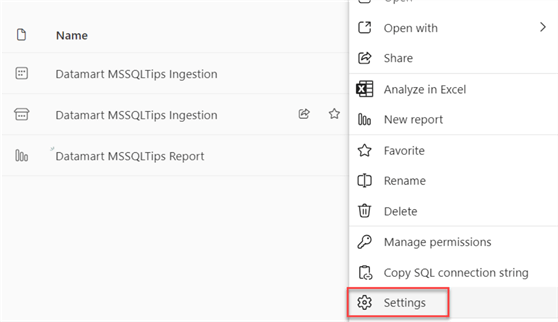
In the new window, expand the Server settings and copy the Connection string.

Step 2: Connect to the Server
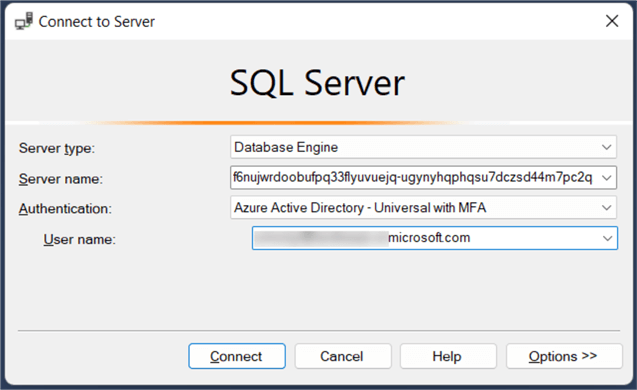
In your SSMS software, the following configuration is needed:
- Server Type: The server type is set at Database Engine.
- Server name: This is the connection string we copied from the step above.
- Authentication: Select the Azure Active Directory – Universal with MFA.
- Username: This should be the user account email used in the Power BI service.
After this, click Connect. If this is your first time, you may need to type in your password and login.
After successfully logging in, you can query the entire data in the Views table.

Conclusion
This article detailed many aspects of Power BI Datamart and when to use them. We also talked about the difference between Dataflows and Datamarts. In addition, you learned how to connect a Datamart to different data sources, perform the complete ETL progress in the Power Query Editor feature, create a report, and perform row-level security in Datamart.
To fully understand this article, I advise you to read our previous article: Dataflows in Power BI.
Next Steps
Check out related articles:

Temidayo Omoniyi is a Microsoft Certified Data Analyst, Microsoft Certified Trainer, Power Platform Developer, Azure Data Engineer, Content Creator, and Technical writer with over three years of experience.
Currently, he works as a data and business intelligence analyst for a training and consulting company in Lagos, Nigeria.
Temidayo enjoys creating educative content on YouTube, LinkedIn, Twitter, and other online platforms. He loves sharing his knowledge and writing about systems, applications, tools, and processes.
Apart from training, writing, and coding, you will find him watching and reading Anime. He is a big fan of DC Comics.
- MSSQLTips Awards: Trendsetter (25+ tips) – 2025 | Author of the Year – 2023, 2024


