Problem
In Microsoft Fabric, it seems you can create a so-called Lakehouse. I’m unfamiliar with this term and the capabilities or features such a lakehouse has. Why should I create it when using Fabric?
Solution
A data lakehouse is a data platform architecture that combines the best of two worlds:
- It uses a data lake for flexible, cheap, and near-limitless storage of data. In Microsoft Fabric, this is the OneLake storage layer.
- By using the delta table format, typical relational database features are added to the data lake (such as ACID transactions and the support of CRUD operations). This allows you to store and query the data as in a data warehouse.
The following diagram is from the official Microsoft documentation showing a possible architecture of a data lakehouse:

If you want to learn more about the concepts of lakehouses, check out the following tips:
- A Cloud Data Lakehouse Success Story – Part 1 and Part 2
- Storage and Serving Layers in the Data Lakehouse
- Designing a Data Lake Management and Security Strategy
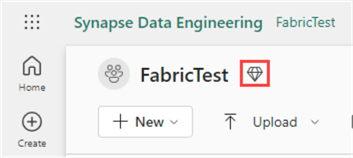
This tip will show how to create your first data lakehouse in Microsoft Fabric. You can use the free trial for Microsoft Fabric if you don’t have a subscription. Make sure you have a Fabric-enabled workspace (which you can recognize by the diamond after its name):
You can use the P SKUs (similar to Power BI Premium) or the Azure A SKUs. For more information about the latter, check out the tip What are Capacities in Microsoft Fabric?
Building Your First Lakehouse in Microsoft Fabric
Let’s ingest a CSV file with some sample data to get started. I’m using the following query in the AdventureWorks 2019 sample data warehouse to generate the data:
SELECT
     c.FirstName
    ,c.LastName
    ,c.Gender
    ,c.HouseOwnerFlag
    ,c.TotalChildren
    ,f.SalesOrderNumber
    ,f.SalesOrderLineNumber
    ,f.OrderQuantity
    ,f.UnitPrice
    ,f.DiscountAmount
    ,f.SalesAmount
    ,f.OrderDate
    ,f.DueDate
    ,f.ShipDate
FROM dbo.FactInternetSales f
JOIN dbo.DimCustomer c ON f.CustomerKey = c.CustomerKey;
If you don’t have access to the AdventureWorks database, you can download the sample file here. Log into the Power BI/Fabric service with your browser. As explained in the tip, What are Personas in Microsoft Fabric?, the data engineering persona is used to perform big-data analytics using either Spark notebooks or the SQL endpoint, and it’s the persona you’d typically use when working with lakehouses.
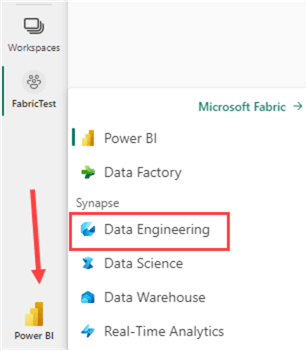
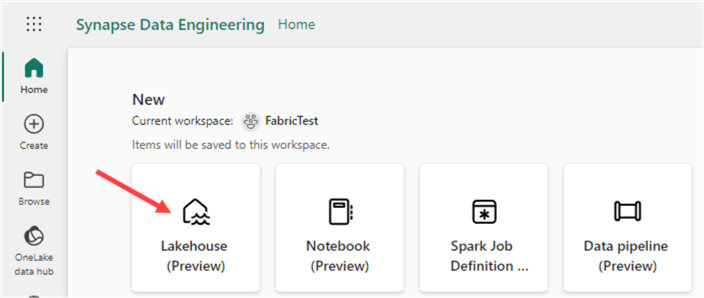
In the data engineering experience, create a new lakehouse:
You will be asked to provide a name:

The lakehouse itself will be created relatively quickly, but the SQL endpoint and a default dataset will take more time, as explained in the message.

On the left-hand side, you have the Lakehouse Explorer pane. This pane allows you to browse any uploaded files or a table you’ve created. The tables will also be files as well. They are stored as parquet files with the delta format in the data lake but displayed as regular tables in the explorer.
To upload a file, click the ellipsis next to the Files header and choose Upload > Upload files in the context menu.

Choose the sample file we created earlier and upload it to the lakehouse:
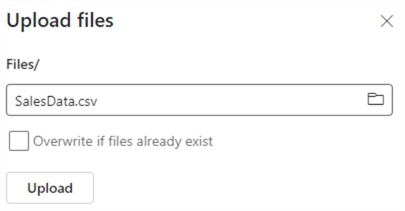
The SalesData file will be shown in Explorer after uploading it. You may need to refresh the Files folder to make it appear.

It is possible to create subfolders to organize your files more efficiently. Clicking on a file will show you a preview:

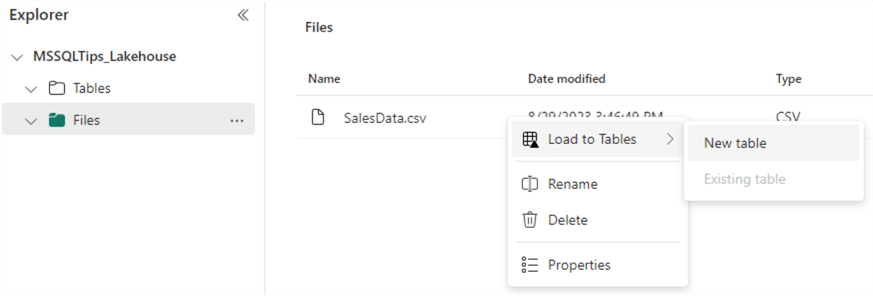
To query the data in the file, we need to load the data into a table. We can do this by clicking the ellipsis next to the file name and choosing Load to Tables > New table.
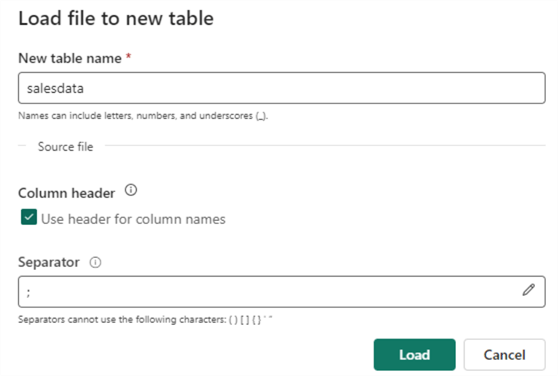
You will be asked to provide a table name. Don’t forget to change the separator to a semicolon.
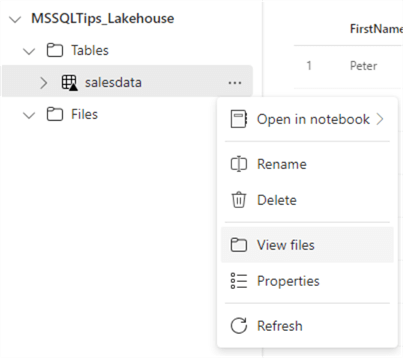
The new table will appear in the Explorer under the Tables section when the data is loaded. Clicking on the table will show you a preview of the data:

In the context menu of the table, you can select View files.
This will show you the underlying files of the table. You can see that the data is stored in a single parquet file. The _delta_log table stored the transaction information of the table.

The “snappy” in the file name indicates compression was used with the snappy algorithm. The final file size is about 7KB, which is 1/10th of the original file size.
Querying the Data in the Lakehouse with the SQL Endpoint
By now, the SQL endpoint should have been generated automatically. In the top right corner, you can switch to this endpoint by using the dropdown:

This opens a new explorer where you can see the “database” structure and a preview of the table:

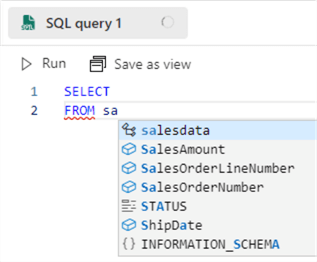
Click on New SQL query in the top bar to open the query editor. When you start typing, you can see intellisense and autocomplete are provided:
Enter the following query:
SELECT
     Gender
    ,TotalSales = SUM(CONVERT(NUMERIC(10,3),REPLACE(SalesAmount,',','.')))
FROM dbo.salesdata
GROUP BY Gender
ORDER BY TotalSales
Because of the locale settings used in the sample data and the locale used by the lakehouse, we need to replace the decimal separator from a comma to a point to be able to convert the sales amount from string to numeric. Running the query will give the following results (which can be exported to Excel):

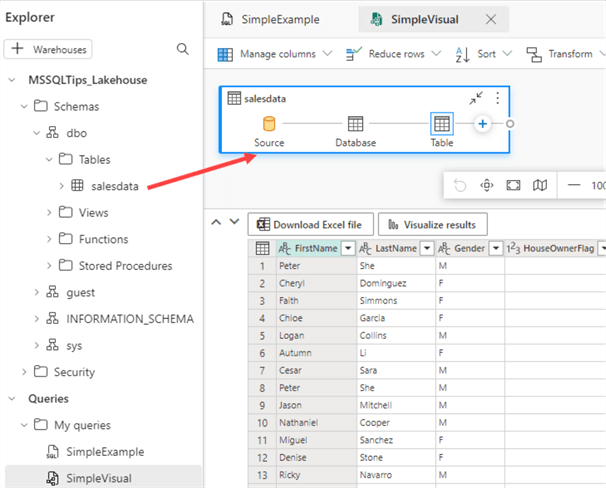
Keep in mind that we just queried data stored in files on a data lake using plain old T-SQL. However, having a lot of SQL knowledge to write queries is unnecessary, as the SQL endpoint also provides the feature to write visual queries. In the menu bar, click on New visual query. This will open another designer, which is very similar to Power Query. Drag the salesdata table on the canvas to get started.
Let’s recreate the same SQL query we previously typed out. First, click on Manage columns and then Choose columns.

Only keep the Gender and SalesAmount columns.

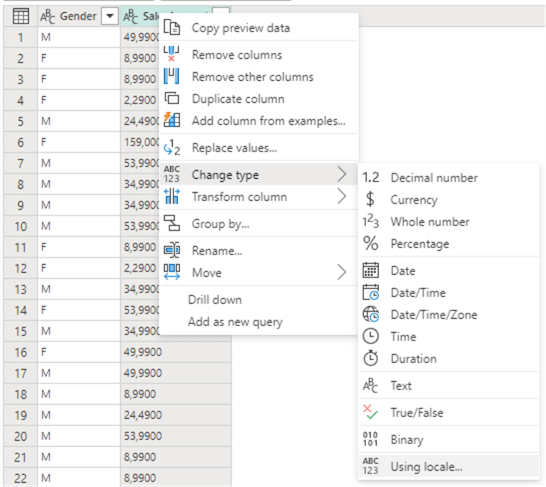
Now, we have to convert the SalesAmount to decimal values. Right-click on the SalesAmount column and go to Change type > Using locale…
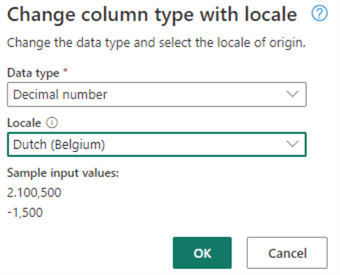
Choose Decimal number and the Dutch (Belgium) locale in the menu.
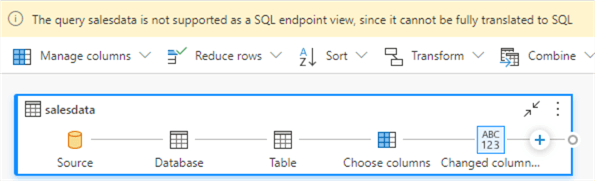
This will successfully convert the data, but we get a warning that this will result in a query that cannot be saved as a view since it cannot be fully translated to SQL. This is similar to a query in Power Query that cannot fold to a source.
Another option is to do just like we did in the T-SQL statement: replace the comma by a point and then do a normal conversion. However, we get the same warning that the query cannot fold. This is a bit weird since we can do it just fine when we write the T-SQL ourselves. Hopefully, this will be fixed in the future. A solution would be pre-processing the data so all columns are in the correct data type. This can be done in a notebook, for example (or in a SQL query like we did before), but this is out of scope for this tip.
Next, choose Transform > Group by.

Group on the gender column and aggregate the sales amount column:

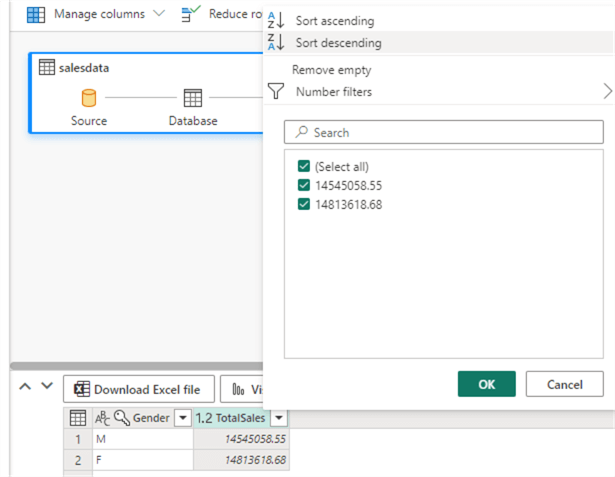
Finally, sort on the TotalSales column:
Creating a Report on the Lakehouse
Aside from a SQL endpoint, Fabric also creates a default dataset (which is a Power BI dataset). To view it, click on Model in the bottom left corner.
Currently, there’s only one table in the model, and its storage mode is DirectLake.

DirectLake means the data is stored in the OneLake data lake but can be queried directly by the Power BI dataset. This is similar to DirectQuery in Power BI, but Fabric promises better query performance.
To create a report, click on New report in the menu bar. The familiar report designer from Power BI is loaded, and now we can create a report just like we do in Power BI (but in the browser).

Conclusion
This tip showed us how to start with the lakehouse artifact in Microsoft Fabric. You can upload files to the lakehouse and load them directly on tables. You can query the data using the familiar T-SQL language or create visual queries using the low-code environment of Power Query. A default Power BI dataset is created containing the lakehouse’s tables, allowing you to easily create reports on top of your data.
With a Fabric lakehouse, everyone can start harnessing the power of the data lakehouse without having the explicit need for expert knowledge in Spark, Python, or other data engineering skills.
Next Steps
- If you want to follow along with the examples, download the CSV file here.
- Check out other tips about Microsoft Fabric:
- Power BI Datasets

Koen Verbeeck is a seasoned business intelligence consultant with over a decade of experience with the Microsoft Data Platform. He holds several certifications, including Azure Data Engineer. He’s a prolific writer, with over 375 articles on technologies such as Microsoft Fabric, SSIS, ADF, SSAS, SSRS, MDS, Power BI, Snowflake and Azure services. He has spoken at various events such as PASS, SQLBits, dataMinds Connect and many others. He frequently delivers educational webinars on MSSQLTips.com. For his efforts, Koen has been awarded the Microsoft MVP data platform award for many years.
- MSSQLTips Awards:
- Leadership Award (200+ Tips) – 2021
- Author of the Year – 2014/2020/2022
- Author Contender – 2024/2025

excellent article