Problem
For years, many Power BI end users have had to move their data from Power BI to Excel for further ad-hoc analysis. In my experience, I have found that this is the case mainly because they find it easier to use Excel Pivot tables for analyzing their data even when they are not very technical at manipulating the data or understanding the modeling development process in Power BI. Does Power BI have a feature that let’s you pivot and analyze the data?
Solution
The new “Explore this data” feature in Power BI service allows end users to perform their analysis within Power BI without exporting the data to Excel first or connecting to the Power BI semantic model from Excel.
This tip will describe how this can be achieved. Please note that this new feature is still in preview, and we can expect more updates to be added in time for even more usage.
How Can I Locate this Feature?
First, you must log into the Power BI service. Select the workspace where you have the dataset (Semantic model), then click on the ellipses (…) to reveal this feature, as shown in the image below.
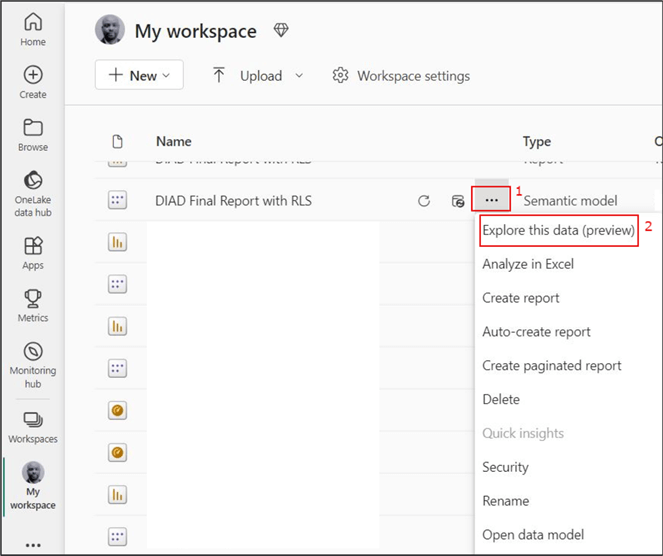
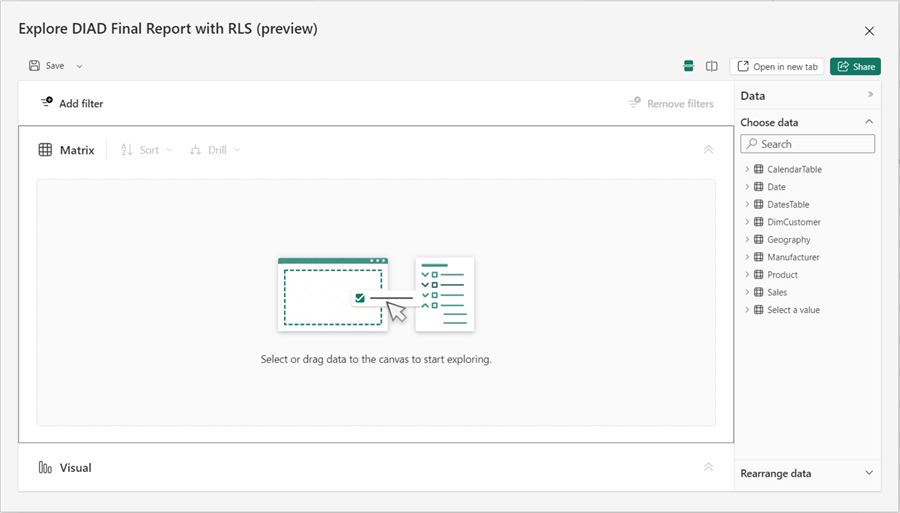
Click Explore this data, and a new window will open:
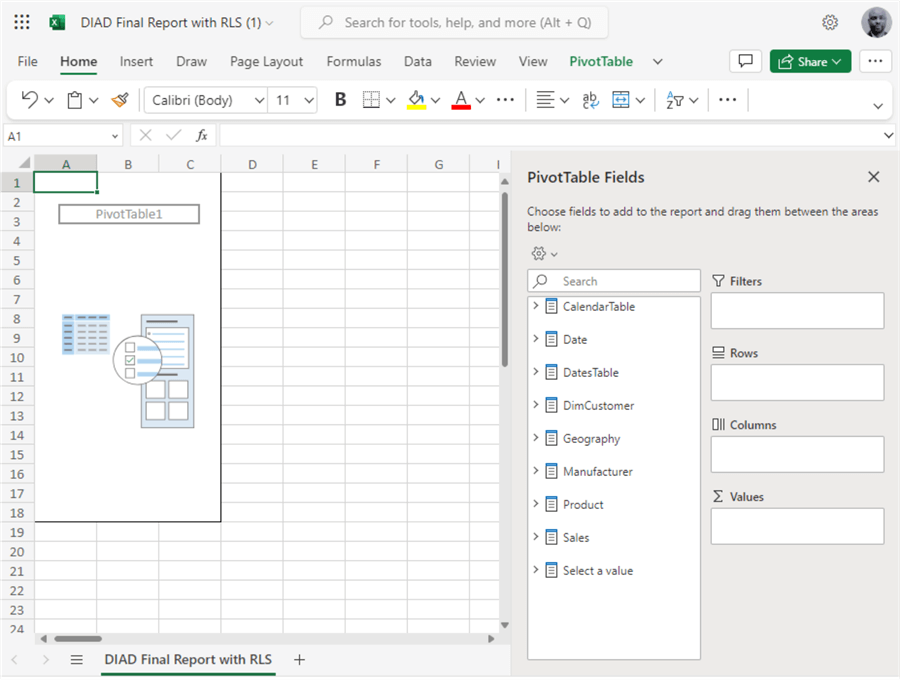
Below is the same view in an Excel Pivot table:
How Do I Use It Like a Pivot Table?
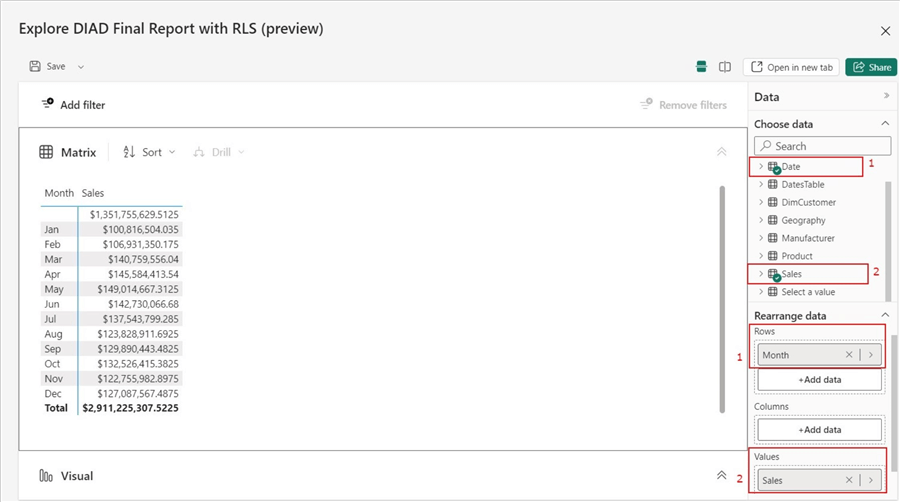
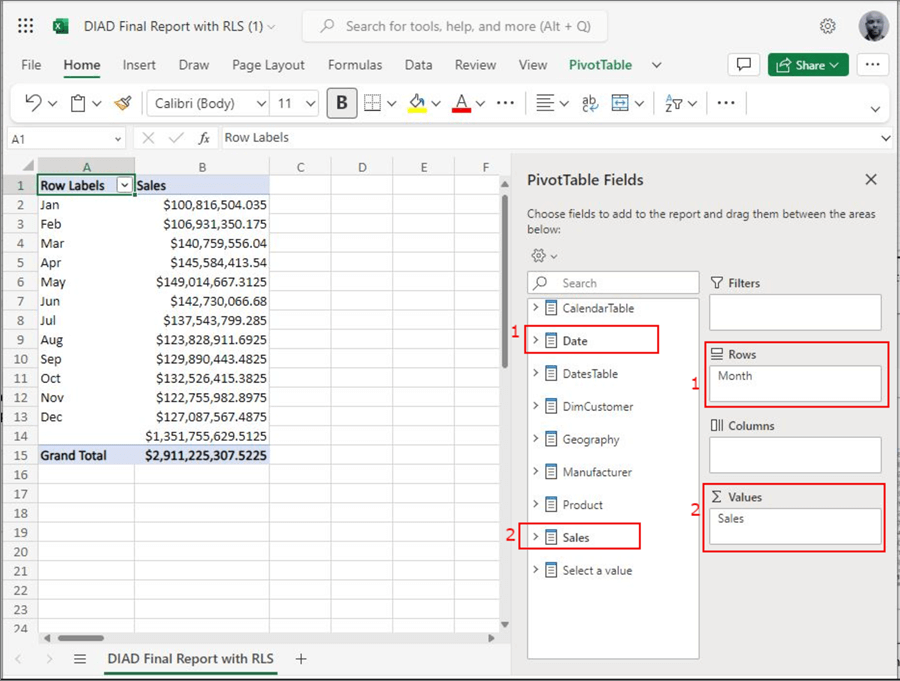
As you can see in the image above, like a pivot table view, you have the dataset on the right-hand side of the screen. You only need to drag the fields from the queries (tables) into the empty canvas. For example, I am going to pull “Month” from the “Date” table into rows and “Sales” from the “Sales” table into values. See the image below.
The same view with the same fields and values in the Excel Pivot table is shown below.
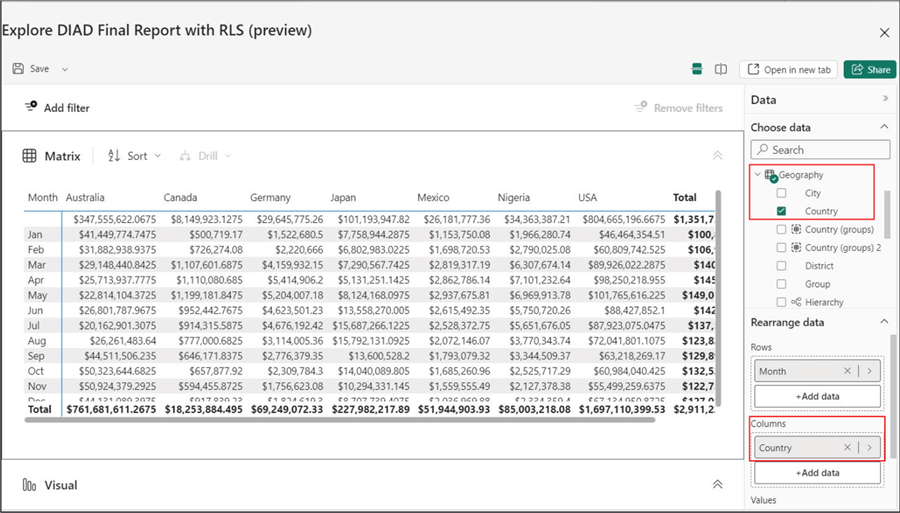
In the following image, we can add the “Country” field from the “Geography” table to the column well on the Power BI side.
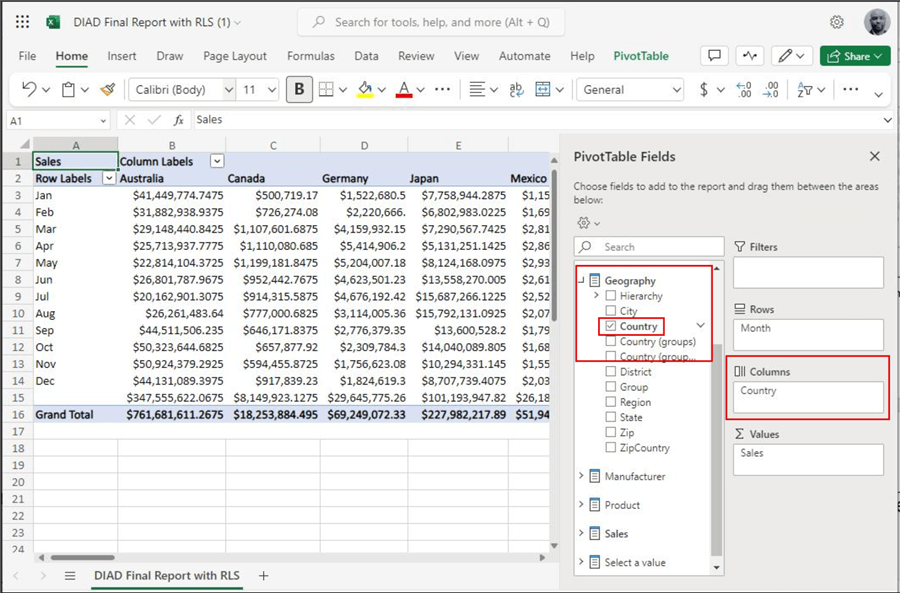
You would have something like the image below when completed in the Excel Pivot table:
Can Filters Be Added to the Power BI Visual?
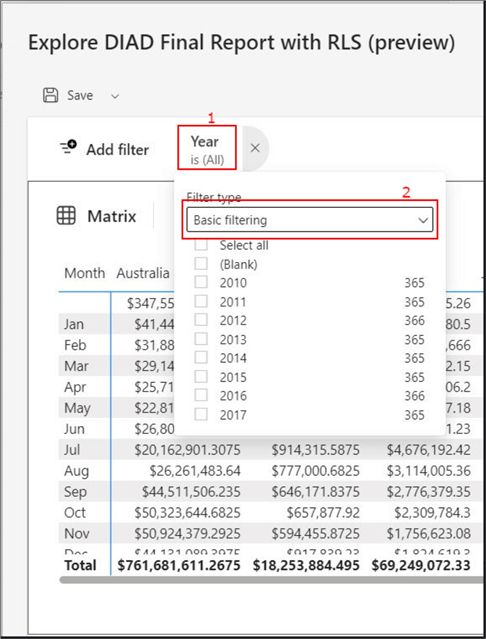
Like in a Pivot table in Excel, we can also add a filter to the visual. In this example, I have added a year filter using “Year” from the “Date” table. Follow the steps below.
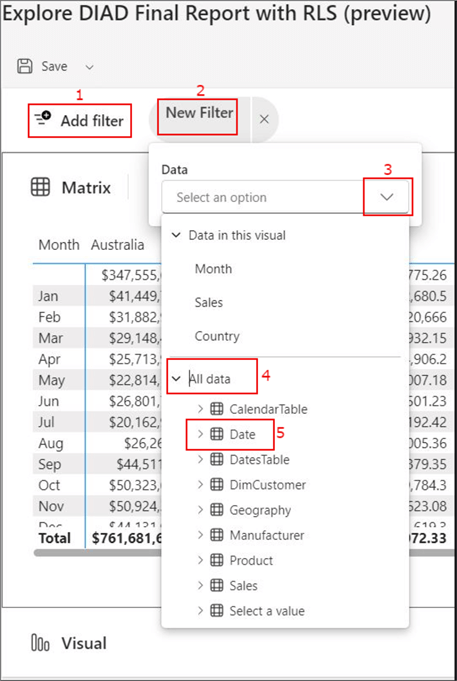
Click on “Add filter,” select “New Filter,” click on the dropdown, and expand “All data.” Next, choose the table that contains the needed field (in this case, it’s the “Date” table), and then select the field name.
The new filter will appear at the top left and have selections like what you find in a Pivot table filter (see image below). You can always add more filters if you wish.
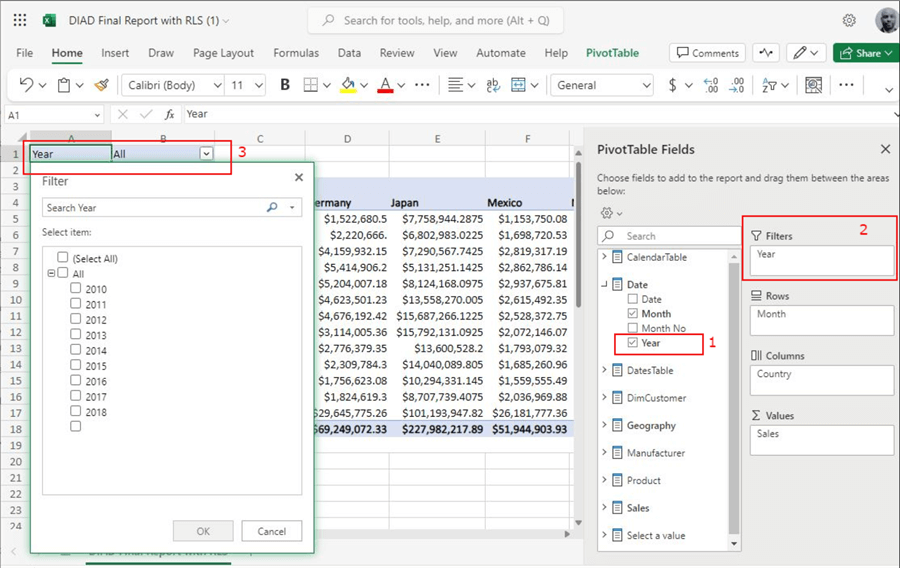
Filters on a Pivot table look very similar and are also located at the top left, as seen in the image below.
What Other Things Can I Do with this Feature?
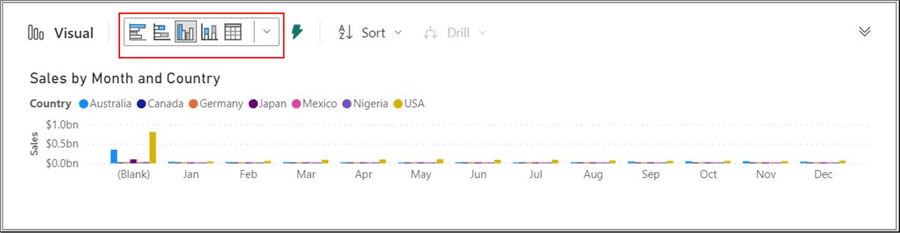
In addition to showing values on a matrix like a Pivot table, you can view the data in other types of visuals applicable to your needs. Let’s see how this works.
First, click on the arrows at the bottom right highlighted in the red box.
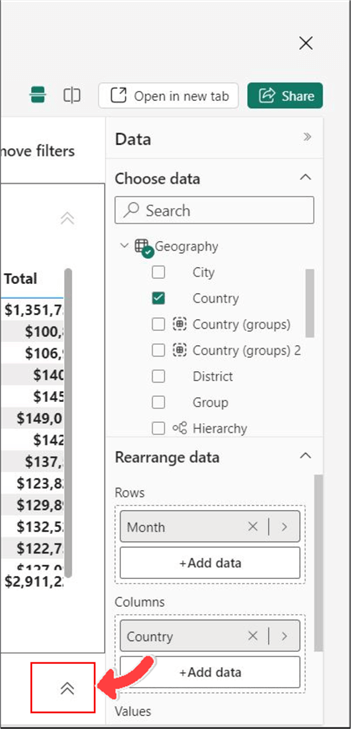
This reveals a visual for the fields used in the initial Matrix visual. You can change the visual to your preference in the area highlighted below.
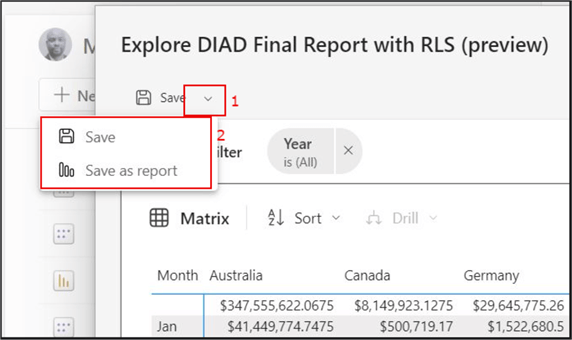
After completing the data pivoting, you can save your work by choosing “Save” as a pivot or “Save as report,” as seen below. You can also “Share” the pivoted report with others in your organization, as seen in the top right corner of the image below.
Current Feature Limitations
- You will need access permissions on the dataset (semantic model) you are exploring.
- Currently, you can only save your work on a workspace with premium capacity.
- Depending on what workspace you are saving your work (My workspace or an Enterprise workspace), you may need to refresh your page to see the created artifact if you’re using “My workspace.“
- If you change the sensitivity label on your Semantic model (dataset), it does not currently move to the exploration you created it on.
- This feature is currently not supported for streaming datasets.
- A Pro or Premium Per User (PPU) license is required to share explored data.
- You need to grant your end users build permission to the underlying dataset; otherwise, they cannot view the exploration.
In summary, the new “Explore this data” feature is still in preview, so expect more functionalities to be added over time. Also, as with everything in Power BI, there is always more than one way of doing things, like accessing this feature from within an existing report page and a Semantic model page as “Explore this data.”
Comment below to share how you use this feature apart from using it as an alternative to using Pivot tables in Excel.
Next Steps
- See the Fabric Blog on Explore data: Introducing Explore (Public Preview).
- Learn more about the Semantic model in Power BI service: Semantic models in the Power BI service.
- Read more on managing access permissions for semantic models in Power BI: Manage semantic model access permissions (preview).
- Read more on getting licenses for Power BI: Licensing the Power BI service for users in your organization.
- Try this tip with your data as business requires.

Kenneth A. Omorodion is a Microsoft Certified Solutions Associate (MCSA) with 12+ years of enterprise application experience in Power BI, DAX, Microsoft Fabric, Business Intelligence, data warehousing, SSRS, T-SQL, and Azure. Beyond his technical skills, Kenneth has expertise working with stakeholders’ and business leaders to help them better understand key insights. He has a great track record of successfully delivering full life cycle Business Intelligence and data solutions to organizations with measurable business impact.
- MSSQLTips Awards
- Achiever Award (75+ Tips) – 2025
- Author of the Year-2021
- Author Contender-2022/2023/2024


