Problem
Regression analysis is a statistical technique to identify relationships between a dependent variable (outcome) and one or more independent variables (features). Is it possible to do this in SQL Server without using any external tools?
Solution
SQL Server can support regression models for business intelligence and decision-making, enabling real-time insights directly from your data. It has a lot of applications in Business Forecasting, Finance, Healthcare, Manufacturing, Customer Analytics, and others.
For this example, I will create two user-defined table types: one for two variables, the other for three variables.
CREATE TYPE [dbo].[uttTwoVar] AS TABLE
      (n int IDENTITY
      ,x decimal(18, 6)
      ,y decimal(18, 6));

CREATE TYPE [dbo].[uttThreeVar] AS TABLE
      (n int IDENTITY
      ,x decimal(18, 6)
      ,y decimal(18, 6)
      ,z decimal(18, 6));
Terms and Definitions
Linear Regression
Linear regression involves a single independent variable to predict a dependent variable with a straight line.
Exponential Regression
Exponential regression is a statistical technique used to model the relationship between a dependent variable and an independent variable when the data exhibits exponential growth or decay. Examples include population growth, compound interest, radioactive decay, inflation rates, etc.
Polynomial Regression
Polynomial regression is a type of regression analysis that models the relationship between a dependent variable and one or more independent variables by fitting a polynomial equation to the data. This approach is particularly useful when the relationship between variables is nonlinear.
Coefficient of Determination (R2)
This measures how well the independent variable explains the variation in the dependent variable, and has a value between 0 and 1. When this value is close to 1, it indicates a good fit.
Mean Absolute Error (MAE)
This measures the average of absolute differences between predicted and actual values, providing a straightforward measure of prediction accuracy without heavily penalizing larger errors. Lower values indicate that predictions are close to the observed values.
Root Mean Squared Error (RMSE)
This measures the average magnitude of the residuals between the observed and predicted values giving an indication of how close the model’s predictions are to the actual data points. A lower RMSE indicates the best fit. It is very sensitive to outliers.
SQL Function for Regression Analysis
Here is the SQL code to create a function to allow us to do regression analysis in SQL Server.
-- =============================================
-- Author:      SCP - MSSQLTips
-- Create date: 20241031
-- Description: Regression Analysis
-- =============================================
CREATE FUNCTION [dbo].[tvfRegression]
         (@RegData dbo.uttTwoVar READONLY)
RETURNS @Analysis TABLE
         (Method  nvarchar(200)
         ,Formula nvarchar(200)
         ,R2      decimal(18,6)
         ,RMSE    decimal(18,6)
         ,MAE     decimal(18,6))
WITH EXECUTE AS CALLER
AS
BEGIN

   DECLARE @la decimal(18,6)
         ,@lb  decimal(18,6)
         ,@lc  decimal(18,6)
         ,@N   decimal(18,6) = (SELECT COUNT(*) FROM @RegData)
         ,@R2  decimal(18,6)
         ,@RM  decimal(18,6)
         ,@M   decimal(18,6)
         ,@X   decimal(18,6)
         ,@Y   decimal(18,6);

   -- LINEAR REGRESSION ==========
   -- y = a + b * x

   SELECT @lb = (SUM(X * Y) - SUM(X) * SUM(Y) / @N)
               / (SUM(SQUARE(X)) - SQUARE(SUM(X)) / @N)
      FROM @RegData;

   SELECT @la = (SUM(Y) / @N - @lb * SUM(X) / @N)
      FROM @RegData;

   SELECT @R2 = SQUARE(SUM(X * Y) - SUM(X) * SUM(Y) / @N)
               / ((SUM(SQUARE(X)) - SQUARE(SUM(X)) / @N)
               * (SUM(SQUARE(Y)) - SQUARE(SUM(Y)) / @N))
      FROM @RegData;

   SELECT @M = FORMAT(SUM(ABS(y - (@la + @lb * x))) / @N,'0.00')
      FROM @RegData;

   SELECT @RM = FORMAT(SQRT(SUM(SQUARE(y - ((@la + @lb * x)))) / @N),'0.00')
      FROM @RegData;

   INSERT INTO @Analysis
      SELECT '# Linear          # y = a + bx'
            ,CONCAT(CONVERT(float,@la)
                  ,CASE WHEN @lb > 0 THEN ' + ' ELSE ' - ' END
                  ,CONVERT(float,ABS(@lb)),' * x')
            ,@R2
            ,@RM
            ,@M;

   -- EXPONENTIAL CURVE FIT ==========
   -- y = a * e ^ (b * x)

   DECLARE @ea decimal(18,6)
         ,@eb decimal(18,6)
         ,@ec decimal(18,6);

   SELECT @eb = (SUM(X * LOG(Y)) - SUM(X) * SUM(LOG(Y)) / @N)
               / (SUM(SQUARE(X)) - SQUARE(SUM(X)) / @N)
      FROM @RegData;

   SELECT  @ea = EXP(SUM(LOG(Y)) / @N - @eb * SUM(X) / @N)
      FROM @RegData;

   SELECT @R2 = SQUARE(SUM(X * LOG(Y)) - SUM(X) * SUM(LOG(Y)) / @N)
               / ((SUM(SQUARE(X)) - SQUARE(SUM(X)) / @N)
               * (SUM(SQUARE(LOG(Y))) - SQUARE(SUM(LOG(Y))) / @N))
      FROM @RegData;

   SELECT @M = FORMAT(SUM(ABS(y - (@eA * EXP(@eB * x)))) / @N,'0.00')
      FROM @RegData;

   SELECT @RM = FORMAT(SQRT(SUM(SQUARE(y - (@eA * EXP(@eB * x)))) / @N),'0.00')
      FROM @RegData;

   IF @ea > 0
      INSERT INTO @Analysis
         SELECT '# Exponential # y = a * e ^ (b * x)'
               ,CONCAT(CONVERT(float,@ea),' * EXP('
                     ,CONVERT(float,@eb),' * x)')
            ,@R2
            ,@RM
            ,@M;

   -- POLYNOMIAL REGRESSION ==========
   -- y = a + b * x + c * x ^ 2

   DECLARE @PolyDt [dbo].[uttThreeVar];

   INSERT INTO @PolyDt
      SELECT POWER(X,0)
               ,POWER(X,1)
               ,POWER(X,2)
         FROM @RegData;

   DECLARE @PolyTransv [dbo].[uttThreeVar];

   INSERT INTO @PolyTransv
         SELECT SUM(X),SUM(Y),SUM(Z)
            FROM @PolyDt
      UNION ALL
         SELECT SUM(Y),SUM(Z),SUM(Y*Z)
            FROM @PolyDt
      UNION ALL
         SELECT SUM(Z),SUM(Y*Z),SUM(SQUARE(Z))
            FROM @PolyDt

   DECLARE   @a decimal(18,6)
            ,@b decimal(18,6)
            ,@c decimal(18,6)
            ,@d decimal(18,6)
            ,@e decimal(18,6)
            ,@f decimal(18,6)
            ,@g decimal(18,6)
            ,@h decimal(18,6)
            ,@i decimal(18,6)
            ,@y1 decimal(18,6)
            ,@y2 decimal(18,6)
            ,@y3 decimal(18,6)
            ,@dt decimal(18,6)
            ,@Beta0 decimal(18,6)
            ,@Beta1 decimal(18,6)
            ,@Beta2 decimal(18,6)
            ,@yavg decimal(18,6)
            ,@sstot decimal(18,6)
            ,@ssres decimal(18,6);

   SELECT    @y1 = SUM(P.x * R.y)
            ,@y2 = SUM(P.y * R.y)
            ,@y3 = SUM(P.z * R.y)
      FROM @PolyDt P LEFT OUTER JOIN
             @RegData R ON
             P.n = R.n;

   SELECT    @a = x
            ,@b = y
            ,@c = z
      FROM @PolyTransv
      WHERE n = 1;

   SELECT    @d = x
            ,@e = y
            ,@f = z
      FROM @PolyTransv
      WHERE n = 2;

   SELECT    @g = x
            ,@h = y
            ,@i = z
      FROM @PolyTransv
      WHERE n = 3;

   SET @dt = @a * (@e * @i - @f * @h) - @b * (@d * @i - @f * @g) + @c * (@d * @h - @e * @g);

   DECLARE @PolyCofactor [dbo].[uttThreeVar];

   INSERT INTO @PolyCofactor
      VALUES (  @e * @i - @f * @h ,-(@d * @i - @f * @g),  @d * @h - @e * @g )
            ,(-(@b * @i - @c * @h),  @a * @i - @c * @g ,-(@a * @h - @b * @g))
            ,(  @b * @f - @c * @e ,-(@a * @f - @c * @d),  @a * @e - @b * @d );

   DECLARE @PolyAdjugate [dbo].[uttThreeVar];

   INSERT INTO @PolyAdjugate -- is inserting transposed
      VALUES (  @e * @i - @f * @h ,-(@b * @i - @c * @h),  @b * @f - @c * @e )
            ,(-(@d * @i - @f * @g),  @a * @i - @c * @g ,-(@a * @f - @c * @d))
            ,(  @d * @h - @e * @g ,-(@a * @h - @b * @g),  @a * @e - @b * @d );

   UPDATE    @PolyAdjugate
      SET    X = X / @dt
            ,Y = Y / @dt
            ,Z = Z / @dt;

   SELECT    @Beta0 = (x * @y1) + (y * @y2) + (z * @y3)
      FROM @PolyAdjugate
      WHERE n = 1;

   SELECT    @Beta1 = (x * @y1) + (y * @y2) + (z * @y3)
      FROM @PolyAdjugate
      WHERE n = 2;

   SELECT    @Beta2 = (x * @y1) + (y * @y2) + (z * @y3)
      FROM @PolyAdjugate
      WHERE n = 3;

   SELECT    @yavg = AVG(y)
      FROM @RegData;

   SELECT    @sstot = SUM(SQUARE(y - @yavg))
      FROM @RegData;

   SELECT    @ssres = SUM(SQUARE(y - (@Beta0 + @Beta1 * x + @Beta2 * SQUARE(x))))
      FROM @RegData;

   SELECT    @R2 = 1 - @ssres / @sstot;

   SELECT    @M = FORMAT(SUM(ABS(y - (@Beta0 + @Beta1 * x + @Beta2 * SQUARE(x)))) / @N,'0.00')
      FROM @RegData;

   SELECT    @RM = FORMAT(SQRT(SUM(SQUARE(Y - (@Beta0 + @Beta1 * x + @Beta2 * SQUARE(x)))) / @N),'0.00')
      FROM @RegData;

   INSERT INTO @Analysis
      SELECT '# Polynomial  # y = a + b * x + c * x^2'
            ,CONCAT(CONVERT(float,@Beta0)
                  ,CASE WHEN @Beta1 > 0 THEN ' + ' ELSE ' - ' END
                  ,CONVERT(float,ABS(@Beta1)),' * x'
                  ,CASE WHEN @Beta2 > 0 THEN ' + ' ELSE ' - ' END
                  ,CONVERT(float,ABS(@Beta2)),' * SQUARE(x)')
            ,@R2
            ,@RM
            ,@M;

-- ==========

   RETURN;
END
Regression Analysis Tests
Execute the following code to create a table and some data:
DECLARE @RlData [dbo].[uttTwoVar];
INSERT INTO @RlData
  VALUES (1, 2)
        ,(2, 3)
        ,(3, 5)
        ,(4, 7)
        ,(5,11);
SELECT * FROM [dbo].[tvfRegression] (@RlData);
Results:
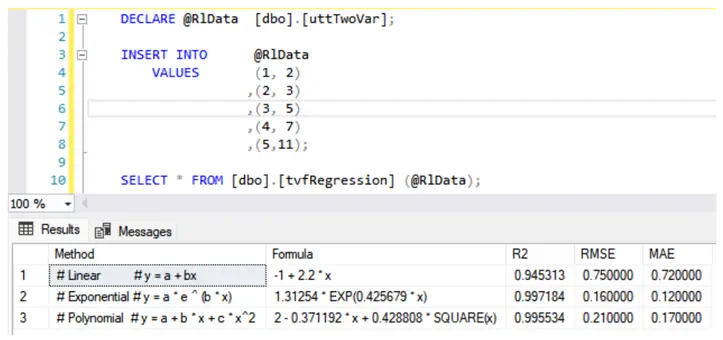
Looking at the results, we can conclude that the best fit for exponential regression has the greatest R2 and the smallest RMSE and MAE.
Next Steps
Check out these additional resources:
- Multiple Linear Regression for Estimation and Prediction in SQL Server
- Decision Tree Regression vs Bagging Regression with T-SQL and Excel
- Implement Linear Regression in Python for Machine Learning
- Multiple Regression Model Enhanced with Bagging
- WIKIPEDIA – Regression Analysis
- WIKIPEDIA – Linear Regression
- WIKIPEDIA – Polynomial Regression

Sebastião Pereira has over 40 years of experience in database development including T-SQL, algorithm design, machine learning and bringing innovative mathematical formulas to SQL Server. He started his career at a transnational fast-moving consumer goods (FMCG) company as an employee then later transitioning into a consultant role. He eventually founded his own company to develop software solutions for the healthcare industry. Sebastião is a respected award-winning author on MSSQLTips.com extending SQL Server capabilities beyond traditional workloads.
- MSSQLTips Awards
- Author of the Year – 2025
- Trendsetter (25+ tips) – 2025
- Rookie of the Year – 2024


Great article, thank you