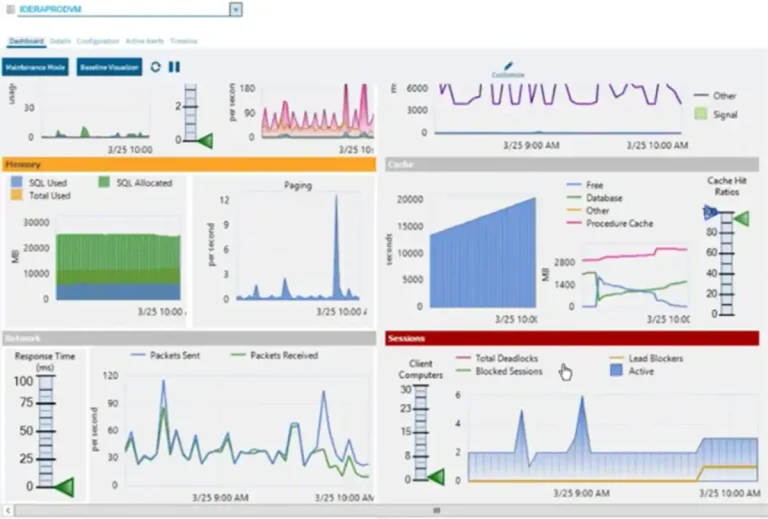
Overview
Although everyone could just use Performance Monitor to view the data, sometimes you want to be able to do something a little more complex when visualizing the data. Many people, especially Windows users, like to use Excel to generate graphs and charts. But before we can use a spreadsheet to create our own reports, there is one small change that we have to make to the data collector.
Explanation
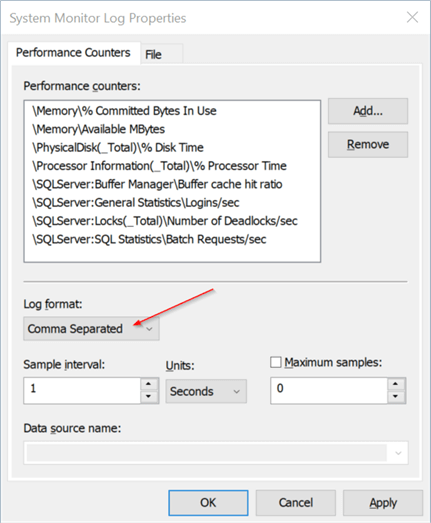
By default, the log file used to store the performance counter data is in a binary format. To open the log file data in a spreadsheet, we need to store this data in CSV format. To do this, open the “Properties” for the data collector and update the “Log format” to “Comma Separated,” as shown below.
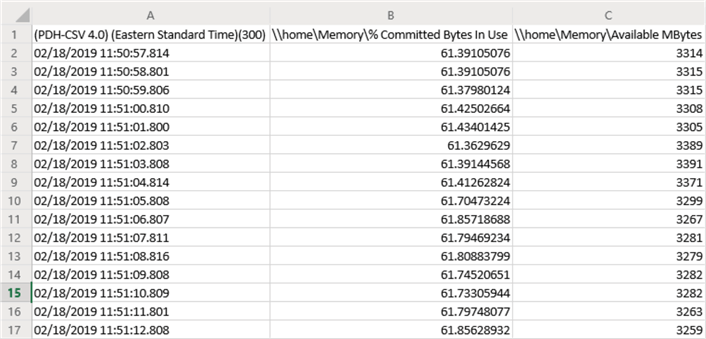
Once that is done and we have run our data collector set again, the latest performance counter data should be stored in a CSV format. Below is an excerpt from the CSV file.
I won’t go into too much detail in creating reports using Excel, as that could be a whole topic on its own. However, once you have the performance counter data in a file in CSV format, creating a report is as simple as opening the file, selecting all the data, and then using the “Insert” Menu to select the type of chart you want to create, as shown below.

Below is an example of the 2D line graph we selected above.

Additional Information
- Collect SQL Server Performance Counters and Build Reports with SSRS
- Collecting Performance Counters and Using SQL Server to Analyze the Data
- Creating SQL Server Performance Based Reports Using Excel

Ben Snaidero has been a Database Administrator for just over 10 years. Starting out working mainly with Oracle he got into SQL Server in 2005 and has worked primarily with SQL Server for the last 3 years. His main focus with both Oracle and SQL Server is in the area of performance tuning.
- MSSQLTips Awards: Achiever (75+ tips) – 2018 | Author of the Year Contender – 2016-2017