Overview
With the manual nature of adding counters, it can be quite time-consuming to have to do this manually on many servers. Luckily, Perfmon provides a method for saving the data collector set as a template. This template can then be used to create the same data collector set on another server.
Explanation
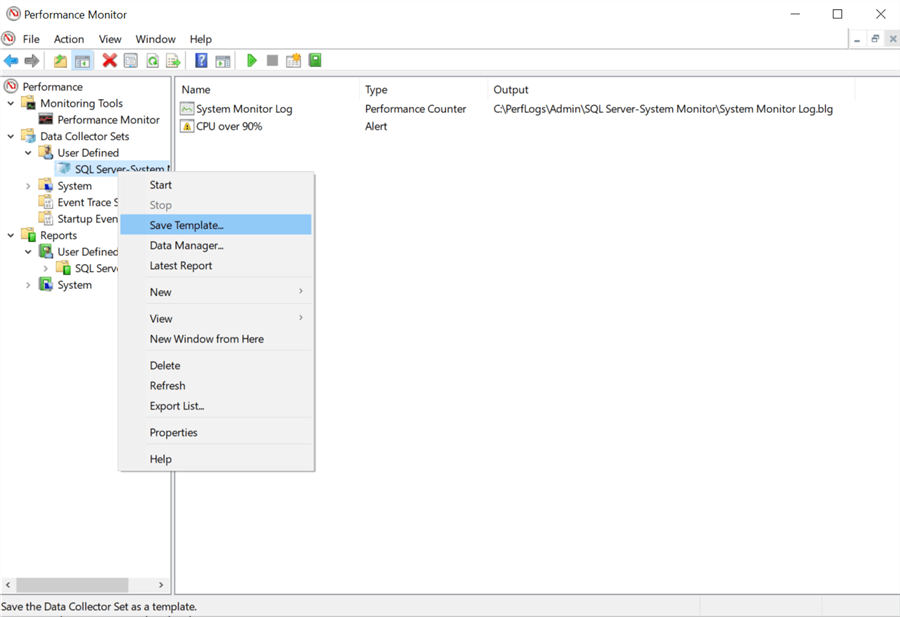
If we right-click on the data collector set we want to export, we can see in the screenshot below the option to “Save Template…” After selecting this, pick a folder and file name, and the XML template will be exported.
Below is an excerpt from the template .xml file, which shows the counters associated with the performance counter collector and the alert.
<PerformanceCounterDataCollector> <DataCollectorType>0</DataCollectorType> <Name>System Monitor Log</Name> <FileName>System Monitor Log</FileName> <FileNameFormat>0</FileNameFormat> <FileNameFormatPattern> </FileNameFormatPattern> <LogAppend>0</LogAppend> <LogCircular>0</LogCircular> <LogOverwrite>0</LogOverwrite> <LatestOutputLocation>C:\PerfLogs\Admin\SQL Server-System Monitor\System Monitor Log.blg</LatestOutputLocation> <DataSourceName> </DataSourceName> <SampleInterval>1</SampleInterval> <SegmentMaxRecords>0</SegmentMaxRecords> <LogFileFormat>3</LogFileFormat> <Counter>\Memory\% Committed Bytes In Use</Counter> <Counter>\Memory\Available MBytes</Counter> <Counter>\PhysicalDisk(_Total)\% Disk Time</Counter> <Counter>\Processor Information(_Total)\% Processor Time</Counter> <Counter>\SQLServer:Buffer Manager\Buffer cache hit ratio</Counter> <Counter>\SQLServer:General Statistics\Logins/sec</Counter> <Counter>\SQLServer:Locks(_Total)\Number of Deadlocks/sec</Counter> <Counter>\SQLServer:SQL Statistics\Batch Requests/sec</Counter> <CounterDisplayName>\Memory\% Committed Bytes In Use</CounterDisplayName> <CounterDisplayName>\Memory\Available MBytes</CounterDisplayName> <CounterDisplayName>\PhysicalDisk(_Total)\% Disk Time</CounterDisplayName> <CounterDisplayName>\Processor Information(_Total)\% Processor Time</CounterDisplayName> <CounterDisplayName>\SQLServer:Buffer Manager\Buffer cache hit ratio</CounterDisplayName> <CounterDisplayName>\SQLServer:General Statistics\Logins/sec</CounterDisplayName> <CounterDisplayName>\SQLServer:Locks(_Total)\Number of Deadlocks/sec</CounterDisplayName> <CounterDisplayName>\SQLServer:SQL Statistics\Batch Requests/sec</CounterDisplayName> </PerformanceCounterDataCollector> <AlertDataCollector> <DataCollectorType>3</DataCollectorType> <Name>CPU over 90%</Name> <Alert>\Processor(_Total)\% Processor Time>90</Alert> <AlertDisplayName>\Processor(_Total)\% Processor Time>90</AlertDisplayName> <EventLog>0</EventLog> <SampleInterval>15</SampleInterval> <Task> </Task> <TaskRunAsSelf>0</TaskRunAsSelf> <TaskArguments> </TaskArguments> <TaskUserTextArguments> </TaskUserTextArguments> <TriggerDataCollectorSet> </TriggerDataCollectorSet> </AlertDataCollector>
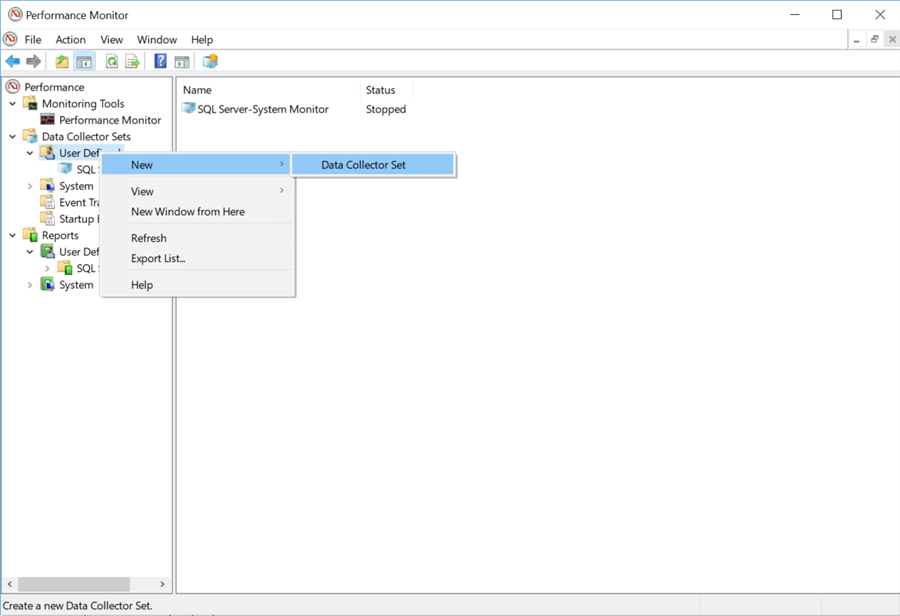
Once you have a template defined, you can then use the following steps to create a new data collector set on another server. You can also follow these steps to create other data collector sets using a few different predefined templates. To start this process, right-click on the “Data Collector Sets”> “User- Defined” folder and select “New” > “Data Collector Set.”
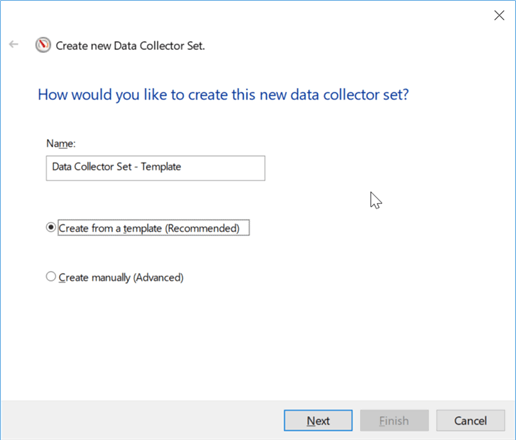
Once selected, the following window will open where you, as we did before, give the data collector set a name and select “Create from template.” Note: Selecting “Create manually” will simply guide you through a process of manually selecting performance counters (or alert types) similar to what we did above for real-time data collection.
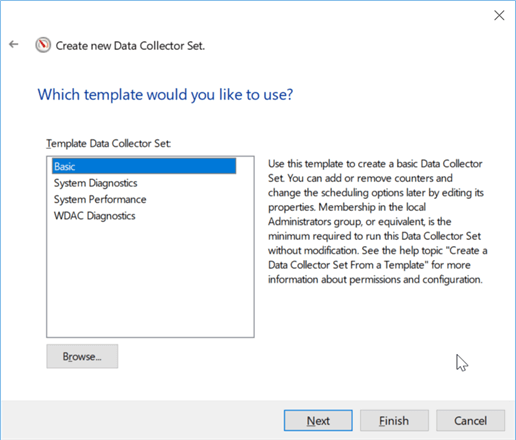
After clicking “Next,” you will be presented with the following window where you can either select a predefined template or click “Browse” and select the .xml template you exported earlier.
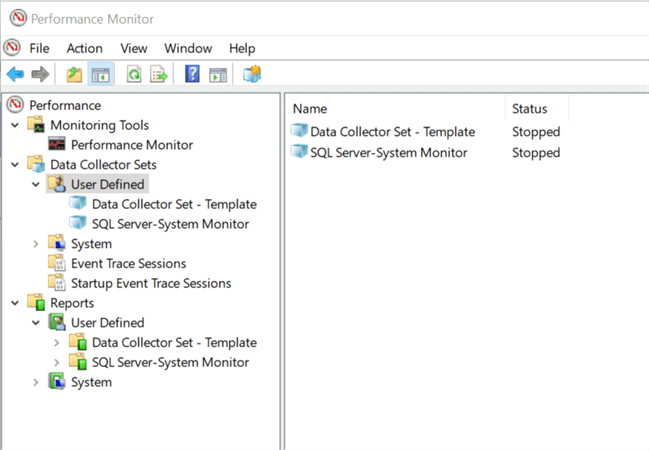
Once that is done, click “Finish,” and you should see another data collector set in the “User Defined” folder, as shown below.
Additional Information
- Using Perfmon for SQL Server Reporting Services Performance Management
- Viewing VMware Counters in Perfmon for SQL Server
- Perfmon Counters for the Integration Services Data Flow Engine

Ben Snaidero has been a Database Administrator for just over 10 years. Starting out working mainly with Oracle he got into SQL Server in 2005 and has worked primarily with SQL Server for the last 3 years. His main focus with both Oracle and SQL Server is in the area of performance tuning.
- MSSQLTips Awards: Achiever (75+ tips) – 2018 | Author of the Year Contender – 2016-2017