Overview
A Hierarchy is a set of logically related attributes with a fixed cardinality. While browsing the data, a hierarchy exposes the top level attribute which can be broken down into lower level attributes. For example, Year -> Semester - Quarter - Month is a hierarchy. While analyzing the data, it might be required to drill down from a higher level to a detail level, and exposing data as a hierarchy is one of the best solutions for this.
Explanation
Creating a hierarchy is as easy as dragging and dropping attributes in the hierarchy pane of the dimension editor. We want to create a hierarchy in the Sales Territory dimension. Open Sales Territory dimension in the dimension editor, drag and drop attributes in the hierarchy pane, click on each of them and rename them to something appropriate. After completing this, your hierarchy should look similar to the below screenshot.
You will find a warning icon on the hierarchy pane, which says that attribute relationships are missing between these attributes. Country has a one-to-many relationship with Region, and Group has a one-to-many relationship with Country. But these relationships need to be defined explicitly in the dimension. Click on Attribute Relationships tab, right-click the region attribute and select “New Attribute Relationship”. Set the values as shown in the below screenshot to correct the relationships between these attributes.
After you have applied the above changes, your attribute relationship tab should look like the below screenshot.
If you have observer carefully, relationship types are of two types: Rigid and Flexible. This has an effect on the processing of the cube. Rigid means that you do not expect the relationship to change and Flexible means that relationship values can change. In our dataset, Group is a logical way to categorize countries and it can change, while regions within country have limited or no change. So the relationship type between country and group should be flexible and relationship type between region (sales territory key) and country should be rigid. Double click on the arrow joining Key attribute and Country, and change the relationship type as shown below.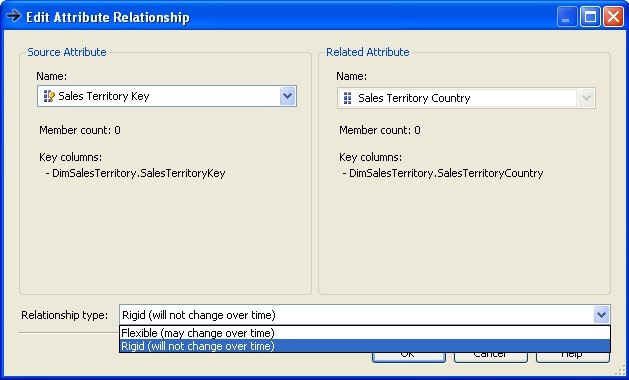
Check out the Hierarchy pane, and you should find that the warning icon is no longer visible. You can change the name of the hierarchy to something appropriate. In the interest of beginners who might get confused with the distinction between attributes and hierarchy, we will keep the name as “Hierarchy”.
Edit the Date dimension, and create a Year - Semester - Quarter - Month hierarchy in the date dimension.

Siddharth has more than 14 years of experience in the IT Industry, with more than a decade of experience in Business Intelligence and Analytics, for clients banking, logistics, government, Media Entertainment, products, life sciences and other domains. He has been a lead architect for a portfolio of 40+ apps, containing apps in web, mobile, BI, Analytics, data warehousing, reporting, collaboration, CMS, NoSQL and other technologies. He has several certifications and is a published author for online and print-media publications, as well as the MSDN Library.
In his present role, he remains responsible for architecture design, technology stack selection, infrastructure design, 3rd party products evaluation and procurement, and performance engineering. These applications use technologies like Elasticsearch / Lucene, MongoDB, SharePoint 2013 and 2010, jQuery-based framework like Highcharts and GoJS, SQL Server and the Microsoft Business Intelligence stack (SSIS, SSAS, SSRS, MDX, PowerPivot, PowerView), jQueryMobile, Bootstrap, iOS xCode framework, and many others.
- MSSQLTips Awards: Champion (100+ tips) – 2018 | Author of the Year – 2017 | Author Contender – 2016, 2018-2019