Problem
SQL Server 2012 has a lot of new features to offer and one of these features is the new system stored procedure SP_SERVER_DIAGNOSTICS which can be used to capture diagnostic data and SQL Server Health information. In this tip we take a look at this new system stored procedure.
Solution
In this tip we will discuss how to use SP_SERVER_DIAGNOSTICS a new system stored procedure which is available in SQL Server 2012.
A user with VIEW SERVER STATE permission on the server can use SP_SERVER_DIAGNOSTICS to capture diagnostic data and health information for a SQL Server to detect potential failures.
Here is sample code to run this command:
Use master

GO

EXEC sp_server_diagnostics

GO
The above stored procedure also accepts a parameter @repeat_interval with a default value of 0. If you want the stored procedure to run continuously then the minimum value for the @repeat_interval parameter should be 5 seconds as it takes at least 5 seconds to return the complete result set.
In the below snippet you can see the output once the stored procedure is executed.
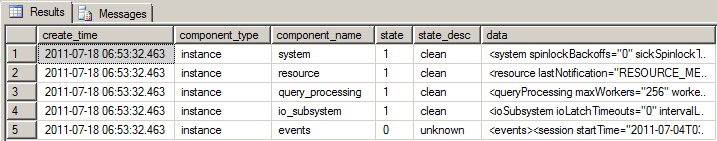
Using the SP_SERVER_DIAGNOSTICS stored procedure one can gather System, Resource, Query Processing, IO Sub System and Events information.
Let’s go through each of these components in detail to know what one should expect once the SP_SERVER_DIAGNOSTICS stored procedure is executed successfully.
• System: – It collects information with respect to CPU Usage, Page Faults, Non Yielding Tasks, Latches, Access Violations, Dumps and Spinlock Activity.
• Resource: – It collects data such as Physical and Virtual Memory, Page Faults, Cache, Buffer Pools and other relevant memory related objects.
• Query Processing: – It collects data with respect to Query Processing such as Wait Types, Tasks, Worker Threads, CPU Intensive Requests and Blocking tasks etc.
• IO Subsystems: – It collects data with respect to IO such as IO Latch Time outs, Interval Long IO’s, Longest Pending Requests etc.
• Events: -It collects data such as ring buffer exceptions, ring buffer events about memory broker, buffer pool, spinlocks, security, out of memory, scheduler monitor etc.
In addition to the above, the stored procedure result set also indicates the health of each component using State and State Description columns. The below table describes each state and its description as listed in MSDN.
| State | State Description |
|---|---|
| 0 | Unknown |
| 1 | Clean |
| 2 | Warning |
| 3 | Error |
Next Steps
- Read more about SP_SERVER_DIAGNOSTICS (Transact-SQL)
- Stay tuned for more tips on SQL Server 2012 and check out these related tips:
