Problem
Please show how to populate a SQL Server table with historical stock prices and volumes from Yahoo Finance for all NASDAQ ticker symbols. I need the demonstration to illustrate how to generate historical data going back at least several years as well as how to change the starting and ending dates. Also, identify data issues for collating ticker symbols between the NASDAQ website and the Yahoo Finance website.
Solution
Stock analysts, stock market advisory services, and leading financial publications often share opinions about which stocks are likely to rise and fall in the future and when these changes will probably happen. However, only the stock market can show with absolute certainty the path of a stock price, and the market presents it to us each day in end-of-day price and volume data for ticker symbols. As a result, it can be of value to populate a SQL Server table with actual end-of-day price and volume data for stock ticker symbols. A ticker symbol (or value) is an alphanumeric string that is a short alias for a company’s name.
SQL Server is great at storing stuff, including historical ticker prices, but it is less well suited to interface directly with Google Finance and Yahoo Finance to download historical prices for lots of different ticker symbols. On the other hand, Python has special libraries designed for simplifying the extraction of stock price and volume history from both Yahoo Finance and Google Finance. This tip demonstrates how to use Python for harvesting historical ticker symbol prices from Yahoo Finance and inserting the collected prices into SQL Server. By analyzing past performance, you may be able to enhance your own abilities to select stocks that allow you to grow your personal wealth rapidly and safely. Of course, these same kinds of analyses can help businesses relate to investors who seek guidance about how to buy and sell stocks for personal gain.
Database administrators and developers taking advantage of Microsoft SQL Server for storing data as well as Python for gathering data from websites have the tools for building ticker symbol price and volume datasets. This tip builds on two prior tips (first tip and second tip) to show how to automate the population of a SQL Server table with all ticker symbols for the NASDAQ exchange. This exchange is very popular with personal investors – especially those who favor fast-growing stocks for technical companies. As of the time this tip is being prepared, there are nearly 3,300 NASDAQ ticker symbols. The Yahoo Finance website interfaces with the pandas_datareader external library for Python to return historical price and volume data for ticker symbols in a tabular format. Data are gathered from the first stock trading day in 2014 through early November 2017, but the code presented in this tip makes it easy to change both the start and end dates for collecting data.
This tip presents a two-step approach for harvesting historical price and volume data for NASDAQ ticker symbols. Each step has three code elements associated with it:
- a Python script to gather data from either the NASDAQ website or Yahoo Finance website
- a short Windows batch file for invoking the Python script that does the data gathering
- a T-SQL script that can run the Windows batch file from inside of SQL Server Management Studio and populate a SQL Server table with the extracted and casted data
Setting up to use Python with SQL Server for this tip
A couple of prior tips introduced a technique for running Python scripts in any version of SQL Server. In case you have not had a chance to review these prior tips, you may care to scan them so that you can successfully and safely use the code presented in this tip.
- See this tip for step-by-step instructions on installing Python on a computer for use by a team of developers.
- Another tip demonstrates how to configure SQL Server SQL Server for running Python scripts safely from SQL Server Management Studio. This tip is particularly important because it applies to any version of SQL Server going back to SQL Server 2000.
One important reason Python is so powerful is because of the availability of a large set of external libraries that add functionality not provided by the built-in Python library. The pandas_datareader external library facilitates collecting historical prices and volumes from both Google Finance and Yahoo Finance (as well as other web-based financial and economic data sources). The BeautifulSoup external library facilitates reading and downloading HTML content from urls, such as one on the NASDAQ website with data for all listed companies. Before you can use an external Python library, you must
- install it on a computer
- reference it from a Python script
The process for installing and referencing external libraries is described and demonstrated in these tips (here and here).
Microsoft is rapidly embracing Python technology with new releases to its software suites including these
- See these two references for more about Python and SQL Server ( here and here)
- This reference is the first in a six-part series on using Python in Microsoft Visual Studio
Getting all NASDAQ tickers
This tip uses three program files to create a txt file with all NASDAQ ticker values.
- All Nasdaq companies with beautifulsoup.py is a Python script file for displaying ticker values and related information for all stocks listed for trading at the NASDAQ exchange. The script
- Addresses a url containing an HTML table that has a row for each company listed on the NASDAQ exchange
- Uses the BeautifulSoup external library for reading the HTML table and exposing table column field values with information about NASDAQ-listed companies
- Generates a stream of text content with fourteen lines for each NASDAQ-listed company; one line in each set of fourteen contains the ticker value for a company
- All Nasdaq companies with beautifulsoup.bat is a Windows batch file with two commands.
- First, it changes the current directory to the folder with the Python interpreter (python.exe).
- Second, it uses the Python interpreter to run the all Nasdaq companies with beautifulsoup.py file. Its output is deposited in the Windows shell running the Python script file.
- By storing all Python script files in a folder on the computer running SQL Server, you make your Python script files available for easy reference by T-SQL scripts. I use the C:\python_programs directory for storing Python script files and files with related content.
- Save Nasdaq tickers to a file.sql is a sql file with a T-SQL script. The T-SQL script
- Runs the all Nasdaq companies with beautifulsoup.bat file and saves the raw results from the Windows batch file in the #Result SQL Server table
- Processes the #Result table to preserve selected information about NASDAQ-listed companies, including their ticker values, in a SQL Server table named #pivotsource; one column in the #pivotsource table has NASDAQ ticker values
- Processes the #pivotsource table and creates a new table (##nasdaq_tickers) containing just ticker values for all NASDAQ-listed stocks; values from the ##nasdaq_tickers table are exported to the nasdaq_tickers.txt file in the c:\python_programs path
See below the listing for the contents of the all Nasdaq companies with beautifulsoup.py file. This script is unchanged from an earlier tip on which this tip builds. Pay particular attention to the programmatically listing the table rows for an HTML table section in the prior tip for detailed commentary on the script’s design, operation, and output. For the purposes of this tip, the following script generates raw output for consumption by the script in the Windows batch file named all Nasdaq companies with beautifulsoup.bat.
#import BeautifulSoup
from bs4 import BeautifulSoup
#import request
import requests
#specify a web page from which to harvest ticker symbols
#and submit the returned html to BeautifulSoup for parsing
r=requests.get('http://www.nasdaq.com/screening/companies-by-industry.aspx?exchange=NASDAQ&pagesize=4000')
data = r.text
soup = BeautifulSoup(data, "html.parser")
#select a specific table from the html page
#loop through rows of the table
#loop through the cells of a row
#results in 14 lines of text per symbol
table = soup.find( "table", {"id":"CompanylistResults"} )
for row in table.findAll("tr"):
    for cell in row("td"):
        print (cell.get_text().strip())
The purpose of the all nasdaq companies with beautifulsoup.bat file is to provide a handle for SQL Server Management Studio to be able to invoke the all nasdaq companies with beautifulsoup.py file. The two commands in the batch file appear below.
cd C:\Program Files\Python36python.exe "C:\python_programs\all nasdaq companies with beautifulsoup.py"
As indicated above, there are three distinct parts to the T-SQL script in the save Nasdaq tickers to a file.sql file. The excerpt below for the first part captures the raw output from the all Nasdaq companies with beautifulsoup.bat file.
- This script segment uses the xp_cmdshell extended stored procedure to run the all Nasdaq companies with beautifulsoup.bat file and saves the raw output in the #Result table.
- See the elements of running the xp_cmdshell extended stored procedure section in this tip to learn how to configure SQL Server to securely run the xp_cmdshell extended stored procedure.
 -- pull tickers and related data from nasdaq.com
-- enable the xp_cmdshell stored procedure
EXEC sp_configure 'xp_cmdshell', 1
RECONFIGURE
--------------------------------------------------------------------------------------
-- create a fresh temp table (#Result) for storing unprocessed result set from
-- running xp_cmdshell for Windows batch that invokes
-- python script
if exists (
 select * from tempdb.dbo.sysobjects o
 where o.xtype in ('U')
 and o.id = object_id(N'tempdb..#Result')
)
BEGIN
  DROP TABLE #Result;
END
CREATE TABLE #Result
(
  line varchar(500)
)
--------------------------------------------------------------------------------------
-- insert python script output into #Result temp table
INSERT #Result exec xp_cmdshell 'C:\python_programs\"all nasdaq companies with beautifulsoup.bat"'
--------------------------------------------------------------------------------------
-- disable the xp_cmdshell stored procedure
EXEC sp_configure 'xp_cmdshell', 0
RECONFIGURE
GO
The second excerpt from the save Nasdaq tickers to a file.sql file shows how to process the raw output in the #Result table to a collection of columns in another SQL Server table (#pivotsource), which includes information about all NASDAQ-listed companies, including their ticker values. The details of this code are described in a prior tip within the Reading Python parsed table output to populate a SQL Server table section.
 -- setup to clean and extract tickers
-- from raw nasdaq.com stock listing
use tempdb
begin try
   drop sequence dbo.CountBy1_to_delete_row_number
end try
begin catch
   print 'CountBy1_to_delete_row_number'
end catch
begin try
   drop table #Result_with_to_delete_row_number
end try
begin catch
   print '#Result_with_to_delete_row_number'
end catch
begin try
   drop table #pivotsource
end try
begin catch
   print '#pivotsource'
end catch
create sequence CountBy1_to_delete_row_number
    start with 1
    increment by 1;
select
   next value for CountBy1_to_delete_row_number AS source_row_number
  ,line
into #Result_with_to_delete_row_number
from #Result
declare @max_source_row_number int = (select max(source_row_number) from #Result_with_to_delete_row_number)
-- pull column values into #pivotsource with names for
-- COMPANY NAME, TICKER, MARKET CAP, COUNTRY, IPO YEAR and INDUSTRY
-- for nasdaq.com stocks
select
   tickers.TICKER_NUMBER
   ,
   case
 when row_number_within_ticker = 0 then 'COMPANY NAME'
 when row_number_within_ticker = 1 then 'TICKER'
 when row_number_within_ticker = 2 then 'MARKET CAP'
 when row_number_within_ticker = 4 then 'COUNTRY'
 when row_number_within_ticker = 5 then 'IPO YEAR'
 when row_number_within_ticker = 6 then 'INDUSTRY'
   end ticker_ids
   ,ticker_value
into #pivotsource
from
(
-- ticker values for ticker_number values
select
   (source_row_number-5) / 14 TICKER_NUMBER
   ,line TICKER
from #Result_with_to_delete_row_number
where
   source_row_number != @max_source_row_number
   and source_row_number not between 1 and 4
   and ((source_row_number-5) % 14) = 1
) tickers
left join
(
select
   (source_row_number-5) / 14 TICKER_NUMBER
   ,((source_row_number-5) % 14) row_number_within_ticker
   ,line ticker_value
from #Result_with_to_delete_row_number
where
   source_row_number != @max_source_row_number
   and source_row_number not between 1 and 4
   and ((source_row_number-5) % 14) in (0, 1, 2, 4, 5, 6)
) ticker_identifiers
on tickers.TICKER_NUMBER = ticker_identifiers.TICKER_NUMBER
order by tickers.TICKER_NUMBER, row_number_within_ticker
The last part of this script (see the excerpt below) is original code designed expressly for this tip. There are three actions implemented by the code.
- It begins by dropping any prior version of the ##nasdaq_tickers table.
- Next, it copies column values with NASDAQ ticker values from the #pivotsource table into the ##nasdaq_tickers table. As a result, the ##nasdaq_tickers table has all the ticker values from the NASDAQ site at the time the application runs.
- Finally, the code illustrates how to use the xp_cmdshell extended stored procedure and the bcp command to copy ##nasdaq_tickers table contents to the nasdaq_tickers.txt file in the c:\python_programs path.
 -- filter #pivotsource to extract just
-- nasdaq ticker values into ##nasdaq_tickers
if exists (
 select * from tempdb.dbo.sysobjects o
 where o.xtype in ('U')
 and o.id = object_id(N'tempdb..##nasdaq_tickers')
)
BEGIN
  drop table ##nasdaq_tickers;
END
-- save ticker_value from #pivotsource in ##nasdaq_tickers
select ticker_value into ##nasdaq_tickers from #pivotsource where ticker_ids = 'TICKER'
-- enable the xp_cmdshell stored procedure
EXEC sp_configure 'xp_cmdshell', 1
RECONFIGURE
-- write a text file with the ticker symbols
-- for use by read_all_nasdaq_tickers_from_2014_and_download_stock_prices_with_try_catch_any.py
EXEC master..xp_cmdshell
 'bcp "select ticker_value from ##nasdaq_tickers" queryout c:\python_programs\nasdaq_tickers.txt -c -T'
-- disable the xp_cmdshell stored procedure
EXEC sp_configure 'xp_cmdshell', 0
RECONFIGURE
GO
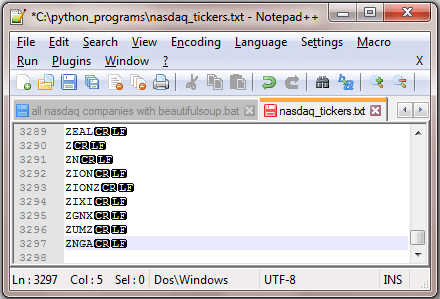
As of the time the save Nasdaq tickers to a file.sql file was run for this tip, there were 3297 NASDAQ ticker values in the source HTML table within the nasdaq.com site. The following two screen shots show the first ten ticker values and the last nine ticker values in the nasdaq_tickers.txt file as viewed by the Notepad++ application; this application is a text file viewer/editor. The line numbers are not part of the file. Another Python script file can read this file to retrieve historical price and volume data from Yahoo Finance for all NASDAQ ticker values.

Downloading from Yahoo Finance historical price and volume data for all NASDAQ tickers
The process for downloading historical price and volume data from Yahoo Finance to a SQL Server table builds on this prior tip. The prior tip demonstrated how to download historical price data for 150 stock ticker values that were hand selected from a list of popular stocks. This tip extends the prior tip in three ways.
- First, it gets both historical price and volume data. The prior tip only demonstrated how to download historical price data.
- Second, this tip gets data for all NASDAQ-traded stocks for which Yahoo finance has price and volume data. This represents over a twenty-fold increase in the number to ticker values for which data is downloaded. In fact, there are over 2.6 million rows of price and volume data in the final set of downloaded data for this tip.
- A subsequent section explores minor inconsistencies for the availability of ticker symbols between nasdaq.com and Yahoo Finance. The prior tip did not compare ticker values from Yahoo Finance with those from a major stock exchange, such as the NASDAQ exchange.
As in the process for downloading all NASDAQ tickers, the process for downloading historical price and volume data depends on three script files.
- The read_all_nasdaq_tickers_from_2014_and_download_stock_prices_with_try_catch_any.py file contains a Python script for downloading price and volume data from Yahoo Finance. As mentioned, this script draws heavily from one in a prior tip. However, there are also four modifications.
- The most significant change for overall operation is the source of ticker values. For prior tip, the source consisted of 150 ticker values that were all known to be in Yahoo Finance. The requirement for this tip’s ticker list is that it contains all ticker values in a specified HTML table at the NASDAQ site. This HTML table contains company information for all NASDAQ-listed stocks. The new ticker list is over twenty times larger with a total count of 3,297. About one percent of these 3,297 tickers were not found in Yahoo finance.
- The Python script for this tip was updated to select ticker values from the nasdaq_tickers.txt file, which includes all ticker values from the HTML table at the NASDAQ website with information about all NASDAQ-listed companies.
- Partly in response to the twenty-fold increase in the number ticker values for which historical data were retrieved, the starting date was changed from the beginning of 2007 in the prior tip to the beginning of 2014 in this tip. This modification allowed the process to collect less data and consequently to reduce its run time.
- Because the prior tip with 150 ticker values included only ticker symbols that were known to also be in Yahoo Finance, the script in that tip never had to deal with ticker values that were missing from Yahoo Finance. However, the current tip has an input file where ticker values are not pre-screened to exclude any ticker symbols that are missing from Yahoo Finance. When Yahoo Finance did not return a dataset in response to the history for a ticker value, the solution was to try again as many times as necessary until Yahoo Finance served the requested data. The Python script for this tip was modified to distinguish between
- trying again as many times as necessary if the historical data are not available after the first try and
- bypassing an infinite loop of re-tries if a ticker value from the NASDAQ website is missing from Yahoo Finance after a reasonable number of tries
- The read_all_nasdaq_tickers_from_2014_and_download_stock_prices_with_try_catch_any.bat is wrapper code for running the read_all_nasdaq_tickers_from_2014_and_download_stock_prices_with_try_catch_any.py file in a DOS command window. This bat file has two commands, which perform the usual functions for a Windows batch file used to invoke a Python script file.
- It changes the current directory to the one where the Python interpreter (python.exe) resides.
- Then, it runs the Python script file (read_all_nasdaq_tickers_from_2014_and_download_stock_prices_with_try_catch_any.py) with the Python interpreter while returning output from the Python script to the DOS command window.
- The read_all_nasdaq_ticker_historical_prices_and_volumes.sql file contains a T-SQL script. There are two key steps to the T-SQL script.
- It invokes the xp_cmdshell extended stored procedure to collect the raw output from the read_all_nasdaq_tickers_from_2014_and_download_stock_prices_with_try_catch_any.bat file. The raw output values are saved in the #Result table.
- Next, it processes the raw output in the #Result table to populate a new SQL Server table named ##Results_with_extracted_casted_values. This table contains seven columns with a row for each NASDAQ ticker and distinct date combination. An eighth column includes the original raw output from the batch file that runs the Python script. This eighth column is to facilitate validating the extracted, casted key column values from the raw output in the #Result table. The seven key columns are:
- date
- symbol (for ticker value)
- open price
- high price
- low price
- close price
- volume
- The prior tip printed the volume of shares traded for each of its 150 ticker values in the Python script, but the prior tip did not show how to extract and cast volume values as does the T-SQL script in this tip.
The following code listing is for the read_all_nasdaq_tickers_from_2014_and_download_stock_prices_with_try_catch_any.py file. This file contains the Python script for reading historical price and volume data from Yahoo Finance for all NASDAQ ticker values. This script builds on a similar Python script described in the prior tip on collecting historical data for a smaller pre-screened set of ticker values. Therefore, you can gain a base understanding of the code from the A Python script for collecting historical prices for many tickers from Yahoo Finance section in the prior tip. The script discussion here focuses on code changes made to accommodate the special requirements of this tip.
In the third segment within the following script, the code populates a Python symbol list object with entries from the nasdaq_tickers.txt file in the c:\python_programs folder. As you can see from the first pair of screen shots in this tip, there are a total of 3,297 ticker symbols in this file. The prior tip presenting similar code for reading historical data from Yahoo Finance relied on one of two different files as sources for populating the symbol list object. One of these files contained 150 ticker values, and the other file contained just 20 ticker values.
The fourth segment within the following script designates January 1, 2014 as the start date from which to start collecting historical data from Yahoo Finance. In the prior tip on collecting historical data from Yahoo Finance, the starting date was set to January 1, 2007 – seven years earlier. Even though the prior tip returned historical data for seven more years, the final result set contained less than 360,000 rows. On the other hand, the final result set for this tip contained over 2.6 million rows. This vast disparity, which is caused by the huge count of ticker symbols in this tip versus the prior tip, resulted in a run time of about 45 minutes for this tip versus less than 10 minutes for the prior tip. As you add more ticker values, for example by including ticker symbols from other exchanges besides NASDAQ, or you lengthen the period for which historical data is gathered, it will become desirable to develop methods of scheduling runs during off-peak usage times and/or run pulls of different sets of historical data to operate concurrently.
Perhaps the most significant change from a coding perspective was the revision to accommodate ticker values that were in the nasdaq_tickers.txt file but not present in the historical data from Yahoo Finance. The prior tip noted that using a ticker value that was missing from Yahoo Finance would cause the original code in the final segment for the prior tip to go into an infinite loop. The tip described how to avoid this outcome by excluding any ticker value which was not already in the Yahoo Finance historical database.
For the current tip, it was inconvenient to test whether individual ticker values were missing from Yahoo Finance because running the full set of NASDAQ ticker values took so long and over 30 ticker values were ultimately found that existed at nasdaq.com but not at Yahoo Finance with historical data. These missing ticker values from Yahoo Finance with historical data required a dynamic solution for ignoring selected ticker values if no historical data was found in Yahoo Finance after a reasonable number of tries to retrieve historical data.
From repeated observations in developing the prior tip, it was discovered that there were never more than three re-tries required to ultimately retrieve the historical data for a ticker value if historical data for the ticker value did exist at Yahoo Finance. As a result, a new counter was introduced in the code in this tip to count the number of re-tries for the current attempt to retrieve historical data for a ticker value. When the count of re-tries exceeded ten for a ticker value, the code ceased trying to retrieve historical data for the ticker value.
- The variable named j counts the number of re-tries for a ticker
- If the number of re-tries for a ticker is less than or equal to ten and the current try did not return a dataset from Yahoo Finance, then control passes to a continue statement to launch another try to collect historical data for a ticker value
- Else if the number of re-tries is greater than ten and the current try did not return a dataset from Yahoo Finance,
- a Print command prints the ticker value for which no match is found in Yahoo Finance
- control flows to a pass statement, which leads to
- the re-try index variable, j, being reset to 0
- and symbol index variable, i, gets incremented by one
 #settings to dynamically display all rows and columns
#in a single tabular display of the dataframe
import pandas as pd
pd.set_option('display.max_rows', None)
pd.set_option('expand_frame_repr', False)
#settings for importing built-in datetime and date libraries
#and external pandas_datareader libraries
import datetime
from datetime import date
import pandas_datareader.data as web
#read symbols from the nasdaq_tickers.txt file to a python list
symbol = []
with open('c:/python_programs/nasdaq_tickers.txt') as f:
    for line in f:
        symbol.append(line.strip())
f.close
#setting for start and end dates
#you can designate a specific date
#such as 2014, 1, 1
#or a relative date such as today less 5 days
start = datetime.date(2014, 1, 1)
#start = date(date.today().year, date.today().month, date.today().day-5)
end = datetime.date.today()
#iterate over ticker symbol values
#with while for retrieving historical and
#displaying stock prices
#try code and catch any exception
#try again (continue) after catch
i=0  # for iterating through tickers
j=0  # for iterating through tries for a ticker
while i
The read_all_nasdaq_tickers_from_2014_and_download_stock_prices_with_try_catch_any.bat file has just two commands which appear below. The first command changes the current directory to the path where the python interpreter resides. The second command uses the Python interpreter to invoke the Python script for retrieving historical data for a set of ticker values. This code returns all historical data for the ticker values in a Windows command shell.
cd C:\Program Files\Python36python.exe "C:\python_programs\read_all_nasdaq_tickers_from_2014_and_download_stock_prices_with_try_catch_any.py"
The third script file in this portion of the solution has the name read_all_nasdaq_ticker_historical_prices_and_volumes.sql. This file contains a T-SQL script that you can run from SQL Server Management Studio. This script has just two segments.
The script for the first segment appears below. If you compare this first T-SQL script segment for getting historical data to the first T-SQL script segment for getting all NASDAQ tickers, you will notice that both code samples are nearly the same. The purpose of the first segment in this section is to run the read_all_nasdaq_tickers_from_2014_and_download_stock_prices_with_try_catch_any.bat file and deposit the raw output from the batch file in the #Result table. It achieves this goal by invoking the xp_cmdshell extended stored procedure for the batch file.
 -- enable the xp_cmdshell stored procedure
EXEC sp_configure 'xp_cmdshell', 1
RECONFIGURE
--------------------------------------------------------------------------------------
-- create a fresh temp table (#Result) for storing unprocessed result set from
-- running xp_cmdshell for Windows batch that invokes
-- python script
if exists (
 select * from tempdb.dbo.sysobjects o
 where o.xtype in ('U')
 and o.id = object_id(N'tempdb..#Result')
)
BEGIN
  DROP TABLE #Result;
END
CREATE TABLE #Result
(
  line varchar(500)
)
--------------------------------------------------------------------------------------
-- insert python script output into #Result temp table
INSERT #Result exec xp_cmdshell 'C:\python_programs\"read_all_nasdaq_tickers_from_2014_and_download_stock_prices_with_try_catch_any.bat"'
--------------------------------------------------------------------------------------
-- disable the xp_cmdshell stored procedure
EXEC sp_configure 'xp_cmdshell', 0
RECONFIGURE
GO
The second segment of the T-SQL file appears next. This block of code changed more than the preceding segment, which merely transferred the contents of a Windows command shell to a SQL Server table (#Result). The second segment demonstrates how to parse and save into a new table (##Results_with_extracted_casted_values) extracted, casted historical values from the raw output in the rows of the #Result table. A new column for volume data was extracted in this tip, and the casting technique for columns was also revised slightly from the prior tip. Because of the scope of these modifications, the second segment’s code is described as if it were completely new for this tip.
- The script starts by dropping any prior version of the ##Results_with_extracted_casted_values table
- Then, a series of six nested sub-queries successively pass their result sets through to one another and ultimately an outer query
- The nested sub-query names from inner-most to outer-most are
- extract_date_and_symbol
- params_for_open
- params_for_high
- params_for_low
- params_for_close
- param_for_volume
- The extract_date_and_symbol sub-query
- derives its source from #Result table rows
- extracts the date and symbol values from the #Result table rows and casts them, respectively, as date and varchar data types
- adds the original #Result table row value for further processing by subsequent sub-queries
- excludes from its result set #Result table rows without a starting date value and a subsequent symbol value
- The params_for_open sub-query
- derives its source from the extract_date_and_symbol sub-query result set, which includes the date, symbol, and an original raw line value from the #Result table; note from the code segment above that the #Result table has a single column named line
- computes starting (open_1) and ending (open_plus_1) position values for the open price value on a row
- The params_for_high sub-query
- derives its source from the params_for_open sub-query result set
- computes the open price value from its starting and ending position and adds it to its result set along with its source column values
- computes starting (high_1) and ending (high_plus_1) position values for the high price value on a row
- The params_for_low sub-query
- derives its source from the params_for_high sub-query result set
- computes the high price value from its starting and ending position and adds it to its result set along with its source column values
- computes starting (low_1) and ending (low_plus_1) position values for the low price value on a row
- The params_for_close sub-query
- derives its source from the params_for_low sub-query result set
- computes the low price value from its starting and ending position and adds it to its result set along with its source column values
- computes starting (close_1) and ending (close_plus_1) position values for the close price value on a row
- The param_for_volume sub-query
- derives its source from the params_for_close sub-query result set
- computes the close price value from its starting and ending position values and adds it to its result set along with its source column values
- computes a starting (volume_1) position value for the volume value on a row; the ending position is implicitly the end of the line column value because volume is the last value on a row in the #Result table
- The outer query
- casts the four prices (open, high, low, and close) as money values after transforming them to float values; Yahoo Finance uses float values for representing historical price values
- computes the volume value from its starting and implicit ending position before converting it to a float value that is transformed to an int value; Yahoo Finance sometimes represents volume values with a decimal point although volume values are whole share numbers
- the original row value from the source #Result table is returned to facilitate validating the extracted, casted values displayed in the ##Results_with_extracted_casted_values
 -- extract and cast stock open, high, low, close prices
-- and volume for all nasdaq tickers
begin try
drop table ##Results_with_extracted_casted_values
end try
begin catch
print '##Results_with_extracted_casted_values was not deleted'
end catch
-- cast open, high, low, close as money
-- extract volume and cast as int
-- retain line value for rows to validate data
select
 date
,symbol
,cast(cast([open] as float) as money) [open]
,cast(cast(high as float) as money) high
,cast(cast(low as float) as money) low
,cast(cast([close] as float) as money) [close]
,cast(cast(substring(line,volume_1,500) as float) as int) volume
,line
into ##Results_with_extracted_casted_values
from
(
-- extract close and add to date, symbol, open, high, low
-- get parameter for extracting volume
select
 date
,symbol
,[open]
,high
,low
,substring(line, close_1, close_plus_1 - close_1) [close]
,close_plus_1
,close_plus_1
 +patindex('%[0-9]%',substring(line,close_plus_1,500))-1 [volume_1]
,line
from
(
-- extract low and add to date, symbol, open, high
-- get parameters for extracting close
select
 date
,symbol
,[open]
,high
,substring(line,low_1,low_plus_1 - low_1) low
,low_plus_1
 +
 patindex('%[0-9]%',substring(line,low_plus_1,500))
 -1
 close_1
,charindex
 (
 ' '
 ,line
 ,low_plus_1
 +
 patindex('%[0-9]%',substring(line,low_plus_1,500))
 -1
 ) close_plus_1
,low_plus_1
,line
from
(
-- extract high and add to date, symbol, open
-- get parameters for extracting low
select
 date
,symbol
,[open]
,substring(line,high_1,high_plus_1 - high_1) high
,
 high_plus_1
 +
 patindex('%[0-9]%',substring(line,high_plus_1,500))
 -1
 low_1
,
 charindex
 (
 ' '
 ,line
 ,high_plus_1
 +
 patindex('%[0-9]%',substring(line,high_plus_1,500))
 -1
 ) low_plus_1
,line
from
(
-- extract open and add to date, symbol
-- get parameters for extracting high
select
 date
,symbol
,substring(line,open_1,open_plus_1-open_1) [open]
,
 open_plus_1
 +
 patindex('%[0-9]%',substring(line,open_plus_1,500))
 -1
 high_1
,charindex
 (
 ' '
 ,line
 ,
 open_plus_1
 +
 patindex('%[0-9]%',substring(line,open_plus_1,500))
 -1
 ) high_plus_1
,line
from
(
-- get parameters for extracting open
select
 date
,symbol
,charindex(' ',line, patindex('%[A-Z]%',line))
  +
  patindex('%[0-9]%',substring(line,charindex(' ',line, patindex('%[A-Z]%',line)),500))
  -1 [open_1]
,
 charindex
 (
 ' '
 ,line
 ,
 (
 charindex(' ',line, patindex('%[A-Z]%',line))
  +
  patindex('%[0-9]%',substring(line,charindex(' ',line, patindex('%[A-Z]%',line)),500))
  -1 )
 ) open_plus_1
,line
from
(
-- get date and symbol for returned data
select
 cast(substring(line,1,10) as date) [date]
,cast
 (
 substring
 (
 line,patindex('%[A-Z]%',line),charindex(' ',line, patindex('%[A-Z]%',line)) - patindex('%[A-Z]%',line
 )
 )
 as varchar(10)) [symbol]
,line
from #Result
where
isdate(substring(line,1,10)) = 1   -- line must start with a date
and patindex('%[A-Z]%',line) > 0   -- line must have a symbol value
and line not like '%Nan%'          -- no NaN line value
) extract_date_and_symbol
) params_for_open
) params_for_high
) params_for_low
) params_for_close
) param_for_volume
order by symbol, date
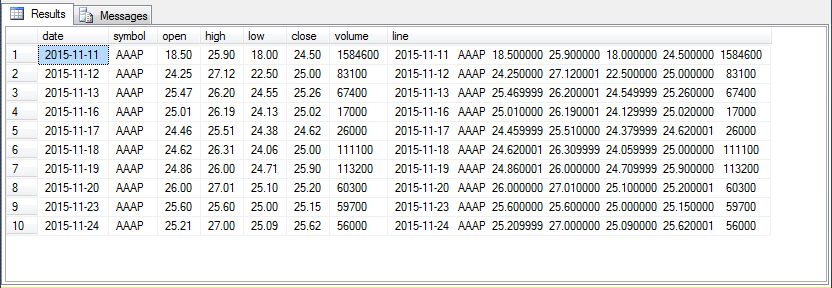
To help you verify the output in your own tests for the code, the first ten rows from the sorted outer query’s result set (select top 10 * from ##Results_with_extracted_casted_values order by symbol, date) are listed below. The first seven columns contain extracted values for the raw output values from the Python script that appears in the eighth column. While the data for any ticker value can start as early as the first trading date in 2014, the AAAP ticker shares were not initially offered for sale until November 11, 2015, and historical data for the AAAP ticker therefore commences on this date.
Ticker value data issues between nasdaq.com and Yahoo Finance
The ticker values for end-of-day historical data from the NASDAQ website may not correspond exactly to a batch of ticker values reported by the Yahoo Finance website. These two websites are independently managed, and the cycle for updates is not necessarily the same at nasdaq.com as at Yahoo Finance. Furthermore, it is known that Yahoo Finance and Google Finance do not obtain their historical prices for NASDAQ-listed stocks directly from NASDAQ The following script gets all the distinct ticker values from the ##Results_with_extracted_casted_values table and saves them in the ##Results_with_extracted_casted_values_distinct_symbol table. The next query uses a T-SQL intersect set operator to compare the ticker values in the ##nasdaq_tickers table (from the nasdaq.com website) versus those in the ##Results_with_extracted_casted_values_distinct_symbol table (from the Yahoo Finance website). The initial comment line indicates there are only 3263 ticker values that are the same between the two sources. However, the queries of the individual sources indicate that there are 3297 ticker values in the ##nasdaq_tickers table, but only 3266 ticker values in the ##Results_with_extracted_casted_values_distinct_symbol table. The fact that the number of ticker values at the intersect between the two sources is different than the number of ticker values in either source indicates source has ticker values overlapping with the other source as well as ticker values that do not overlap with the other source. The following query below uses a T-SQL except set operator to discover the ticker values in the ##nasdaq_tickers table versus those not in the ##Results_with_extracted_casted_values_distinct_symbol table. This query confirms there are 34 ticker values that are in the ##nasdaq_tickers table that are missing from the ##Results_with_extracted_casted_values_distinct_symbol table. If you run the query, you can examine the result set to discover precisely which ticker values are in the ##nasdaq_tickers table but missing from the ##Results_with_extracted_casted_values_distinct_symbol table. If you reflect on these outcomes, you may easily decide other comparisons merit investigation. However, these investigations are beyond the scope of this tip. In summary, are the tickers from each data source 99 percent the same or 1 percent different or does it matter? The answer probably depends on the purposes for which you are deriving the historical values. If your requirements dictate the need, you can use queries like those shown in this section to examine the nature of the differences between sources. Next Steps Rick Dobson is a SQL Server professional with decades of T-SQL experience that includes authoring books, running a national seminar practice, working for businesses on finance and healthcare development projects, and serving as a regular contributor to MSSQLTips.com. He has been a practicing Python developer for more than the past half decade – with a special emphasis for data visualization and ETL tasks with JSON and CSV files. His most recent professional passions include financial time series data and analyses, AI models, and statistics. If you are interested in growing your skills in any of these areas especially as they relate to financial securities, consider visiting his blog at https://securitytradinganalytics.blogspot.com/2023/12/. -- distinct ticker values from Yahoo Finance historical data
select distinct symbol
into ##Results_with_extracted_casted_values_distinct_symbol
from ##Results_with_extracted_casted_values
 -- 3263 ticker values are in both ##nasdaq_tickers and ##Results_with_extracted_casted_values_distinct_symbol
-- 3297
select * from ##nasdaq_tickers
intersect
-- 3266
select symbol from ##Results_with_extracted_casted_values_distinct_symbol
 -- 34 ticker values from ##nasdaq_tickers are not in Yahoo ticker values
-- 3297
select * from ##nasdaq_tickers
except
-- 3266
select symbol from ##Results_with_extracted_casted_values_distinct_symbol


