Problem
I work for a brokerage firm that wants to enlarge stock price analytics support for its clients. The MACD (Moving Average Convergence/Divergence) indicators are widely regarded as a rich stock price analytics tool, and I seek some help on how to compute and use the MACD indicators for stocks that my firm tracks in its SQL Server database.
Solution
The MACD indicators can be used for modeling trend and momentum for stock prices, such as end-of-day close prices. Instead of analyzing stock prices directly, the main MACD indicator compares a short-term moving average to a long-term moving average.
- When the short-term moving average starts moving up faster than the long-term moving average, a stock exhibits positive momentum. Presuming the positive momentum continues, it is common to believe that the first date on which the short-term moving average exceeds the long-term moving average indicates a good time to acquire a stock for continued appreciation.
- As short-term moving average increases begin to subside or even reverse relative to long-term trends, this can indicate a good time to sell a stock to capture any accumulated gains.
Moving averages are a data science technique for smoothing out time series data and minimizing the impact of random variation between periods in time series data. Prior MSSQLTips.com tips review and demonstrate computational rules for computing two different types of moving averages. This simple arithmetic average tip illustrates how easy it is to compute and understand this way of smoothing time series data. This exponential moving average tip explains and demonstrates the recursive calculations necessary for smoothing time series data this way. Additionally, the second tip confirms that exponential moving averages more tightly fit changes in time series data than simple arithmetic moving averages. The exponential moving average tip also presents T-SQL code for computing exponential moving averages of any period length. Knowing how to compute exponential moving averages is also important because the MACD indicators depend on this type of moving average.
The main MACD indicator is based on differences between exponential moving averages with different period lengths for modeling short-term trends versus long-term trends. Additionally, another MACD indicator smooths the differences between the short-term and long-term moving averages. The period for this second round of smoothing is typically shorter than the one for the short-term period for the main MACD indicator. Because there is some flexibility in how exponential smoothing is calculated by different references, we remind you that the approach taken here follows the conventions described in this prior MSSQLTips.com tip.
What Is the computational logic for the MACD indicators?
The three MACD indicators are widely described across the internet. In my opinion, two of the best reviews describing the logic for computing MACD indicators and ways of interpreting the indicators are available here and here.
The main MACD indicator is often called the MACD line. This line is most commonly computed as the 12-day moving average less the 26-day moving average for a stock’s close price time series. The 12-day moving average represents the short-term trend, and the 26-day moving average represents the long-term trend.
- When the 12-day moving average starts to rise above the 26-day moving average, the recent price trend is increasing more rapidly than the long-term price trend. This event indicates a buy signal unless the condition reverses within a short number of periods or the size of the 12-day moving average above the 26-day moving average never grows in a meaningful way.
- In a contrary manner, when the 12-day moving average begins falling towards and/or below the 26-day moving average, you have a basis for a sell signal. In any event, a 12-day moving average below the 26-day moving average is definitely a signal not to buy a stock because short-term prices are on a downward trajectory relative to long-term price trends.
The MACD line has a centerline value of zero when the short-term moving average exactly equals the long-term moving average. In a sense, this centerline serves as a “cross-over” point. When the MACD line crosses from below to above the centerline, positive momentum is building. Likewise, negative momentum builds as the MACD line moves from above to below its centerline value.
The period lengths for the short-term and long-tern trends are not immutably set as 12 for short term and 26 for long term, and the period duration is not necessarily for a day. Nevertheless, you will find the technical analysis literature overwhelming uses these two period lengths – especially for daily stock trading. For those doing day-trading (that is, trading within a day), shorter period durations, such as 5 to 30 minutes, are likely to be preferred. Additionally, day traders may care to adjust the number of periods for short-term and long-term periods to reflect the duration of the period that they use for tracking stock prices. Those who view themselves as taking a longer-term view about stock investing may find that a period duration of a week or a month is more suited to their needs than the widely used period of a day.
Another MACD indicator is often called the Signal line or Trigger line. This line is frequently computed with a 9-day exponential moving average for the values in the MACD line. Because the Signal line is a moving average of the MACD line, the Signal line trails the MACD line. Therefore, positive momentum is indicated when the MACD line crosses above the Signal line. Similarly, negative momentum is indicated when the MACD line falls below the Signal line. It is not unusual for there to be multiple Signal line crosses between a pair of centerline crosses for the MACD line.
The third MACD indicator is called the MACD histogram because its values are often plotted as histogram bars around the centerline for the MACD line. This third indicator is computed as the MACD line less the Signal line for a period.
A T-SQL script for demonstrating how to compute MACD indicators
The script in this section demonstrates how to compute the MACD indicators for a stock represented by a ticker symbol. The script has two major parts.
- Its first code block computes the 12-period and 26-period moving averages for close price values; the assignment of a ticker symbol to the @symbol local variable in a declare statement designates for which stock the exponential moving averages are computed.
- In the second code block, the MACD indicators are computed via a set of nested queries.
- The innermost query computes the MACD line values as the 12-period moving average less the 26-period moving average.
- The query immediately outside the innermost query computes the Signal line based on a 9-period exponential moving average of the MACD line values.
- The outermost query computes each period’s MACD_histogram value as the difference between the MACD line value less the Signal line value.
The first block of code begins at a USE statement and terminates at a select statement preceded by a comment with the text: “display selected ewma_12 and ewma_26 results”.
- The USE statement references the AllNasdaqTickerPricesfrom2014into2017 database.
- This database contains end-of-day historical prices and volumes for all NASDAQ stock tickers with historical data in the Yahoo Finance site.
- Historical data are available from as soon as the first trading day in 2014 through as late as November 8, 2017. The exact range of historical data can vary from one ticker symbol to another based on the historical data available from Yahoo Finance at the time the historical data were downloaded.
- You can download a backup file for the database in the “Next Steps” section from this prior tip. Then, just restore the database on the computer from which you are running SQL Server to gain access to the underlying source data from which this tip demonstrates how to compute MACD indicators.
- The rest of the first block of code computes the 12-period and 26-period moving averages.
- The code populates the #temp_for_ewma temporary table in two separate steps. These steps are modeled after code for the 10-period and 30-period exponential moving averages described in detail within a prior tip.
- The first step initializes the temporary table with some prime values that serve as a basis for the recursive calculations necessary to compute the exponential moving averages.
- The second step takes another pass through the rows of the primed temporary table to recursively populate the table with exponential moving averages for successive periods.
- Because the code directly uses the exponential moving averages stored in the #temp_for_ewma temporary table as the basis for computing the MACD indicators, it is not necessary to display them. However, the first five rows of the table are displayed via a select statement at the end of the first section for tutorial purposes. These results are examined after reviewing the second block of code for generating MACD indicators.
The second block of code begins immediately after the final select statement in the first code block. This second code block populates the #for_sums_counts_by_macd temporary table with the MACD indicator values. This second temporary table has its name because the MACD indicator values are processed for another purpose in additional code shown in the next section.
Recall that three nested queries are used to compute the MACD indicators. These nested queries initially rely on values computed in the #temp_for_ewma temporary table computed by the first code block. A nesting query approach is particularly appropriate for the MACD indicators because the indicators rely successively on one another.
- The MACD line indicator is a root indicator for the other two MACD indicators. Therefore, the MACD line indicator is computed in the innermost query (for_signal) based on exponential moving average values within the #temp_for_ewma temporary table. Recall that MACD line values are the 12-period exponential moving average (ewma_12) less the 26-period moving average (ewma_26). Because of the algorithm for computing exponential moving averages, there is no MACD line indicator value for the first date.
- The second query has the name for_macd_histogram. This query actually computes the Signal line indicator values as a 9-period exponential moving average based on the MACD line values. In this case, because of the algorithm for computing exponential moving averages and the successively reliant process for computing MACD indicators, there is no Signal line value for either the first or second periods in the time series.
- The outermost query builds on values from the two queries within it. This outermost query computes the MACD_histogram indicator value for successive periods as the difference between the MACD line value less the Signal line value.
- The MACD line value is derived from the for_signal query.
- The Signal line value is derived from the for_macd_histogram query.
A select statement at the end of the second code block lists the first five rows from the #for_sums_counts_by_macd temporary table. This tip next examines the result sets from the select statements at the end of the first and second code blocks to reinforce your understanding of how to compute MACD indicator values.
 USE AllNasdaqTickerPricesfrom2014into2017
GO
-- use this segment of the script to set up for calculating
-- ewma_12 and ewma_26 for ticker symbol
-- initially populate #temp_for_ewma for ewma calculations
-- @ewma_first is the seed
declare @symbol varchar(5) = 'MSFT'
declare @ewma_first money =
(select top 1 [close] from Results_with_extracted_casted_values where symbol = @symbol order by [date])

-- create base table for ewma calculations
begin try
drop table #temp_for_ewma
end try
begin catch
print '#temp_for_ewma not available to drop'
end catch
-- ewma seed run
select
 [date]
,[symbol]
,[close]
,row_number() OVER (ORDER BY [Date]) [row_number]
,@ewma_first ewma_12
,@ewma_first ewma_26
into #temp_for_ewma
from Results_with_extracted_casted_values
where symbol = @symbol
order by row_number
-- NULL ewma values for first period
update #temp_for_ewma
set
 ewma_12 = NULL
   ,ewma_26 = NULL
where row_number = 1
-- calculate ewma_12 and ewma_26
-- @ew_12 is the exponential weight for 10-period
-- @ew_26 is the exponential weight for 30-period
-- start calculations with the 3rd period value
-- seed is close from 1st period; it is used as ewma for 2nd period
declare @max_row_number int = (select max(row_number) from #temp_for_ewma)
declare @current_row_number int = 3
declare @ew_12 real = 2.0/(12.0 + 1), @today_ewma_12 real
declare @ew_26 real = 2.0/(26.0 + 1), @today_ewma_26 real
while @current_row_number <= @max_row_number
begin
 set @today_ewma_12 =
 (
 -- compute ewma_12 for period 3
 select
 top 1
 ([close] * @ew_12) + (lag(ewma_12,1) over (order by [date]) * (1 - @ew_12)) ewma_12_today
 from #temp_for_ewma
 where row_number >=  @current_row_number -1 and row_number <=  @current_row_number
 order by row_number desc
 )
 set @today_ewma_26 =
 (
 -- compute ewma_26 for period 3
 select
 top 1
 ([close] * @ew_26) + (lag(ewma_26,1) over (order by [date]) * (1 - @ew_26)) ewma_26_today
 from #temp_for_ewma
 where row_number >=  @current_row_number - 1 and row_number <=  @current_row_number
 order by row_number desc
 )

 update #temp_for_ewma
 set
  ewma_12 = @today_ewma_12
    ,ewma_26 = @today_ewma_26
 where row_number =  @current_row_number
 set @current_row_number =  @current_row_number + 1
end
-- display selected ewma_12 and ewma_26 results
select * from #temp_for_ewma where row_number <= 5 order by row_number
-- nested queries for macd, signal
-- and macd_histogram
begin try
drop table #for_sums_counts_by_macd
end try
begin catch
print '#for_sums_counts_by_macd not available to drop'
end catch
-- in the outer query, compute macd_histogram as
-- macd less signal
select
*
,macd-signal macd_histogram
into #for_sums_counts_by_macd
from
(
-- next, compute signal as ewma_9 of macd
select
*
,
case
when row_number <= 2 then NULL
when row_number = 3 then 0
when row_number >3 then
cast(
((2/(9.0+1))*macd) + ((1-(2/(9.0+1)))*lag(macd,1) over (order by [row_number]))
as money)
end signal
from
(
-- first, compute macd as ewma_12 less ewma_26
select
 [date]
,symbol
,[close]
,[row_number]
,[ewma_12]
,[ewma_26]
,[ewma_12]-[ewma_26] macd
from #temp_for_ewma
where row_number < = @max_row_number
) for_signal
) for_macd_histogram
order by row_number
-- display selected input and output values for macd indicators
select * from #for_sums_counts_by_macd where row_number <= 5
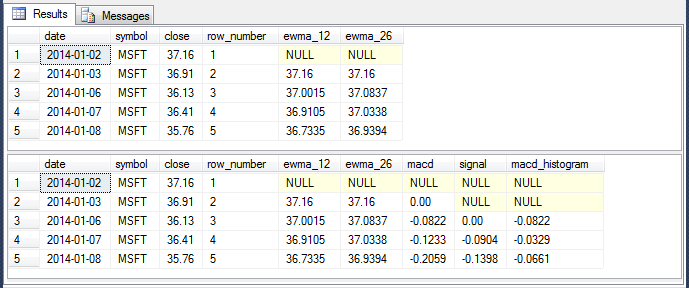
The following screen shot shows the output from the two select statements displaying output from the preceding script.
The first result set in the Results pane shows the 12-period (ewma_12) and 26-period (ewma_26) moving average values for the first five rows from the first select statement. The exponential moving average algorithm used for computing these results are from a prior MSSQLTips.com tip. You are reminded that there are slight variations for the computations between different authors. The exponential moving average algorithm used here has the following specifications.
- The first row in a time series of exponential moving averages is always a NULL value.
- The second row derives its value from the initial row value in the underlying time series; in this case these are historical close prices for Microsoft Corporation, which has a MSFT ticker value.
- The exponential moving average value for the third and subsequent rows is based on the sum of two values.
- The first value is the product of a smoothing constant times the underlying time series value for the current row.
- The second value is the product of one minus the smoothing constant times the exponential moving average from the preceding row.
- The exponential smoothing constant is derived from this expression: 2.0/(N + 1) where N represents the number of periods for the exponential moving average. While N is conceptually an integer value, it is assigned a real data type. This assignment preserves values to the right of the decimal point for the computed smoothing constant value based on N. For example, the 12-period short-term moving average has its smoothing constant computed with this expression: 2.0/(12.0+1).
The second result set builds on the values created in the first result set to compute the three MACD indicators. The second result set is from the #for_sums_counts_by_macd temporary table, which is, in turn, dependent on the #temp_for_ewma temporary table.
- For example, the first six columns of the second result set come directly from the source for the first result set, which is the #temp_for_ewma temporary table.
- The three additional columns are the computed MACD indicators.
- The macd column values are MACD line values.
- The signal column values are Signal line values.
- The macd_histogram column values are MACD histogram values.
- You can refer to the code in the preceding script to verify the expression used to populate each of the three MACD indicator columns. After you have verified the expression for each indicator column, you can reference the preceding section for an explanation of the rationale behind the expressions.
Are Positive MACD line values correlated with close price advances?
Now that you know how to compute MACD indicators, you may be curious about how to determine if any of the indicators are correlated with rising stock prices. For example, we know that a positive MACD line value indicates that the short-term moving average is above the long-term moving average. This should be correlated with stock price gains. Therefore, we can look to see if date ranges with positive MACD line values are also periods when stock prices generally rise. This section presents detailed price performance values over date ranges with positive MACD line values for one stock, and thIS section also examines comparable summary information for nine additional stocks as well.
Before digging into the details of the data, it is important to realize that the price of a stock does not ever increase indefinitely. I am guessing that this is not a surprise to you, but it is nevertheless a useful baseline fact on which to reflect. Recall that the centerline MACD line value is zero. Therefore, we can track prices for a stock when its MACD line value is greater than zero to see if postivie MACD line values are correlated with stock price gains. When the MACD line value is greater than zero, the stock’s close price should be rising generally because the short-term price trend is greater than the long-term price trend. Even in a date range of positive MACD line values, you can expect stock prices to rise and fall. For example, towards the end of a period of positive MACD line values, the MACD line falls toward its centerline value of zero. These falling MACD line values will typically be correlated with dropping stock prices.
We can start our investigation by examining a stock’s price change during date ranges when the MACD line values are continuously positive. If positive MACD line values are correlated overall with stock price advances, then date ranges when the MACD line value are positive should be associated with higher stock prices.
The following script searches the #for_sums_counts_by_macd temporary table generated in the preceding section to find date ranges where MACD line values are positive from a start date through an end date. The criteria for finding a date range is that the range must consist of two or more contiguous trading days with a start date and an end date. The end date requirement rules out date ranges that start a positive sequence of MACD line values before the end of the historical data but do not conclude a positive sequence of MACD line values before no more historical data is available.
This script below is designed to run immediately after the script in the preceding session as a single script. After the MACD indicators for a stock symbol are computed, the script populates the #start_end_dates_b4_odd_drop temporary table with all contiguous date ranges in which the MACD line values are either positive or not positive. Because the MACD line centerline value is zero, contiguous blocks of trading days regularly cross the centerline as stock price trends alternate between positive and negative directions.
- After initially populating the #start_end_dates_b4_odd_drop table, another code block removes any date range where the start date and end date are the same. This condition denotes a date range where MACD line value changes from the preceding date range – but just for a single date. A single-date block cannot have distinct start and end dates. Therefore, these date ranges are deleted so they are not in the analysis. In addition, the single-date blocks denote exceedingly transient trends (their change is just for a single period).
- Also, the script removes those date ranges that have a start date without a corresponding end date. These are date ranges for which the historical data run out before the MACD line value crosses the centerline to terminate a date range.
- Finally, the script removes all date ranges that are not for positive MACD line values. This is because this analysis restricts its focus to stock price changes during date ranges with positive MACD line values.
 -------------------------------------------------------------------------------------
-- analysis code starts here
-- get start and end dates for successive, alternating macd blocks
-- before removing a trailing start block with no matching end block
begin try
drop table #start_end_dates_b4_odd_drop
end try
begin catch
print '#start_end_dates_b4_odd_drop not available to drop'
end catch
-- find all starts and ends
select
*
into #start_end_dates_b4_odd_drop
from
(
select
[date]
,symbol
,[close]
,[row_number]
,macd
,lead(macd,1) over (order by row_number) next_macd
,sign(macd) sign_of_macd
,sign(lead(macd,1) over (order by row_number)) sign_of_next_macd
,sign(lag(macd,1) over (order by row_number)) sign_of_prior_macd
--,case when sign(macd) != sign(lead(macd,1) over (order by row_number)) then 'ne' end
,
case

 when row_number = 3
 and sign(macd) = 1 then 'start_pos'
 when sign(macd) = 1
 and sign(lag(macd,1) over (order by row_number)) = -1 then 'start_pos'
 when
 sign(macd) != sign(lead(macd,1) over (order by row_number))
 and sign(macd) = 1 then 'end_pos'
 when
 sign(macd) != sign(lead(macd,1) over (order by row_number))
 and sign(macd) != 1 then 'end_not_pos'
 when row_number = 3
 and sign(macd) = -1 then 'start_not_pos'

 when
 sign(macd) != 1
 and sign(macd) = sign(lead(macd,1) over (order by row_number))
 and sign(lead(macd,1) over (order by row_number)) != 1
 and sign(lag(macd,1) over (order by row_number)) = 1 then 'start_not_pos'
 else NULL
end macd_pos_not_pos
from #for_sums_counts_by_macd
where
row_number > = 3
) for_is_not_start_or_end
where macd_pos_not_pos is not null
-- delete row with start_or_end equal to prior_start_or_end
-- gets rid of rows not continued with another matching pos or not pos_row
begin try
drop table #start_end_dates_b4_odd_drop_with_start_or_end
end try
begin catch
print '#start_end_dates_b4_odd_drop_with_start_or_end not available to drop'
end catch
-- add start_or_end and prior_start_or_end columns
-- to #start_end_dates_b4_odd_drop_with_start_or_end
-- from #start_end_dates_b4_odd_drop
select
*
,
case
 when left(macd_pos_not_pos,5) = 'start' then 'start'
 when left(macd_pos_not_pos,3) = 'end' then 'end'
end start_or_end
,
case
 when left(lag(macd_pos_not_pos,1) over(order by row_number),5) = 'start' then 'start'
 when left(lag(macd_pos_not_pos,1) over (order by row_number),3) = 'end' then 'end'
end prior_start_or_end
into #start_end_dates_b4_odd_drop_with_start_or_end
from #start_end_dates_b4_odd_drop

delete from #start_end_dates_b4_odd_drop_with_start_or_end where start_or_end = prior_start_or_end
-- restore #start_end_dates_b4_odd_drop columns
-- after fix for contiguous duplicate start_or_end values
-- where start and end dates are the same
GO
begin try
drop table #start_end_dates_b4_odd_drop
end try
begin catch
print '#start_end_dates_b4_odd_drop not available to drop'
end catch
select
 [date]
,symbol
,[close]
,[row_number]
,macd
,next_macd
,sign_of_macd
,sign_of_next_macd
,sign_of_prior_macd
,macd_pos_not_pos
into #start_end_dates_b4_odd_drop
from #start_end_dates_b4_odd_drop_with_start_or_end
-- eliminate a start date without a matching end date
declare @date_for_row_to_delte date =
(select top 1 [date] from #start_end_dates_b4_odd_drop order by date desc)

-- delete odd-row at end, if there is a start date without a matching end date
if (select count(*) % 2 from #start_end_dates_b4_odd_drop) = 1
begin
 delete from #start_end_dates_b4_odd_drop where date = @date_for_row_to_delte --(select top 1 [date] from #start_end_dates_b4_odd_drop order by date desc)
end
begin try
   drop table #start_end_dates
end try
begin catch
   print '#start_end_dates not available to drop'
end catch

-- save cleaned start and end dates
select * into #start_end_dates from #start_end_dates_b4_odd_drop
-- display start and end dates with macd number of rows in date ranges
-- and first, last and max close prices within ranges
select
 *
,(
 select
 top 1 [close] close_first
 from #for_sums_counts_by_macd
 where date >= [start_date] and date <= [end_date]
 ) close_first
,(
 select
 top 1 [close] close_last
 from #for_sums_counts_by_macd
 where date >= [start_date] and date <= [end_date]
 order by date desc
 ) close_last
,(
 select
 max([close]) close_max
 from #for_sums_counts_by_macd
 where date >= [start_date] and date <= [end_date]
 ) close_max
from
(
select
start_date
,end_date
,symbol
,[close]
,macd
,number_of_row_number
from
(
select
macd_pos_not_pos
,[date] start_date
,lead([date],1) over (order by date) end_date
,symbol
,[close]
,macd
,row_number start_row_number
,lead(row_number,1) over (order by date) end_row_number
,lead(row_number,1) over (order by date)-row_number + 1 number_of_row_number
from #start_end_dates
where macd_pos_not_pos in ('start_pos', 'end_pos')
--where macd_pos_not_pos = 'start_pos'
) for_start_date_end_date
where macd_pos_not_pos = 'start_pos'
) for_close_prices_in_dates
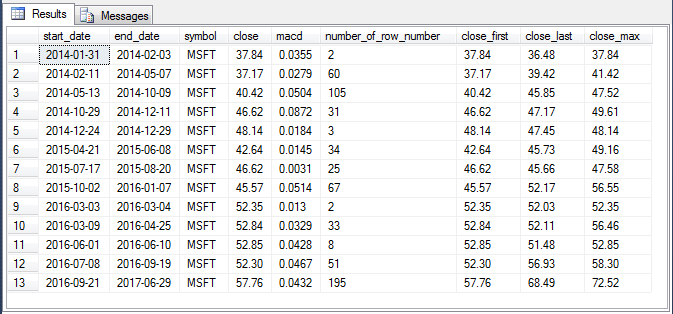
The following screen shot shows output from the preceding script with data for the Microsoft Corporation, whose ticker value is MSFT.
- There are thirteen date ranges with two or more contiguous trading days having positive MACD line values in the historical data.
- Some of these date ranges extend over just 2 days.
- One date range extends over 195 days.
- The start_date, end_date, symbol, close, and macd column values are derived from the original #for_sums_counts_by_macd temporary table created from the script discussed in the preceding section.
- The number_of_row_number column value is computed within the for_start_date_end_date query within the final select statement, and close_first, close_last, and close_max column values are computed in the outermost query within the final select statement.
- The number_of_row_number value denotes the number or rows or trading days in a date range.
- The close_first value represents the close price value on the start date of a date range.
- The close_last value represents the close price value on the end date of a date range.
- The close_max value represents the maximum close price from the start date through the end date of a date range.
The next screen shot shows the SQL Server output from the preceding screen shot along with several additional columns and a row from within an Excel worksheet (close_price_change_for_positive_macd_line_date_ranges.xlsx). The added content is to help assess if and when close prices go up overall during times when MACD line values are positive.
The values in row 60 are designed to show an overview of the outcomes across individual date ranges.
- For example, cell G60 shows the average first close price across the thirteen date ranges with positive MACD line values. The average first close price value is 47.16307692.
- Cell K60 shows the profit or loss accumulated by buying on the start date and selling on the end date of each date range. The profit per share across all 13 buy and sell dates is 27.8500.
- Cell L60 indicates that this results in a profit percentage of 59.05% — computed by dividing the contents of cell K60 by with the value in cell G60.
- Cell N60 shows the profit or loss accumulated by buying on the start date and selling on the date with the maximum close price is 57.18.
- Cell O60 reveals that the profit percentage from buying on the start date and selling on the date with the maximum close price is 121.24%. Notice that the profit percentage is substantially larger if you sell at the maximum close price.
You might be wondering why the percent profit is so much larger when the stock is sold at the maximum close price in a date range than at the last close price in a date range. This is because the MACD line value can successively rise to one or more peak values within a date range before ultimately declining towards and below the centerline value to close a date range.
The MACD indicators depend on detailed calculations, but they are most easily interpreted when they are plotted on a graph. In a future tip series, I hope to examine stock technical indicators, including the MACD indicators from a visual analytics perspective (for example, through charts generated via SSRS or another external plotting package with chart images stored in SQL Server). The current series restricts its focus to computational guidelines so that you are equipped with the theory and implementation knowledge necessary to compute these indicators for historical stock price data in a SQL Server database.

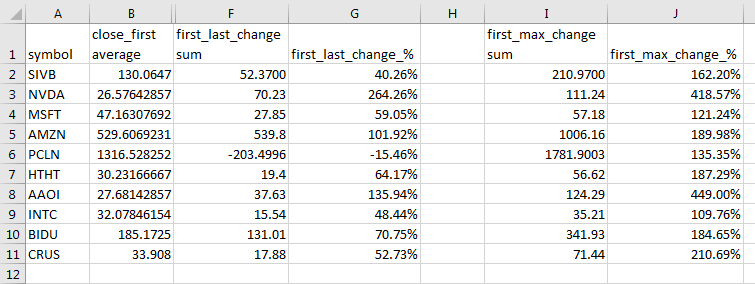
The next screen shot is another excerpt from an Excel worksheet that presents just the summary rows for ten different ticker symbols – one for MSFT and then nine additional other symbols.
- For all except one of the ticker symbols (PCLN), the first_last_change sum and first_last_change_% column values are positive. In fact, the median percentage change across all ten ticker symbols was around 60 percentage points for close price (the average of 59.05% and 64.17%).
- The maximum percentage point change in close price was over 100 for each of the ten ticker symbols!
Date ranges with positive MACD line values can clearly denote periods of close price gains.
A T-SQL script for computing MACD indicators for all NASDAQ ticker symbols
The final code sample in this tip demonstrates how to generate and save MACD indicators for many stock symbols in a single script. While the specific goal of the sample covered in this section is to save the MACD indicators for all NASDAQ symbols, the code can be readily adapted to generate MACD indicators for any set of pre-defined symbols. The target database for storing the MACD line indicator values for all NASDAQ symbols is AllNasdaqTickerPricesfrom2014into2017.
Before describing the code in the following script, it may be worth noting that this is the third tip in a series on how to compute stock market technical indicators. The first tip in the series was on how to compute simple arithmetic moving averages. The second tip focused on how to compute exponential moving averages. The AllNasdaqTickerPricesfrom2014into2017 database is where the technical indicator result sets for all NASDAQ symbols are stored by sample scripts. Eventually, a reasonably extensive collection of technical indicators will be available for the set of NASDAQ ticker symbols and an updated version of the database will be released. In the interim, each tip will contain a section on programmatically updating the AllNasdaqTickerPricesfrom2014into2017 database with technical indicator(s) covered by tips in the series. This section fulfills that objective for the MACD indicators.
Despite some variation from tip to tip in the stock market technical indicator series, the code for populating the AllNasdaqTickerPricesfrom2014into2017 database with the technical indicators for a tip is basically the same from one tip to the next. There are three main parts to the script for populating the AllNasdaqTickerPricesfrom2014into2017 database.
- Initially, code is invoked for looping through all ticker symbols in the AllNasdaqTickerPricesfrom2014into2017 database; the results are saved in the ##symbol global temporary table. An @symbol local variable is declared for storing successive symbol values.
- Next, a while loop passes through each of the NASDAQ symbols and computes the technical indicators for the tip.
- Each pass through the loop is for a specific symbol denoted by the value of the @symbol local variable; the value of @symbol is updated on each pass through the while loop.
- For this tip, we are computing the three MACD indicators. The original version of the code to compute these indicators is reviewed in the “A T-SQL script for demonstrating how to compute MACD indicators” section of the current tip.
- Towards the bottom of the while loop, another block of code inserts the computed technical indicators into a table in the AllNasdaqTickerPricesfrom2014into2017 database. The temporary table holding the MACD indicators for the current pass through the loop has the name #for_sums_counts_by_macd. An insert…select statement bulk loads the values from the #for_sums_counts_by_macd table into the macd_indicators table within the AllNasdaqTickerPricesfrom2014into2017 database. The macd_indicators table is created before the while loop commences.
 USE AllNasdaqTickerPricesfrom2014into2017
GO
-- create fresh copy of ##symbol table
-- with symbol and symbol_number columns
-- for all historical prices and volumes
-- in Results_with_extracted_casted_values
begin try
drop table ##symbol
end try
begin catch
print '##symbol not available to drop'
end catch
select
[symbol]
,row_number() over (order by symbol) AS symbol_number
into ##symbol
from
(
select distinct symbol
from  Results_with_extracted_casted_values
) for_distinct_symbols
order by symbol
-- create a fresh copy of the ewma_10_30_50_200 table
-- to preserve exponential moving averages
begin try
drop table [macd_indicators]
end try
begin catch
print '[macd_indicators] not available to drop'
end catch
create table [dbo].[macd_indicators](
 [symbol] [varchar](10) NULL,
 [date] [date] NULL,
 [close] [money] NULL,
 [macd] [money] NULL,
 [signal] [money] NULL,
 [macd_histogram] [money] NULL
)
-- declare local variables to help
-- loop through stock symbols to populate ewma_10_30_50_200
declare @maxPK int;Select @maxPK = MAX(symbol_number) From ##symbol
declare @pk int;Set @pk = 1
declare @symbol varchar(5)
-- start while loop for successive @symbol values
while @pk <= @maxPK
begin
-- use this segment of the script to set up for calculating
-- ewma_12 and ewma_26 for ticker symbol
-- initially populate #temp_for_ewma for ewma calculations
-- @ewma_first is the seed
set @symbol = (select [symbol] from ##symbol where symbol_number =  @pk) --'MSFT'
declare @ewma_first money =
(select top 1 [close] from Results_with_extracted_casted_values where symbol = @symbol order by [date])

-- create base table for ewma calculations
begin try
drop table #temp_for_ewma
end try
begin catch
print '#temp_for_ewma not available to drop'
end catch
-- ewma seed run
select
 [date]
,[symbol]
,[close]
,row_number() OVER (ORDER BY [Date]) [row_number]
,@ewma_first ewma_12
,@ewma_first ewma_26
into #temp_for_ewma
from Results_with_extracted_casted_values
where symbol = @symbol
order by row_number
-- NULL ewma values for first period
update #temp_for_ewma
set
 ewma_12 = NULL
   ,ewma_26 = NULL
where row_number = 1
-- calculate ewma_12 and ewma_26
-- @ew_12 is the exponential weight for 10-period
-- @ew_26 is the exponential weight for 30-period
-- start calculations with the 3rd period value
-- seed is close from 1st period; it is used as ewma for 2nd period
declare @max_row_number int = (select max(row_number) from #temp_for_ewma)
declare @current_row_number int = 3
declare @ew_12 real = 2.0/(12.0 + 1), @today_ewma_12 real
declare @ew_26 real = 2.0/(26.0 + 1), @today_ewma_26 real
while @current_row_number <= @max_row_number
begin
 set @today_ewma_12 =
 (
 -- compute ewma_12 for period 3
 select
 top 1
 ([close] * @ew_12) + (lag(ewma_12,1) over (order by [date]) * (1 - @ew_12)) ewma_12_today
 from #temp_for_ewma
 where row_number >=  @current_row_number -1 and row_number <=  @current_row_number
 order by row_number desc
 )
 set @today_ewma_26 =
 (
 -- compute ewma_26 for period 3
 select
 top 1
 ([close] * @ew_26) + (lag(ewma_26,1) over (order by [date]) * (1 - @ew_26)) ewma_26_today
 from #temp_for_ewma
 where row_number >=  @current_row_number - 1 and row_number <=  @current_row_number
 order by row_number desc
 )

 update #temp_for_ewma
 set
  ewma_12 = @today_ewma_12
    ,ewma_26 = @today_ewma_26
 where row_number =  @current_row_number
 set @current_row_number =  @current_row_number + 1
end

-- nested queries for macd, signal
-- and macd_histogram
begin try
   drop table #for_sums_counts_by_macd
end try
begin catch
   print '#for_sums_counts_by_macd not available to drop'
end catch
-- in the outer query, compute macd_histogram as
-- macd less signal
select
*
,macd-signal macd_histogram
into #for_sums_counts_by_macd
from
(
-- next, compute signal as ewma_9 of macd
select
*
,
case
when row_number <= 2 then NULL
when row_number = 3 then 0
when row_number >3 then
cast(
((2/(9.0+1))*macd) + ((1-(2/(9.0+1)))*lag(macd,1) over (order by [row_number]))
as money)
end signal
from
(
-- first, compute macd as ewma_12 less ewma_26
select
 [date]
,symbol
,[close]
,[row_number]
,[ewma_12]
,[ewma_26]
,[ewma_12]-[ewma_26] macd
from #temp_for_ewma
where row_number <= @max_row_number
) for_signal
) for_macd_histogram
order by row_number
-- insert #temp_for_ewma for current value
-- of @symbol into ewma_10_30_50_200
insert into macd_indicators
select
symbol
,[date]
,[close]
,macd
,signal
,macd_histogram
from #for_sums_counts_by_macd

-- update @pk value for next set of
-- @symbol exponential moving averages
    Select @pk = @pk + 1
end
Next Steps
To start testing and adapting the scripts presented in this tip, you will need to download the backup file for the AllNasdaqTickerPricesfrom2014into2017 database associated with this prior tip. This database has the Results_with_extracted_casted_values table with end-of-day price and volume data for all NASDAQ ticker symbols. It also contains the mav_10_30_50_200 table with arithmetic moving averages for the close prices for all NASDAQ ticker symbols.
After restoring the backup file on the computer from which you run SQL Server, you can download the script files and selected other content available for download with this tip. An example of non-script content is the Excel workbook file with content for assessing the percentage change in close prices for date ranges with positive MACD line indicator values.
Next, start running the script presented in this tip to compute MACD indicators.
Then, go on and examine the code for assessing the percentage change in close prices for date ranges with positive MACD line indicator values. After you become comfortable with the code, consider experimenting with the code. One very simple change you can make to the code is to try it for other stock symbols besides the ten symbols for which results are reported in this tip. Also, consider testing any custom trading rules that you wish to explore. In this way, you can test your trading assumptions on the data already in the AllNasdaqTickerPricesfrom2014into2017 database without risking any money. This database is loaded with daily end-of-day data for over 3200 NASDAQ symbols.

Rick Dobson is a SQL Server professional with decades of T-SQL experience that includes authoring books, running a national seminar practice, working for businesses on finance and healthcare development projects, and serving as a regular contributor to MSSQLTips.com. He has been a practicing Python developer for more than the past half decade – with a special emphasis for data visualization and ETL tasks with JSON and CSV files. His most recent professional passions include financial time series data and analyses, AI models, and statistics. If you are interested in growing your skills in any of these areas especially as they relate to financial securities, consider visiting his blog at https://securitytradinganalytics.blogspot.com/2023/12/.
- MSSQLTips Awards: Leadership (200+ tips) – 2025 | Author of the Year Contender – 2017-2024

Rick,
First thank you for the tip it has been helpful in getting my head around the sql code necessary to calculate the recursive exponential moving averages needed for the macd calculation. I did notice though when I compared results I got for the MACD signal calculation with what is presented in by my trading platform there was a discrepancy. I was able to analyze what was causing the discrepancy and it appears to me that the MACD signal formula as a exponential moving average should be a recursive calculation using the current MACD value and the previous MACD signal value whereas your code does not appear to be recursive and uses the current MACD value and the previous lag MACD value.
I may be wrong in my assessment but wanted to share my observation as I thought your tip was beneficial and if I am right you might want to modify it.