Problem
Our stock advisory newsletter maintains end-of-day price and volume for stocks in a SQL Server database. We need a demonstration on how to implement and apply with T-SQL a technical indicator that reveals when a stock’s price is about to reverse its direction. I need a tutorial on how to compute the indicator as well as a confirmation that the indicator identifies reversals that yield profitable buy and sell signals.
Solution
The Relative Strength Index, also called the RSI, was initially created and described by J. Welles Wilder, Jr. in a book titled “New Concepts in Technical Trading Systems”, which was published originally in 1978. Although the book is no longer new, the RSI has stood the test of time, and it is widely written about and used in more recent times as a leading tool to detect stock price reversals. Since its introduction, numerous other stock price analysts have offered guidance on how to use and interpret the RSI (for example, here and here).
There are currently two versions of the AllNasdaqTickerPricesfrom2014into2017 database that you can download from MSSQLTips.com; one version is for a full set of over 3200 NASDAQ stocks, and the other version contains data for just 32 distinct stocks. You can run the scripts from this tip for computing RSI for a set of stocks with either database version. Finally, this tip closes with some simple T-SQL accounting code run for a handful of stock symbols to assess when and how RSI reversals identify stock price gains.
What’s the computational logic for the RSI?
RSI values can range from 0 through 100, and the RSI centerline value is 50. The higher the value the greater the relative strength, and the lower the value the weaker the relative strength of a stock price. The basic notion behind the RSI is that the index rises as the sum or recent stock price gains grows relative to recent stock prices losses. What is recent depends on a window length of trading days used to compute the RSI. Normally, a 14-day window is used, but this can be changed at the discretion of a user. The first RSI value is not be defined until enough trading days become available to complete the first window length. Each additional time series value in the source data allows for the computation of a RSI value corresponding to the window length of values ending with the most recent time series value.
The RSI is dependent on a transformation of Relative Strength, which is, in turn, dependent on the average gain of stock prices divided by the average loss of stock prices in a window of close prices.
- The gain or loss for a single period is based on the change of the current period’s close price less the previous period’s close price.
- There are two basic ways to compute the stock average price changes for gains and losses in a window.
- The initial average stock price gain is the sum of the gains divided by 14 (or whatever other period window length you are using); similarly, the initial average stock price loss is the arithmetic average of the stock price losses within the first trading window.
- After the computation of the first average stock price for gains and losses, a weighted function of the prior period’s average gains and losses and the current period’s gain or loss is used to compute the average gain or loss for a trading window ending on a period. The look-back period is always a fixed value – usually 14.
- The weighted functions are as follow:
- Average gain for current period = ((previous period’s average gain * (window length -1) ) + current period’s gain)/window length
- Average loss for current period = ((previous period’s average loss * (window length -1) ) + current period’s loss)/window length
After the Relative Strength is computed based as the ratio of the average gain to the average loss, it can be used to compute the RSI. The following expression transforms the Relative Strength into a value from 0 through 100.
100 - (100/(1 + Relative Strength))
There are two boundary values that are often used to define overbought and oversold prices. When the RSI is 70 or greater, the corresponding close price is usually referred to as overbought. Similarly, when the RSI drops below 30, its corresponding price is usually referred to as oversold. Just because a price is at an overbought level does not mean a price decline is likely to occur immediately. The same applies to oversold close prices. A close price with a RSI value below 30 does not mean the price is necessarily likely to rise immediately. Two more common interpretations for RSI values and the likely near-term future of close prices are as follow.
- When the RSI rises from below 30 to above 30, it is normally viewed as a good time to buy the stock in anticipation of future price appreciation. That is because the corresponding stock price for the RSI is exiting an oversold range of RSI values.
- Also, when the RSI declines from above 70 to below 70, it is normally viewed as a good time to sell a stock to capture any price appreciation before a stock’s price declines further.
One major objective of this tip is to test these two assumptions and to provide you with T-SQL code for evaluating the assumption for any stock or set of stocks that you are following.
A T-SQL script to compute the RSI for a stock closing price series
One of the best introductions to the RSI that I discovered is available from stockcharts.com. The web site provides an Excel workbook that can be downloaded with expressions for RSI values based on QQQ security close prices. While neither the security nor the date range are suitable for the purposes of this tip, the Excel workbook does offer an easy way to unit test the T-SQL code presented in this tip. When developing fresh code for indicators that you have not previously programmed, it is a best practice to validate your code’s output with some standard.
This tip relies on the Excel workbook as a standard. I copied the close prices for a security from the AllNasdaqTickerPricesfrom2014into2017 database into the workbook. This section of the tip presents T-SQL code for computing RSI values for a stock’s prices and then validates the code’s output by comparing it to computed RSI values from the workbook. If the RSI values are the same to within rounding errors, then the workbook confirms the T-SQL code for computing RSI values.
The source data for the T-SQL RSI code is the Results_with_extracted_casted_values table from the AllNasdaqTickerPricesfrom2014into2017 database.
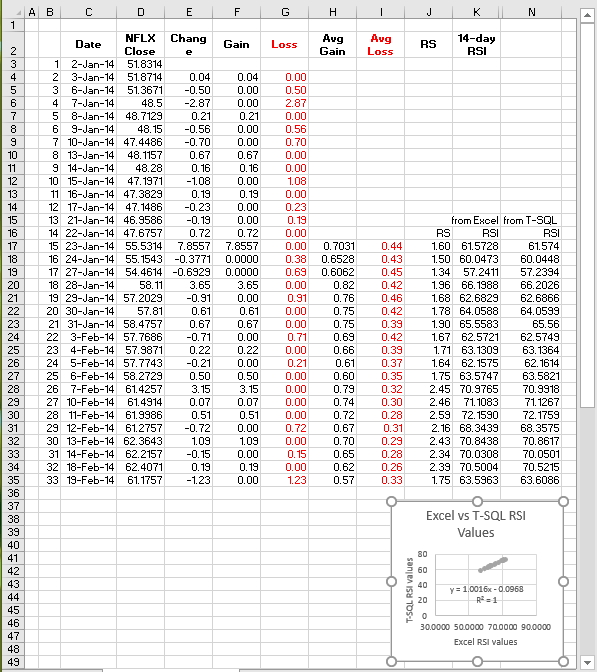
The Excel workbook file, named for_rsi_code_unit_test.xls, was downloaded from the stockcharts.com site and enhanced in a couple of ways to facilitate the objectives of this tip. A screen shot of the updated workbook appears below.
- Notice that the stock symbol is for NFLX, which represents Netflix, Inc., a popular streaming internet service.
- Columns K and N offer side-by-side comparisons of RSI values from Excel and T-SQL code. The RSI values are from January 23, 2014 through February 19, 2014. These are the earliest dates in the AllNasdaqTickerPricesfrom2014into2017 database for which RSI values can be computed.
- A chart in the bottom right corner of the screen shot shows a scatter chart of the Excel versus the T-SQL RSI values. The computed coefficient of determination, which is 1, confirms the two sets of RSI values are essentially identical.
The T-SQL code for computing the RSI values appears below. There are two main sections to the T-SQL code.
- The first part focuses on columns B through G from the preceding workbook. This section of the code sets up for computing average gain, average loss, Relative Strength, and RSI. For example, it creates and partially populates a table (#for_all_avg_gain_loss) for storing RSI values.
- The second part works with the preliminary output from the first section by applying expressions for computing average gain and average loss for computing Relative Strength and RSI. RSI and other values are saved in the #for_all_avg_gain_loss table.
- Immediately after the second part, a select statement displays values for comparing T-SQL RSI values to Excel workbook RSI values.
A begin…try block at the top of the following script deletes any prior version of the #for_all_avg_gain_loss table. The script ultimately populates this table with fresh RSI values for the close prices. The row_number function assigns values to the row_number column in ascending order based on date values. The values on a row are identified by symbol and date values. Thirty-three rows of source data contribute to the unit test comparison of the T-SQL RSI values versus the Excel workbook RSI values.
The code for the first section of the script includes a nested script named for_15_row_avg_gain_loss inside of outer script that assigns selected #for_all_avg_gain_loss table column values. The subquery’s main objective is to compute the average gain and average loss for the fifteenth row in the result set.
- This script is based on the standard RSI window length of fourteen periods.
- The RSI values are ultimately based on the change in time series values from one row to the next. Therefore, fifteen rows are required to generate fourteen change values.
- The change values are computed in the subquery by computing the difference between the current row value with the lagged row value for rows two through fifteen. The subquery also populates a series of gain and loss column values based on the changes.
- Change values that are greater than zero are assigned to the gain column. When the change value is not positive, then the gain value is implicitly assigned a null value.
- Change values that are less than zero are assigned to the loss column. When the change value is not negative, then the loss value is implicitly assigned a null value.
- Two case statements in the outer query compute average gain (avg_gain) and average loss (avg_loss) values
- The avg_gain and avg_loss values are null for the first fourteen rows because a full set of fourteen change values do not become available until the fifteenth row.
- The “rows between 13 preceding and current row” phrase specifies the fourteen rows starting with the current row and the preceding 13 rows.
- The “rows between 13 preceding and current row” phrase only works for SQL Server 2012 and later. Therefore, if you are using an earlier version you will need to tweak the code (or update to SQL Server 2012 if you prefer).
- The avg_gain value for the fifteenth row is the avg function value for the gain values from the subquery.
- The avg_loss value for the fifteenth row is the avg function value of the abs function for loss values from the subquery.
- The code in the first section implicitly assigns null values to avg_gain and avg_loss for rows sixteen and beyond. This is because these rows use a different expression for computing avg_gain and avg_loss.
- The avg_gain and avg_loss values are null for the first fourteen rows because a full set of fourteen change values do not become available until the fifteenth row.
The second section in the T-SQL script computes avg_gain and avg_loss for rows sixteen and beyond as well as the Relative Strength and RSI for rows fifteen and beyond.
- A while loop controls sequential passes through the rows.
- The avg_gain and avg_loss column values are dependent on a weighted average of two rows for rows sixteen and beyond. A series of local variable declarations facilitate populating avg_gain and avg_loss column values for the current row and the prior row.
- On the first pass through the loop values are computed for rows fifteen and sixteen; then on the second pass through the loop values are computed for rows sixteen and seventeen. This pattern persists through the final pair of rows in the source data.
- Four local variables are for gain, loss, avg_gain, and avg_loss for the prior row; this is for row fifteen on the first pass through the while loop. The corresponding local variable names are @gain_prior, @loss_prior, @avg_gain_prior, and @avg_loss_prior.
- Another four local variables are for gain, loss, avg_gain, and avg_loss for the current row; this is row sixteen on the first pass through the while loop. The corresponding local variable names are @gain_current, @loss_current, @avg_gain_current, and @avg_loss_current.
- The @row_number local variable contains the row number value for the prior row.
- Another two pair of local variables are for Relative Strength and RSI values for the prior and current rows as well.
- @rs_prior and @rsi_prior, respectively, are for Relative Strength and RSI for the prior row.
- @rs_current and @rsi_current, respectively, are for Relative Strength and RSI for the current row.
Two update statements assign values to the prior and current rows in the #for_all_avg_gain_loss table, respectively.
- The first update statement computes the Relative Strength and RSI values for the prior row, which is designated by the @row_number value. This update statement is essentially for the fifteenth row (although it operates for row fifteen and all subsequent rows).
- The second update statement includes the weighted average expressions for avg_gain and avg_loss for rows sixteen and beyond through the end of the data rows. The second update statement also computes fresh Relative Strength and RSI values for rows sixteen and beyond.
use AllNasdaqTickerPricesfrom2014into2017
go
-- create #for_all_avg_gain_loss
-- populate row 15 for avg_gain and avg_loss
-- configure for all subsequent rows
begin try
drop table #for_all_avg_gain_loss
end try
begin catch
print '#for_all_avg_gain_loss not available to drop'
end catch

-- for avg_gain and avg_loss for row 15
-- and base table for updating
select
row_number() over (order by date) row_number
,symbol
,[date]
,[close]
,round(isnull([close]
- lag([close],1) over (order by date),0),5) change
,round(isnull(gain,0),5) gain
,round(isnull(abs(loss),0),5) loss
,
round(
case
when row_number <= 14 then null
when row_number = 15 then
avg(round(isnull(gain,0),5)) over
(order by [date] rows between 13 preceding and current row)
end
,5) avg_gain
,
round(
case
when row_number <= 14 then null
when row_number = 15 then
avg(round(isnull(abs(loss),0),5)) over
(order by [date] rows between 13 preceding and current row)
end
,5) avg_loss
,cast(NULL as real) [relative strength (rs)]
,cast(NULL as real) [rsi]
into #for_all_avg_gain_loss
from
(
-- for gains and losses
select
symbol
,[date]
,row_number() over (order by [date]) row_number
,[close]
,[close]-(lag([close]) over(order by date)) change
,
case
when ([close]-(lag([close]) over(order by date))) > 0
then [close]-(lag([close]) over(order by date))
end gain
,
case
when ([close]-(lag([close]) over(order by date))) < 0
then [close]-(lag([close]) over(order by date))
end loss
from Results_with_extracted_casted_values
where symbol = 'NFLX'
) for_15_row_avg_gain_loss

----------------------------------------------------------------------------------------------------
-- declare local variables for Relative Strength
-- and Relative Strength Index (rsi) computation
declare @date_cnt int = (select count(date) from #for_all_avg_gain_loss)
,@row_number int = 15
,@gain_prior money
,@loss_prior money
,@avg_gain_prior money
,@avg_loss_prior money
,@gain_current money
,@loss_current money
,@avg_gain_current money
,@avg_loss_current money
,@rs_prior real
,@rsi_prior real
,@rs_current real
,@rsi_current real
----------------------------------------------------------------------------------------------------
-- start looping through rows after 14th row until last row
-- process rows iteratively two at a time
while @row_number > 14 and @row_number <=
(select count(date) from #for_all_avg_gain_loss)
begin
-- assign values to local variables for prior and current rows
-- initially 15 denotes prior row and 16 denotes current row
-- pairs of rows are successively (15,16), (16,17), (17,18)...
select
 @gain_prior = isnull((select gain from #for_all_avg_gain_loss
where row_number = @row_number),0)
,@loss_prior = abs(isnull((select loss from #for_all_avg_gain_loss
where row_number = @row_number),0))
,@avg_gain_prior = (select avg_gain from #for_all_avg_gain_loss
where row_number = @row_number)
,@avg_loss_prior  = abs((select avg_loss from #for_all_avg_gain_loss
where row_number = @row_number))
,@gain_current = isnull((select gain from #for_all_avg_gain_loss
where row_number = @row_number + 1),0)
,@loss_current = abs(isnull((select loss from #for_all_avg_gain_loss
where row_number = @row_number + 1),0))
,@avg_gain_current = (@avg_gain_prior*13 + @gain_current)/14
,@avg_loss_current = (@avg_loss_prior*13 + @loss_current)/14

-- update prior row
update #for_all_avg_gain_loss
set
[relative strength (rs)] = @avg_gain_prior/@avg_loss_prior
,rsi =
 case
 when @avg_loss_prior != 0 then
(100 - (100/(1+(@avg_gain_prior/@avg_loss_prior))))
 else
 100
 end
where #for_all_avg_gain_loss.row_number = @row_number
-- update current row
update #for_all_avg_gain_loss
set
 avg_gain = ((@avg_gain_prior*13) + @gain_current)/14
,avg_loss = ((@avg_loss_prior*13) + @loss_current)/14
,[relative strength (rs)] =
(((@avg_gain_prior*13) + @gain_current)/14)
/(((@avg_loss_prior*13) + @loss_current)/14)
,rsi =
 case
 when @avg_loss_current != 0 then
(100 - (100/(1+(@avg_gain_current/@avg_loss_current))))
 else
 100
 end
where #for_all_avg_gain_loss.row_number = @row_number+1
-- increment @row_number by 1 to get to
-- next to rows to process for rsi
set @row_number = @row_number + 1
end

--/*
-- for comparison to RSI Code Unit Test tab
select * from #for_all_avg_gain_loss where date <= '2/19/14' order by date
--*/
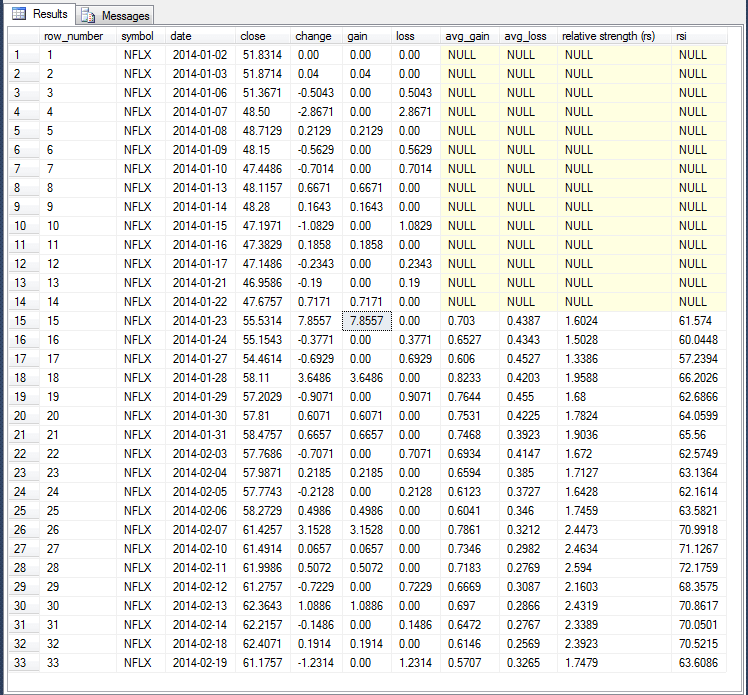
The next screen shot shows the result set displayed by the select statement that concludes the preceding script.
- The values in the date and close columns are for pasting into the preceding workbook. This pasting ensures that the Excel workbook starts with the same source data as the T-SQL code.
- Excel workbook column values in rows fifteen through thirty-three for columns E through K are the result of workbook expressions from the Excel workbook downloaded from the stockcharts.com site.
- Similarly, the values in rows fifteen through thirty-three of the rsi column from the screen shot below are for pasting into column N of the preceding workbook.
- This second pasting facilitates the comparison of Excel versus T-SQL code RSI values and their comparison via a coefficient of determination computed by the Excel charting feature.
Computing RSI values with a T-SQL script for a set of stock symbols
The script from the preceding section has a couple of advantages, but it is not especially well suited for generating RSI values for a set of different stock symbols. Instead, it works for one symbol at a time. Computing RSI values for a set of different symbols requires some partitioning of the source data so that the rsi computational expressions apply to data for just one symbol at a time. Built-in SQL Server data partitioning is not supported for some operations, such as update statements or even arithmetic operators, which are critical for computing RSI values. Also, the RSI calculations depend on processing data from two different rows, another process not supported by built-in SQL Server data partitioning.
The approach adopted here is to put an adaptation of the code from the previous section in a while loop that passes through multiple symbols. The list of stock symbols can come from any source, such as the distinct symbols from the Results_with_extracted_casted_values table in the AllNasdaqTickerPricesfrom2014into2017 database. On each iteration through the while loop, the code from the preceding section can be run for a different distinct symbol value. Before starting a loop for the next distinct symbol, you can preserve the RSI values computed in the current loop within a permanent table.
As it turns out, there are data issues that require some minor tweaks to the code from the preceding section before applying the solution described above to data from Yahoo Finance. For example, some stock symbols that are not traded regularly or may have invalid historical price and volume data can cause problems for the RSI computational expressions. Checking for missing data values, such as all null or all zero values, for computing average gain or average loss values bypasses errors encountered while migrating the code from the previous section to this section’s code. Bypassing these invalid values for the expressions avoids a job failure when only a tiny fraction of bad data existed in the source data.
The following script shows one possible implementation of the above approach. Here’s a walkthrough of key points in the code.
- After a use statement referencing the AllNasdaqTickerPricesfrom2014into2017 database, a code block creates the rsi table.
- This table will ultimately have a separate row for each original row of close price data in the Results_with_extracted_casted_values table.
- Of course, the first fourteen rows of data for each stock symbol will have null RSI values because of a minimum window length requirement. In future versions of the code, you may care to allow the minimum window length requirement to be set parametrically based on user-defined values.
- While the close price is not strictly required in the rsi table, its inclusion permits a convenient point of reference back to the data in the source table and for accounting how RSI values correspond to price changes without the need for join back to the source data with close prices.
- The next code block includes a set of declarations for local variables used when passing through source table rows.
- It is more logical to make these declarations once outside of any loops instead of repeatedly within loops.
- Set statements within the loop for distinct symbol values assign specific values for two local variables before iterating through the data rows for each distinct symbol.
- Other local variables have values assigned while iterating across the data rows for a symbol.
- Next, the ##symbol table is freshly created and populated for the distinct symbols within the Results_with_extracted_casted_values table.
- After the ##symbol table is populated, a while loop is specified that iterates from the first through the last symbol in the ##symbol table.
- A begin…end block is declared immediately after the while statement.
- Within the begin…end block, the script runs the adapted code to compute RSI values for a specific symbol. This adapted code has a nested while statement with its own begin…end block. A major objective of the nested code is to compute RSI values to populate the #for_all_avg_gain_loss table.
- After the end statement for the adapted rsi code, the values for the #for_all_avg_gain_loss table are inserted into the rsi table towards the bottom of the script. This archives the RSI values for a symbol for subsequent use in a permanent SQL Server table.
- The final statement after the end statement for the adapted rsi code loop increments the value of the @pk local variable by one for the next symbol in the ##symbol table. When the @pk value exceeds the maximum number of symbols in the ##symbol table, the while symbol loop terminates, and this, in turn, ends the overall script.
- The adapted rsi code has three main segments.
- The initial segment creates a fresh copy of the #for_all_avg_gain_loss table and configures the table for subsequent use in the third segment. A critical part of the initialization process is the computation of avg_gain and avg_loss column values for the fifteenth row in the table.
- The second statement assigns values to the @date_cnt and @row_number variables.
- The @date_cnt local variable stores the maximum number of data rows for a symbol. This number can change across symbols because not all symbols have an initial public offering before the first collection date of end-of-day data from Yahoo Finance. Additionally, some securities’ symbols are not frequently traded so these symbols may be missing data between the start and end date for the collection of data from Yahoo Finance. Finally, it is a known issue that Yahoo Finance was updating data during the time that the Results_with_extracted_casted_values table was being populated. Consequently, some symbols have their data end a day earlier than other symbols.
- The @row_number local variable is initialized to a value of 15 before starting the third code segment that computes RSI values.
- The third segment iterates through the data rows for a symbol to create Relative Strength and rsi column values for the #for_all_avg_gain_loss table.
use AllNasdaqTickerPricesfrom2014into2017
go

-- create fresh copy of rsi table
-- with symbol and symbol_number columns
begin try
drop table rsi
end try
begin catch
print 'rsi not available to drop'
end catch

CREATE TABLE [dbo].[rsi](
[symbol] [varchar](10) NULL,
[date] [date] NULL,
[close] [money] NULL,
[relative strength (rs)] [real] NULL,
[rsi] [real] NULL
) ON [PRIMARY]

----------------------------------------------------------------------------------------------------
-- declare local variables for Relative Strength
-- and Relative Strength Index (rsi) computation
declare @date_cnt int
,@row_number int
,@gain_prior money
,@loss_prior money
,@avg_gain_prior money
,@avg_loss_prior money
,@gain_current money
,@loss_current money
,@avg_gain_current money
,@avg_loss_current money
,@rs_prior real
,@rsi_prior real
,@rs_current real
,@rsi_current real

----------------------------------------------------------------------------------------------------

-- create fresh copy of ##symbol table
-- with symbol and symbol_number columns
begin try
drop table ##symbol
end try
begin catch
print '##symbol not available to drop'
end catch
select
[symbol]
,row_number() over (order by symbol) AS symbol_number
into ##symbol
from
(
select distinct symbol
from  Results_with_extracted_casted_values
) for_distinct_symbols
order by symbol


-- declare local variables to help
-- loop through stock symbols
declare @maxPK int;Select @maxPK = max(symbol_number) From ##symbol
declare @pk int = 1
declare @symbol varchar(5)

-- start while loop for successive @symbol values
while @pk <= @maxPK
begin
-- set @symbol for current pass through loop
set @symbol = (select [symbol] from ##symbol where symbol_number =  @pk)

-- create #for_all_avg_gain_loss
-- populate row 15 for avg_gain and avg_loss
-- configure for all subsequent rows
begin try
drop table #for_all_avg_gain_loss
end try
begin catch
print '#for_all_avg_gain_loss not available to drop'
end catch

-- for current @symbol value
-- create a fresh copy of #for_all_avg_gain_loss
-- assign prime value for row 15
-- and configure table for updating
select
row_number() over (order by date) row_number
,symbol
,[date]
,[close]
,round(isnull([close]
- lag([close],1) over (order by date),0),5) change
,round(isnull(gain,0),5) gain
,round(isnull(abs(loss),0),5) loss
,
round(
case
when row_number <= 14 then null
when row_number = 15 then
avg(round(isnull(gain,0),5)) over
(order by [date] rows between 13 preceding and current row)
end
,5) avg_gain
,
round(
case
when row_number <= 14 then null
when row_number = 15 then
avg(round(isnull(abs(loss),0),5)) over
(order by [date] rows between 13 preceding and current row)
end
,5) avg_loss
,cast(NULL as real) [relative strength (rs)]
,cast(NULL as real) [rsi]
into #for_all_avg_gain_loss
from
(
-- for gains and losses
select
symbol
,[date]
,row_number() over (order by [date]) row_number
,[close]
,[close]-(lag([close]) over(order by date)) change
,
case
when ([close]-(lag([close]) over(order by date))) > 0
then [close]-(lag([close]) over(order by date))
end gain
,
case
when ([close]-(lag([close]) over(order by date))) < 0
then [close]-(lag([close]) over(order by date))
end loss
from Results_with_extracted_casted_values
where symbol = @symbol
) for_15_row_avg_gain_loss

----------------------------------------------------------------------------------------------------
-- initialize local variables for @symbol pass through loop
set @date_cnt = (select count(date) from #for_all_avg_gain_loss where symbol = @symbol)
set @row_number = 15
----------------------------------------------------------------------------------------------------
-- start looping through rows after 14th row until last row
-- process rows iteratively two at a time
while @row_number > 14 and @row_number <=
(select count(date) from #for_all_avg_gain_loss)
begin
-- assign values to local variables for prior and current rows
-- initially 15 denotes prior row and 16 denotes current row
-- pairs of rows are successively (15,16), (16,17), (17,18)...
select
 @gain_prior = isnull((select gain from #for_all_avg_gain_loss
where row_number = @row_number),0)
,@loss_prior = abs(isnull((select loss from #for_all_avg_gain_loss
where row_number = @row_number),0))
,@avg_gain_prior = (select avg_gain from #for_all_avg_gain_loss
where row_number = @row_number)
,@avg_loss_prior  = abs((select avg_loss from #for_all_avg_gain_loss
where row_number = @row_number))
,@gain_current = isnull((select gain from #for_all_avg_gain_loss
where row_number = @row_number + 1),0)
,@loss_current = abs(isnull((select loss from #for_all_avg_gain_loss
where row_number = @row_number + 1),0))
,@avg_gain_current = (@avg_gain_prior*13 + @gain_current)/14
,@avg_loss_current = (@avg_loss_prior*13 + @loss_current)/14

-- update prior row
update #for_all_avg_gain_loss
set
[relative strength (rs)] =
 case when @avg_loss_prior != 0
 then @avg_gain_prior/@avg_loss_prior
 else 1
 end
,rsi =
 case
 when @avg_loss_prior != 0 then
(100 - (100/(1+(@avg_gain_prior/@avg_loss_prior))))
 else
 100
 end
where #for_all_avg_gain_loss.row_number = @row_number
-- update current row
update #for_all_avg_gain_loss
set
 avg_gain = ((@avg_gain_prior*13) + @gain_current)/14
,avg_loss = ((@avg_loss_prior*13) + @loss_current)/14
,[relative strength (rs)] = case
when
-- additional error checks for handling missing data
-- for selected symbols
((@avg_loss_prior*13) + @loss_current) is not null
and (((@avg_gain_prior*13) + @gain_current)/14) is not null
and (((@avg_loss_prior*13) + @loss_current)/14) != 0 then
(((@avg_gain_prior*13) + @gain_current)/14)
/(((@avg_loss_prior*13) + @loss_current)/14)
else null
 end
,rsi =
 case
 when @avg_loss_current != 0 then
(100 - (100/(1+(@avg_gain_current/@avg_loss_current))))
 else
 100
 end
where #for_all_avg_gain_loss.row_number = @row_number+1
-- increment @row_number by 1 to get to
-- next to rows to process for rsi
set @row_number = @row_number + 1
end
insert into rsi
select
 symbol
,date
,[close]
,[relative strength (rs)]
,rsi
from #for_all_avg_gain_loss
order by date

-- update @pk value for next set of
-- @symbol exponential moving averages
    Select @pk = @pk + 1
end
In an operational environment, it would be natural to verify the operation of the code to populate the rsi table for all data rows with symbols in the Results_with_extracted_casted_values table within the AllNasdaqTickerPricesfrom2014into2017 database. The following script includes three separate unit tests for the preceding script. You may find these scripts of value as you try to customize or enhance the script for your own special requirements.
- The first two select statements confirm the operation of the preceding script by verifying that the rsi table has the same number of rows as the Results_with_extracted_casted_values table. This outcome confirms that in aggregate across all symbols the number of rows is the same in both tables.
- The next two select statements drill down further to verify that the number of rows is the same for the NFLX symbol in both the rsi and Results_with_extracted_casted_values tables.
- The final select statement is for an intersect set operation to validate that the symbol, date, and rsi column values from the rsi table for rows with a symbol value of NFLX perfectly match the same column values from the ##for_all_avg_gain_loss table when it is populated for the NFLX symbol as in the preceding section.
-- count of all rows (2603692) across all symbols in both
-- Results_with_extracted_casted_values and rsi tables
select count(*) count_of_rows_for_all_symbols
from [AllNasdaqTickerPricesfrom2014into2017].[dbo].Results_with_extracted_casted_values
select count(*) count_of_rows_for_all_symbols
from [AllNasdaqTickerPricesfrom2014into2017].[dbo].[rsi]

-- count is 958 rows in both the
-- Results_with_extracted_casted_values and rsi tables
-- for the NFLX symbol
select count(*) count_of_NFLX_rows
from [AllNasdaqTickerPricesfrom2014into2017].[dbo].[rsi]
where symbol = 'NFLX'

select count(*) count_of_NFLX_rows
from [AllNasdaqTickerPricesfrom2014into2017].[dbo].Results_with_extracted_casted_values
where symbol = 'NFLX'

-- additionally, 958 rows intersect between rsi table
-- and ##for_all_avg_gain_loss table for NFLX symbol
select [symbol]
      ,[date]
      ,[rsi]
from [AllNasdaqTickerPricesfrom2014into2017].[dbo].[rsi]
where symbol = 'NFLX'
intersect
-- adapted output from rsi_demo_for_unit_test.sql
select symbol, date, rsi from ##for_all_avg_gain_loss order by date
Can the RSI identify stock price reversals that result in stock price gains?
The rsi table in the AllNasdaqTickerPricesfrom2014into2017 database has time series with RSI values and matching close prices for all NASDAQ stocks. Therefore, it is possible to write code to scan the series to find RSI reversals. In this section, we are particularly interested in pairs of dates that signal when a downturn has ended and when the subsequent upturn has ceased. Here’s how to precisely identify these dates.
- The RSI rises from below 30 to above 30 to signal that a downturn has ended. This is because RSI values below 30 denote oversold prices for a stock. Therefore, when the RSI rises from below 30 to above 30, the stock price is no longer oversold.
- Similarly, when the RSI falls from above 70 to below 70, the indicator reveals that an upturn has ended. This is because RSI values above 70 indicate overbought prices for a stock. Therefore, when the RSI falls from above 70 to below 70, the stock price is no longer overbought.
The following script has a commented code section preceding an uncommented code section.
- The commented code section creates a fresh version of the ##rsi_reversal_trades table. This table is meant to track stock price reversals as indicated by the RSI for a set of stocks. You can run the code to create the table once for each set of stock symbols for which you wish to track RSI reversals.
- The uncommented code has four main code blocks. The top segment includes a declaration for the @symbol local variable before an insert…select block.
- The declaration statement lets you specify a stock symbol for which you want to store potential buy and sell dates in the ##rsi_reversal_trades table.
- The select statement gathers data from three nested code blocks that identify
- RSI reversals
- The date on which a RSI reversal occurs
- The close price associated with a RSI reversal
- The section of code commencing with the “rsi leaves oversold” comment identifies reversals where the RSI value transitions from below 30 to above 30.
- The rsi column value for the for_rsi_lag_anal subquery result set denotes the RSI value for the date column value.
- The rsi_lag_1 column value denotes the RSI value for the preceding trading date.
- When rsi column value is greater than 30 and the rsi_lag_1 column value is less than 30, the date column value denotes a RSI reversal date when the RSI value is leaving an oversold region.
- The source column values from this section of the code is “leaves oversold”.
- The section of code commencing with the “rsi leaves overbought” comment identifies reversals where the RSI value transitions from above 70 to below 70.
- This block of code also has a for_rsi_lag_anal subquery with rsi and rsi_lag_1 columns.
- When the rsi_lag_1 column value is above 70 and the rsi column value is below 70 the date column denotes a sell point based on the stock price leaving an overbought price range.
- The source column values from this section of the code is “leaves overbought”.
- Both of the preceding subqueries for leaving oversold and leaving overbought prices reside in another subquery named for_matched_pairs. This subquery is, in turn, filtered to remove rows that begin with an overbought reversal or end with an oversold reversal. As a result, only reversals that move from lower prices to higher prices are retained for a stock symbol.
/*
-- run once per set of symbols to
-- initialize the ##rsi_reversal_trades table
begin try
drop table ##rsi_reversal_trades
end try
begin catch
print '##rsi_reversal_trades not available to drop'
end catch

create table ##rsi_reversal_trades(
 symbol varchar(5)
,[date] [date]
,rsi real
,rsi_lag_1 real
,[close] money
,[source] varchar(20)
)
*/

-- get all oversold through overbought trades for a stock symbol
declare @symbol varchar(5) = 'MSFT'

insert into ##rsi_reversal_trades
-- to get all leaves oversold and leaves overbought
select
symbol
,date
,rsi
,rsi_lag_1
,[close]
,[source]
from
(
select
*
,lead(source,1) over (order by date) lead_source
,lag(source,1) over (order by date) lag_source
from
(
-- rsi leaves oversold
select *
from
(
-- for lag analysis
SELECT [symbol]
      ,[date]
      ,[rsi]
  ,lag(rsi,1) over (order by date) rsi_lag_1
  ,[close]
  ,'leaves oversold' [source]
  FROM [AllNasdaqTickerPricesfrom2014into2017].[dbo].[rsi]
  where
  rsi is not null
  and
  symbol = @symbol
) for_rsi_lag_anal
where rsi > 30 and rsi_lag_1 < 30

union

-- rsi leaves overbought
select *
from
(
-- for lag analysis
SELECT [symbol]
      ,[date]
      ,[rsi]
  ,lag(rsi,1) over (order by date) rsi_lag_1
  ,[close]
  ,'leaves overbought' [source]
  FROM [AllNasdaqTickerPricesfrom2014into2017].[dbo].[rsi]
  where
  rsi is not null
  and
  symbol = @symbol
) for_rsi_lag_anal
where rsi < 70 and rsi_lag_1 > 70
) for_oversolds_overboughts
) for_matched_pairs
where
date >=
(
-- get first date that qualifies for a trade
-- by finding first oversold date
select
min (date)
from
(
-- rsi leaves oversold
select *
from
(
-- for lag analysis
SELECT [symbol]
      ,[date]
      ,[rsi]
  ,lag(rsi,1) over (order by date) rsi_lag_1
  ,[close]
  ,'leaves oversold' [source]
  FROM [AllNasdaqTickerPricesfrom2014into2017].[dbo].[rsi]
  where
  rsi is not null
  and
  symbol = @symbol
) for_rsi_lag_anal
where rsi > 30 and rsi_lag_1 < 30
) for_first_qualifying_date
)
and
date <=
(
-- get last date that qualifies for a trade
-- by finding last overbought date
select
max(date)
from
(
-- for lag analysis
SELECT [symbol]
      ,[date]
      ,[rsi]
  ,lag(rsi,1) over (order by date) rsi_lag_1
  ,[close]
  ,'leaves overbought' [source]
  FROM [AllNasdaqTickerPricesfrom2014into2017].[dbo].[rsi]
  where
  rsi is not null
  and
  symbol = @symbol
) for_rsi_lag_anal
where rsi < 70 and rsi_lag_1 > 70
)
order by  date asc
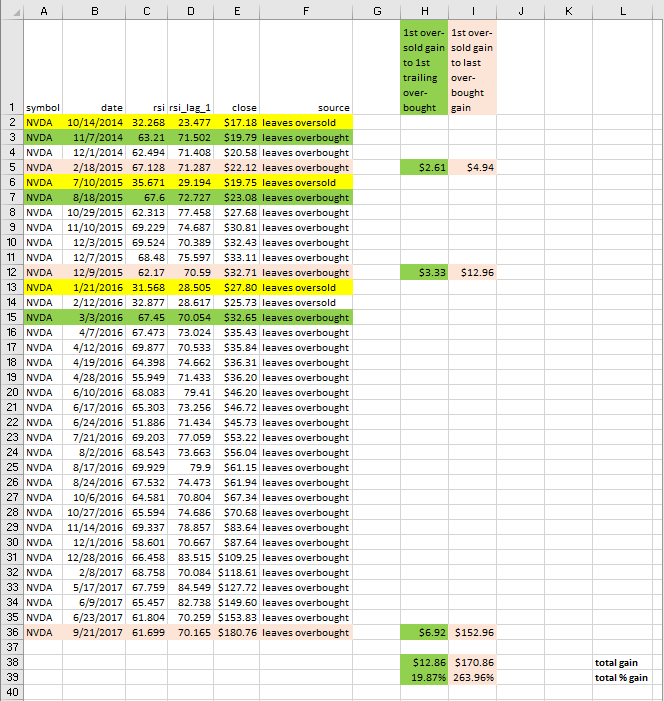
The following worksheet from the rsi_buys_and_sells.xlsx workbook file shows an edited version of the rows from the ##rsi_reversal_trades table for the NVDA stock symbol. The editing selected adds color backgrounds to highlight key values that are discussed below. The raw data from the table appears in rows 2 through 36 for columns A through F of an Excel worksheet. The NVDA symbol represents Nvidia Corporation which is a leading semi-conductor manufacturer for such applications as gaming, professional visualization, datacenters, and automobiles.
The comments below highlights points that will help you understand the results from the query to populate the rsi table. Understanding points like those discussed below can help you know whether a coded solution for populating the rsi table operates properly. Also, if you are working with the output from the script as a data miner or data scientist, then these points will be especially important because they shed light on how RSI and close values change over time.
- Row 2 is the beginning of the first reversal; this row has a yellow background as do the initial row of the other two reversals denoted in the worksheet. The initial reversal starts on October 14, 2014 when the RSI value transitions to 32.268 from 23.477 the day before. The close price on the “leaves oversold” day is $17.18.
- After the October 14, 2014 date, the RSI value moves into and out of the overbought region on three separate dates before commencing a path to the oversold region.
- The first time the RSI leaves the overbought region is on November 7, 2014. This row has a green background.
- The third and last time the RSI leaves the overbought region after leaving the oversold region is February 18, 2015. This row has a beige background as do the final “leaves overbought” rows for the other two reversals.
- Cells H5 and I5 report the share price changes from the beginning of a reversal through the first or the third time, respectively, the RSI value leaves the overbought region.
- The H5 cell value displays the close price from row 3 less the close price from row 2. The value in the cell ($2.61) indicates the share price change for a single share of NVDA stock from October 14, 2014 through November 7, 2014. This share price gain is the minimum gain from the beginning of the reversal.
- The I5 cell value displays the close price from row 5 less the close price from row 2. The value in the cell ($4.94) is the maximum price per share gain from the reversal starting on October 14, 2014.
- It is possible for a stock’s RSI value to leave both oversold and overbought regions one or more times for each reversal.
- The reversals starting on October 14, 2014 and July 10, 2015 each have just one exit from an oversold RSI value. However, the reversal starting on January 21, 2016 has two exits from an oversold RSI value.
- In the case of the NVDA symbol, the number of exits and re-entries from the overbought region is always more than twice. In fact, the number of exits from the overbought region for the reversal starting on January 21, 2016 is 22.
- In general, continued exits and re-entries to the oversold region within a reversal denote continued weakness (lack of demand) for the shares of a stock. On the other hand, continued entries and exits from the overbought region within a reversal indicate strong and rising demand among investors for the shares of a stock. The shares of NVDA were in particularly high demand during 2016 and 2017 because the stock started a reversal by exiting an oversold region on January 21, 2016 and then exited the overbought region 22 consecutive times before the data ceased. These consecutive exits are a sign of strength because you cannot have a consecutive exit from the overbought region unless you have a prior re-entry.
- It is easy to recognize the price change from the start of a reversal through to the first time a reversal leaves the overbought region, but the profit is typically less than for the last time a reversal leaves the overbought region.
- Unfortunately, there no special signal for an analyst to know when an exit from the overbought region is the last one before the start of a path to a fresh entry in an oversold region.
- However, a follow-up tip to this one will present additional analysis to help in assessing whether an exit from the overbought region is the last or close to the last exit before the start of a fresh entry into the oversold region.
- Rows 38 and 39 contain summary information for all three RSI reversal cycles for the NVDA stock symbol.
- Cell H38 displays the total price per share gain across all three cycles from the start of each cycle through the first exit from the overbought region.
- Cell I38 displays the total price per share gain across all three cycles from the start of each cycle through the last exit from the overbought region.
- Cells H39 and I39 display the percentage point change of the total share price change relative to the average close price across all reversals from the oversold region. The values in these two cells are the average percentage gain across the reversals for a stock symbol.
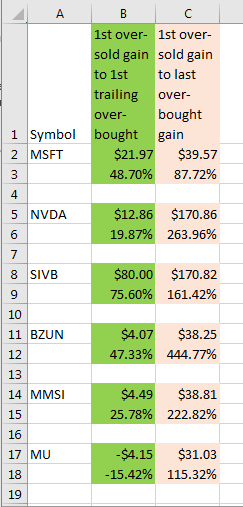
The next screen shot displays another worksheet from the rsi_buys_and_sells.xlsx workbook file.
- For the six stock symbols in the display, five show a positive percentage gain from the gain for the first oversold exit through the first overbought exit. The median percentage gain is between 25.78% and 47.33%.
- Also, the maximum percentage gain showing in column C is typically above 100%. Therefore, if you are planning on using RSI reversals as the sole indicator guiding trading or an important indicator for when to buy and sell stocks, you can clearly enhance trading outcomes by learning what factors cause or allow a stock symbol to have many exits and re-entries to the overbought RSI region.
- In any event, these results point to the likely value of including the RSI in the development of automated systems for selecting buy and sell dates for stocks.
Next Steps
There are two steps necessary for trying out the tips from this script.
- First, you need to download either the full version of the AllNasdaqTickerPricesfrom2014into2017 database from this tip or the abbreviated version of the database from this other tip.
- Second, you must download the T-SQL scripts from this link. The scripts will draw on data in either version of the database or add data to the database. The link will let you download the four T-SQL scripts displayed in this tip as well as two Excel workbook files also covered in the tip.
After you confirm the operation of the scripts, I encourage you to tweak the code in various ways. For example, you may care to modify the window length over which to compute RSI values. Instead of using the commonly used 14-period window, you may care to use a shorter or longer period length; this will affect the frequency of reported reversals. Shorter window lengths discover reversals that are closer together and longer window lengths discover less frequent reversals. You may also care to re-design the computations so that users can specify any window length at run time.
Finally, I close by indicating that this tip is not recommending any particular stocks or even techniques, including those for which results are reported in this tip. The stocks reported on in this tip were selected because I had been watching them as part of my normal investing due diligence. At the time that I submitted this tip to MSSQLTips.com, neither I nor my family members owned any positions in these stocks, but we have owned all of them over the past two years.

Rick Dobson is a SQL Server professional with decades of T-SQL experience that includes authoring books, running a national seminar practice, working for businesses on finance and healthcare development projects, and serving as a regular contributor to MSSQLTips.com. He has been a practicing Python developer for more than the past half decade – with a special emphasis for data visualization and ETL tasks with JSON and CSV files. His most recent professional passions include financial time series data and analyses, AI models, and statistics. If you are interested in growing your skills in any of these areas especially as they relate to financial securities, consider visiting his blog at https://securitytradinganalytics.blogspot.com/2023/12/.
- MSSQLTips Awards: Leadership (200+ tips) – 2025 | Author of the Year Contender – 2017-2024


Hi Mojtaba,
I just want to add that I am currently working on some more content explaining how to compute and use the RSI. If you liked my original tip on the RSI, I am guessing you will find the upcoming content that may appear in about three months even more useful.
Cheers,
Rick Dobson
Mojtaba,
Thanks.
Rick Dobson
It was really great education.
thank you so much.
I hope you and your family are always healthy.