Problem
Performance analysis is one of the most common and practical implementations of multi-variate analysis in real world applications. Performance metrics can be qualitative as well as quantitative, though qualitative metrics are often converted to quantitative for comparison purpose. Performance metrics can be of a very wide variety, in which case the choice of most vital performance metrics becomes important to derive a starting point. This is a common scenario in sports, like the NBA for example. A common requirement would be to compare performance metrics of teams as well as players. In this tip, we will learn how to perform quantitative multi-variate analysis in a scenario where there are too many performance metrics.
Solution
A radar chart is available in Power BI Desktop from the Power BI Visuals Gallery, which can be used for visualizing, comparing and identifying the vital performance metrics from a large pool.
Before we understand the details of the radar chart, we need a real-life dataset which can be used to simulate the problem in question. NBA publishes many performance metrics of players that can be used for the problem in question. One such dataset can be found from here and can also be downloaded from here. The NBA performance dataset requires some understanding of the statistics. Those who are unaware of the NBA game itself or basketball statistics, can read more about the statistics definitions from here.
Below is how the NBA performance dataset looks.
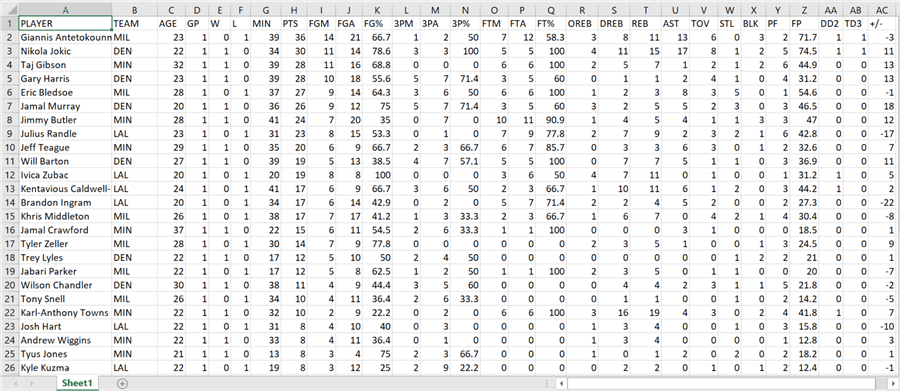
These statistics are published on the NBA website. For easier consumption in a Power BI report, we have copied these statistics into an Excel file.
In order, to study the performance metrics in this dataset in a comparative manner, we will visualize this dataset on a radar diagram in Power BI Desktop. It is assumed that Power BI Desktop is installed on the development machine.
Building a Radar Chart in Power BI
Step 1
The first step is to download the radar chart from here, as it is not available by default in Power BI Desktop. A radar chart is ideal for visually comparing similarities between different entities, relationships and proportions in a dataset. A radar chart is used to display multi-variate data on a common axis from a centrally located starting point, which resembles a radar. You can read more about this chart type from here.

Step 2
After downloading the radar chart control, open Power BI Desktop. You can click on the ellipsis in the visualization tab and select “Import from file” menu option. This will open a dialog box to select the visualization package file, to add the visualization in Power BI. Select the downloaded file and it should add the radar chart to Power BI Desktop visualizations gallery
Step 3
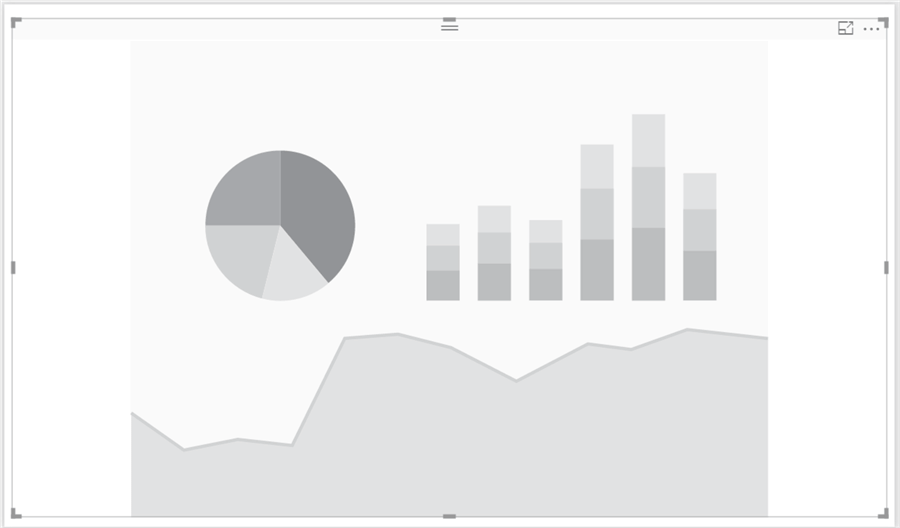
Click on the radar chart and that would add it on the reports layout. Enlarge the control to occupy the screen space and it should look as shown below.
Step 4
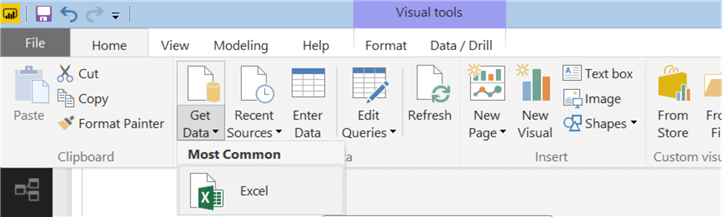
Now that we have the visualization, it is time to populate data. Click on the Get Data menu and select Excel as shown below.
Step 5
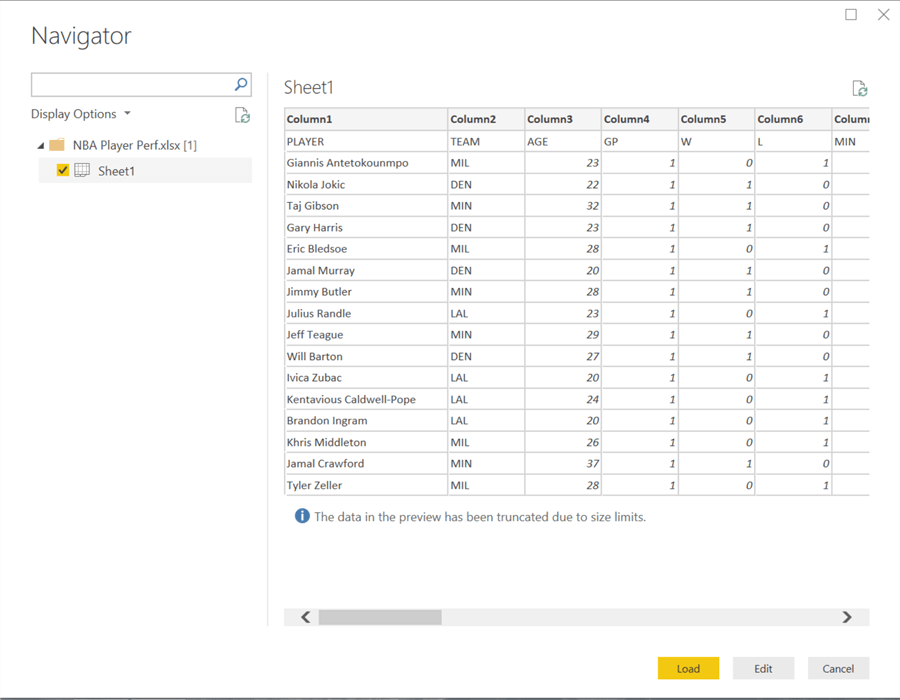
Navigate and point to the Excel file that you would have downloaded earlier. After you select it, you would be able to preview the data as shown below. Select Sheet1 and click on Edit button. We need to modify this dataset so that the first row is used for headers, else we will end up having field names as Column1, Column2 and so on.
Step 6
Click on “Use First Row as Headers” button, and this will use the first row as column headers as shown below. Click on “Close and Apply” button and this would load the dataset.

Step 7
After loading the data, the data model should look as shown below.

Step 8
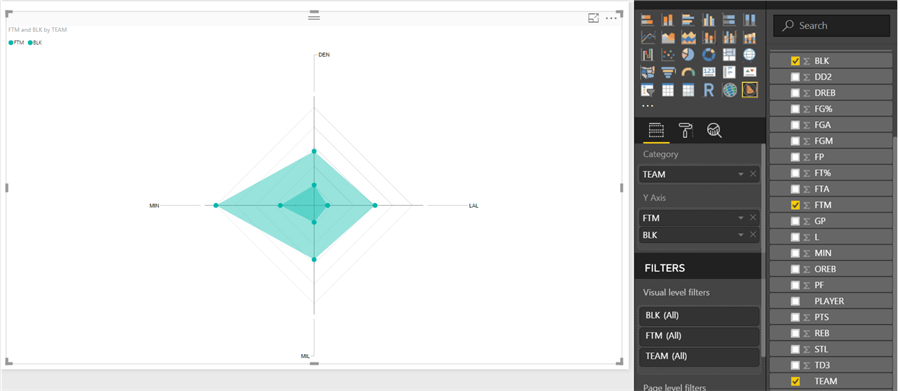
Select the control on the report layout, add Team to Category and FTM to Y-axis. This should bring up the radar chart as shown below. There are four teams which are represented on each axis. If we add all the performance metrics at once, the chart would become too complex and illegible. At this point, we can derive that FTM (Free Throws Made) is highest by team MIN compared to others. The relative position and angle of the axes is typically uninformative in a radar chart. The right way of reading this chart is to assess the distance of the point from the center for any given axis compared to others.

Step 9
Add Blocking performance metric (BLK) to the Y axis and the chart would look as shown below. You can see that two areas are overlaying each other and are of the same color too. Even the BLK metric is high for MIN team compared to others.
Step 10
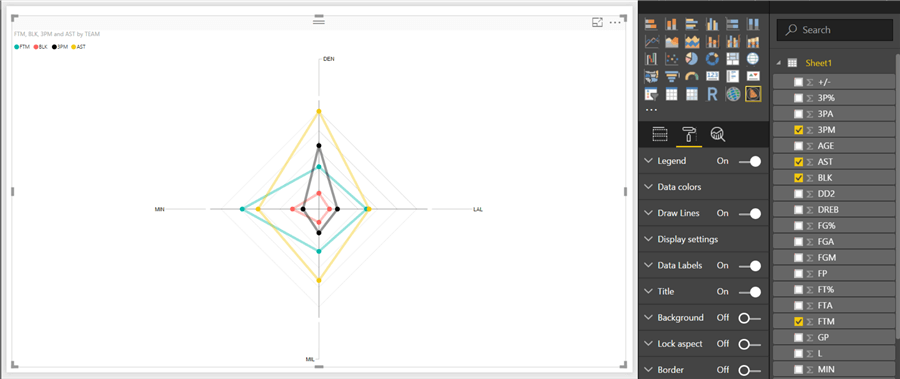
Add three pointer (3PM) and assist (AST) to the Y axis and the chart will look as shown below. Both metrics seem to be higher for team DEN compared to others. These gives quick insight into the nature of the game played by each team comparatively in the perspective of different performance parameters.

Step 11
As the color of each metric is the same, it is becoming increasingly difficult to visualize these metrics. One way to increase the clarity / visibility is by assigning distinct colors to each metric. Navigate to the options menu and assign colors of your choice to each metric as shown below. One point to keep in view is that if multiple metrics represented on the chart has extremely wide ranges (for example one metric values are in range of 0 to 1 and other in the range of 100 to 200), the one with the lower range would become harder to visualize. A recommended solution would be to overlay the metric with the smallest range of values of the top. To increase the visibility even more, we can include metrics with similar ranges on distinct radar charts, if that makes sense from an analysis perspective.

Step 12
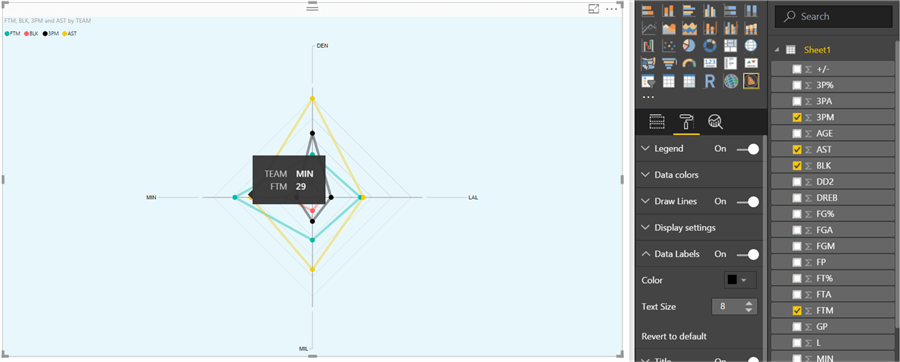
We can enable the Show Lines option to On, which would just show connecting lines instead of an area. The edges or angles are not representative of the values, so can be removed unless two radar charts are being compared.
Step 13
Now the chart clearly shows the categories by colors and the values are clearly visible on the axes. The scale of the axes are not shown (which is a shortcoming in this control) but if you hover your mouse over any point, you will be able to see the values in a tooltip. You can also change the color of the background to make the points more visible.
Step 14
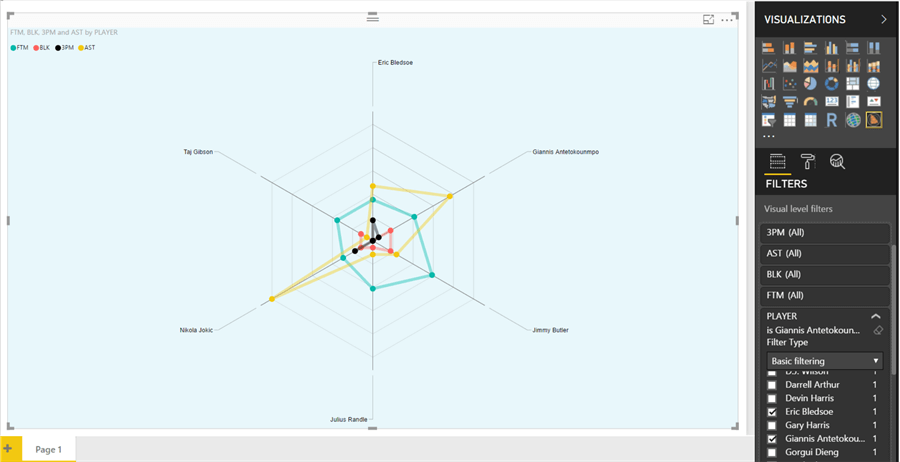
Generally, a team’s performance comparison on a radar chart is a low probability case compared to individual players performance comparison. For this, remove the Team field from the category and add the Player field. As there are so many players in this data set, we may want to select a few players of interest. We can filter players using visual filters as shown below.
Summary
From this chart it is easy to make out that different players have high performance scores in different areas. That is also from the fact that in the NBA, every player has his own position and specific role at that position. Some players may be expected to just shoot, some may have the role of just passing, and some may have the role of just blocking and providing defense. Although some players can perform in all these areas exceptionally. If we are comparing players on performance metrics, it makes sense to compare players having the same role in the game. Using all metrics on a radar chart can make sense if teams are being compared to understand the nature of the game played by a team. In general scenarios too, it makes sense to compare entities at the same level. Comparing performance metrics of a Vice President as well as an entry-level employee on the same radar chart may not make sense.
In this way, we can use radar chart to analyze multi-variate quantitative metrics in a comparative manner with Power BI Desktop.
Next Steps
- Try to work with more metrics from the NBA performance dataset to derive new insights.
- Check out these other Power BI tips.

Siddharth has more than 14 years of experience in the IT Industry, with more than a decade of experience in Business Intelligence and Analytics, for clients banking, logistics, government, Media Entertainment, products, life sciences and other domains. He has been a lead architect for a portfolio of 40+ apps, containing apps in web, mobile, BI, Analytics, data warehousing, reporting, collaboration, CMS, NoSQL and other technologies. He has several certifications and is a published author for online and print-media publications, as well as the MSDN Library.
In his present role, he remains responsible for architecture design, technology stack selection, infrastructure design, 3rd party products evaluation and procurement, and performance engineering. These applications use technologies like Elasticsearch / Lucene, MongoDB, SharePoint 2013 and 2010, jQuery-based framework like Highcharts and GoJS, SQL Server and the Microsoft Business Intelligence stack (SSIS, SSAS, SSRS, MDX, PowerPivot, PowerView), jQueryMobile, Bootstrap, iOS xCode framework, and many others.
- MSSQLTips Awards: Champion (100+ tips) – 2018 | Author of the Year – 2017 | Author Contender – 2016, 2018-2019
