Problem
SQL Server Reporting Services (SSRS) has many revolutionary enhancements in the SQL Server 2016 release [1]. As Larson [2] pointed out, the SSRS user community will continue to grow. Some new SSRS practitioners expect to follow a straightforward tutorial to create a report in several hours rather than studying from several hundred pages of a book or reading many questions on Internet forums. On basis of business requirements and business users’ preferences, the report structure varies from one to the other. A simple report just contains one table that lists detailed information row-by-row. What is the procedure to create this kind of report? We expect that the procedure would be concise but also cover every aspect of delivering a well-designed report to business users.
Solution
I am going to provide detailed step-by-step instructions to create a report, as shown in Figure 1, needed to satisfy business requirements. In the sections that follow we will discuss, firstly, what the Report Definition Language (RDL) is; secondly, how to bring data to a report; thirdly, how to design the report layout; fourthly, how to enable a report manager (or a database administrator) to modify the report; and finally, how to add an external image to the report.

We are going to use data from the AdventureWorks sample database “AdventureWorks2017.bak” [3]. In practice, we usually have some business requirements for creating a report. For demonstration purposes, I extracted some requirements from the “Sales Order Detail” report in the SQL Server Reporting Services Product Samples [4]:
The accounting department at AdventureWorks would like to have a report to list all line items of one sales order. A sales order number is select by business users before they view the report. The report should include detailed information about a line item: line number, quantity, item number, description, tracking number, unit price, subtotal, discount and item total. Below the list is the total amount in the sales order. In addition, business users can print a letter-sized report.
The solution was tested with SQL Server Management Studio V17.4 and Microsoft Visual Studio Community 2017 on Windows 10 Home 10.0 <X64>. The DBMS is Microsoft SQL Server 2017 Enterprise Edition (64-bit).
1 – Report Definition Language (RDL)
RDL is an XML representation of a SSRS report definition that contains data retrieval and layout information for a report [5]. Like other programming languages that give instructions to a computer to perform specific tasks, the RDL tells the report server how to construct a report with data. Thus, we can apply some best practices from other programming languages to the report development.
We can use Report Designer and Report Builder to create a report without knowing anything about RDL. It is noteworthy that the two tools are only RDL generators. We developers should have a programming mindset and need to apply programming principles to make a report flexible and adaptable. For example, we should use views or stored procedures to create datasets. When a table column has been changed, we do not need to update all reports that have referenced this column.
2 – Prepare Data Retrieval for the Report
2.1 Create a data access layer
The business requirements asked us to bring a list of line items in a selected sales order number to the report. The line item information should include line number, quantity, item number, description, tracking number, unit price, subtotal, discount and item total. We are going to use two stored procedures, “sp_sales_order_read” and “sp_sales_order_detail_read” to retrieve a list of sales orders and a list of line items in a specific sales order from the database, respectively, on basis of the queries used in [4]:
CREATE PROCEDURE [dbo].[sp_sales_order_read]
AS
BEGIN
   BEGIN TRY
      SELECT SOH.SalesOrderID, SOH.SalesOrderNumber
      FROM [Sales].[SalesOrderHeader] SOH
         INNER JOIN Sales.Customer C ON SOH.CustomerID = C.CustomerID
         INNER JOIN Sales.Store S ON C.StoreID = S.BusinessEntityID
      ORDER BY  SOH.SalesOrderNumber
   END TRY
   BEGIN CATCH
        DECLARE @ErrorMessage NVARCHAR(4000);
        DECLARE @ErrorSeverity INT;
        DECLARE @ErrorState INT;
        SELECT @ErrorMessage = ERROR_MESSAGE(),
                @ErrorSeverity = ERROR_SEVERITY(),
                @ErrorState = ERROR_STATE();
        RAISERROR (@ErrorMessage, @ErrorSeverity, @ErrorState );
        RETURN 1
    END CATCH
    RETURN 0
END
GO

CREATE PROCEDURE [dbo].[sp_sales_order_detail_read]
   @sales_order_id int
AS
BEGIN
   BEGIN TRY
      SELECT   SOD.SalesOrderDetailID,
               SOD.SalesOrderID,
               SOH.SalesOrderNumber,
               ROW_NUMBER() OVER(ORDER BY SOD.SalesOrderDetailID ASC) AS Line,
               SOD.OrderQty AS Qty,
               P.ProductNumber AS [Item Number],
               P.[Name] AS [Description],
               SOD.CarrierTrackingNumber AS [Tracking #],
               SOD.UnitPrice  AS [Unit Price],
               (SOD.OrderQty*SOD.UnitPrice) AS Subtotal,
               SOD.LineTotal,
               CASE
                  WHEN SOD.UnitPriceDiscount IS NULL THEN 0
                  ELSE 0 - SOD.UnitPrice * SOD.OrderQty * SOD.UnitPriceDiscount
               END AS Discount
      FROM        Sales.SalesOrderDetail SOD INNER JOIN
               Production.Product P ON SOD.ProductID = P.ProductID INNER JOIN
               Sales.SalesOrderHeader SOH ON SOD.SalesOrderID = SOH.SalesOrderID
      WHERE       SOH.SalesOrderID = @sales_order_id
      ORDER BY    SOD.SalesOrderDetailID
   END TRY
   BEGIN CATCH
        DECLARE @ErrorMessage NVARCHAR(4000);
        DECLARE @ErrorSeverity INT;
        DECLARE @ErrorState INT;
        SELECT @ErrorMessage = ERROR_MESSAGE(),
                @ErrorSeverity = ERROR_SEVERITY(),
                @ErrorState = ERROR_STATE();
        RAISERROR (@ErrorMessage, @ErrorSeverity, @ErrorState );
        RETURN 1
    END CATCH
    RETURN 0
END
GO
These two stored procedures construct a data access layer which is placed between the SQL server database and the report server. With the data access layer, DBAs only need to grant EXECUTE permissions on these stored procedures without having a risk of exposing underlying tables [6]. In addition, I have created several derived columns in the second stored procedure rather than asking the report to do the calculations. I would like to point out that the report, like the view component in the MVC pattern, should not contain any business logics.
2.2 Create a Shared Data Source
In a similar way as .Net developers put database connection strings in the config file, we will create a shared database source for all reports. This enables us to configurate database connections for all reports in one central place.
2.2.1 Create a Report Server project
Create an empty Report Server Project in Visual Studio 2017 by selecting the “Report Server Project” template as shown in Figure 2. In my experience, it is more effective to use the WYSIWYG feature of the Report Designer than the wizard template.

Figure 3 shows that a new project has been created. The project has three folders. At this moment, we still cannot create a subfolder under a report server project. If we want to keep our reports well-organized, for example, all sales reports in one folder and all accounting reports in another folder, we can create different projects for each report group.

Right click on the project name “MSSQLTIPS” and select “Properties” item from the context menu. The project property page appears as shown in Figure 4. We need to ensure the “TargetServerURL” should point to the report server. We can find the report server address from the “Report Server Configuration Manager” tool or ask the database administrator (DBA) who installed the SSRS. Other properties in Figure 4 can take default values.
It is worth noting that the default values of “OverwriteDatasets” and “OverwriteDataSources” are “False”. After deployment, we pass the control of reports to report managers or DBAs. The boundary line between report development and report management is often overlooked. Keep in mind that the report deployment should not overwrite any report management configurations.

2.2.2 Add a Shared Data Source
Right click on the “Shared Data Sources” folder in the “Solution Explore” panel and select the “Add New Data Source” item from the context menu. In the pop-up window, enter a value “mssqltips_datasource” for the “Name” box, as shown in Figure 5.

Click on the “Edit” button in the pop-up window, and another pop-up window appears. Select a database server and a database as shown in Figure 6. Click on the “Test Connection” button in the second pop-up window to verify the database connection.

Click on the button “OK” in the second pop-windows to close the window. We notice that the “Connection string” box in the first pop-up window has been automatically populated. Click on the “OK” button to close the window. The shared data source shows up in the “Shared Data Sources” folder, as shown in Figure 7.

3 – Design the Report Layout
We adopt an iterative approach in the report development. In this approach, developers create a report based on the requirements they have gathered, then quickly deliver this report to business users for verification. Developers modify the report according to users’ feedback. After several iterations have been done, both business users and developers understand what the report should look like and how the report should work. We cannot expect that business users give us a comprehensive requirement document when the project starts. The business users usually operate in a mode of discovery [7]. They will have more specific requirements only when they see the report.
After we have completed this report, we can use this report as a template. We usually do not start designing a report from scratch. We can reference an existing report, or business users provide us some ideas. When we have many templates, users just need to pick up one of them. This certainly shortens our development time.
3.1 Add a New Letter-Sized Report
3.1.1 Add a New Report to the Project
Right click on the folder “Reports” in the “Solution Explore” panel, select “Add > New Item” item from the context menu, as shown in Figure 8.

A pop-up window appears as shown in Figure 9. Select the “Report” item and enter “Sales_Order_Detail_Report” for the “Name” box.

Click on the “Add” button in the pop-up window. A new report “Sales_Order_Detail_Report” is added into the project, as shown in Figure 10.

3.1.2 Arrange the Report Layout
Switch to the “Design” tab. Click on any space in the report area, the “Report” menu item appears in the top menu bar, as shown in Figure 11. Click on the commands “Add Page Header” and “Add Page footer” to add a header section and a footer section to the report, respectively.

Click on the menu item “Report Properties…” from the “Report” pull-down menu. In the pop-up window, select “Letter” from the page size drop-down list. Set margins and other report properties as shown in Figure 12. We may increase margins to 0.5in if the printer at our work environment does not support narrow margins(0.25in).

Click “OK” button to close the pop-up window. At end of this step, the report design tab should look like Figure 13. We use the term “report header” to denote the first section in report area, the term “report body” to denote the second and the term “report footer” to denote the third. Strictly, page headers and footers are not the same as report headers and footers. We can use mouse to move the dotted-line to change the height of each section.

From the page configuration in Figure 12, we can obtain the width of the report is 8.0in (8.5-0.25-0.25). To avoid cut-offs, we are going to set the report width as 7.96in. Click on an empty space in the report body. In the “Properties” panel, change the body width to 7.96in as shown in Figure 14. When the report has extra blank pages in the PDF format, we can decrease the report body width to solve this issue.

3.1.3 Add the Shared Data Source to the Report
Right click on the “Data Sources” in the “Report Data” panel. Select the “Add Data Source” command from the context menu, as shown in the Figure 15.

A pop-up window appears. Enter a value “mssqltips_datasource” for the name box. The report uses the shared data source, as shown in Figure 16. Click the “OK” button to close the pop-up window. The data source “mssqltips_datasource” appears under the “Data Source” folder in the “Report Data” panel.

3.1.4 Add Datasets to the Report
Right click on the “Datasets” in the “Report Data” panel. Select the “Add Dataset” command from the context menu, as shown in Figure 17.

A pop-up window appears. Illustrated in Figure 18, we use a dataset embedded in the report. Select the shared data source “mssqltips_datasource” as the report data source and select “Stored Procedure” as the “Query type”. Select the stored procedure “sp_sales_order_read” from the associated drop-list. We also use the stored procedure name as the name of the dataset. The “Dataset Properties” settings should appear like Figure 18. Click the “Refresh Fields” button to verify the database connection. We can switch to the “Fields” panel to view a list of fields in this dataset. Click the “OK” button to close the pop-up window.

Use the same procedure to add another dataset “sp_sales_order_detail_read”. The “Report Data” panel should look like Figure 19. You may notice the naming conventions I used for the datasets. These naming conventions help to map the datasets in the report to the stored procedures in the database.

The use of the stored procedure “sp_sales_order_detail_read” triggered the creation of a report parameter “sales_order_id”, as shown in Figure 19. Right click on the dataset “sp_sales_order_detail_read” and select the “Dataset Properties” from the context menu. Select the “Parameters” panel in the pop-up window. As shown in Figure 20, the report parameter has been mapped to the stored procedure parameter.

Figure 20 – The report parameter maps to the stored procedure parameter
3.2 Assign Available Values to the Parameter
Double click on the parameter name “sales_order_id” in Figure 19. A pop-up window appears, as shown in Figure 21. Change the text in the “Prompt” box to “Sales Order No.”.

Switch to the “Available Values” panel and select “Get values from a query” option. Populate other fields with values as shown in Figure 22.

Click “OK” button to close the pop-up window. Switch to the “Preview” tab. We can select a value for the parameter from a drop-down list, as shown in Figure 23.

3.3 Place a Table Data Region on the Report
The report designer provides different components to organize data into rows and columns. Tables can include row groups, and matrices can have both row groups and column groups [8]. Lists can provide more free-style layout design, but they need more design efforts. Since the report does not include any group, we will use the table data region to list the line item data row-by-row.
3.3.1 Drag a Table Data Region to the Report
Switch to the “Toolbox” panel. Drag the “Table” item over the report body in the “Design” tab and drop it. Select the table in the “Design” tab, and the “Properties” panel should look like Figure 24. In the default setting, the table has two rows: a table header row and a data row.

Make the changes in the “Properties” panel according to Table 1.
| Property | New Value |
|---|---|
| Name | tbl_Sales_Order_Detail |
| DataSetName | sp_sales_order_detail_read |
| Font: FontFamily | Arial |
| Font: FontSize | 9pt |
| Location: Left | 0.05in |
| Location: Right | 0.05in |
| RepeatColumnHeaders | True |
Table 1 – Change the table properties
3.3.2 Add New Columns to the Table
The table item has 3 columns in the default settings. The report has 9 columns: line number, quantity, item number, description, tracking number, unit price, subtotal, discount and item total. Thus, we need to add 6 more columns.
Right click on the middle column of the table and select “Insert Column > Right” item, as shown in Figure 25.

Repeat the “Insert column” step to add 5 more columns into the table. We find the report body width increases automatically when the table expands beyond the right boundary of the report body. We will change the width of the column, table and report body later. When we move cursor over the data cell, an icon representing the field selector will show up in the cell. Click the icon, a list of fields in the dataset appears, as shown in Figure 26.

Select one field from the field selector for each data cell. The table should look like Figure 27.

Switch to the “Preview” tab. Select Sales Order No. “SO43660” from the drop-down list and click on the “View Report” button. The report appears as shown in Figure 28.

3.3.3 Decorate the Table
Switch to the “Design” tab. Click any place inside the table. Two grey bars appear to the left and top of the table, respectively. Click on the left grey bar to select the table header as shown in Figure 29.

With the table header selected, the “Properties” panel shows the row properties. Make the changes in the “Properties” panel on basis of Table 2.
| Property | New Value |
|---|---|
| BorderColor: Default | Black |
| BorderColor: Bottom | DarkSlateBlue |
| BorderStyle: Default | None |
| BorderStyle: Bottom | Solid |
| Color | DarkSlateBlue |
| Font: FontSize | 9pt |
| Font: FontWeight | Bold |
Table 2 – Change the table header properties
Select the data row and make the changes in the Properties panel according to Table 3.
| Property | New Value |
|---|---|
| BorderColor: Default | Black |
| BorderStyle: Default | None |
| Font: FontSize | 9pt |
Table 3 – Change the data row properties
The column width and row height are determined by the size of the contained items. Thereby, we usually set the minimum height and width of the cell by assigning values to the height and width of its contained item.
In practice, we can use mouse to move the boundary of a cell to change the size of the cell. For a quick demonstration, we adjust width of each column in the report table according to Table 4. Since each cell contains text, it is a tricky to select the contained item in a cell. When we move the mouse over a text in the cell, the text will be selected by clicking on the text. When we move the mouse over an empty space in the cell then click on the empty space, the textbox will be selected. The name in the “Properties” panel can tell which item has been selected.
| Column No | Column Header | Size | Text Alignment |
|---|---|---|---|
| 1 | Line | 0.32in, 0.19in | Center (both header and data) |
| 2 | Qty | 0.32in, 0.19in | Center (both header and data) |
| 3 | Item Number | 0.84in, 0.19in | Center (header only) |
| 4 | Description | 2.00in, 0.19in | Center (header only) |
| 5 | Tracking # | 1.10in, 0.19in | Center (header only) |
| 6 | Unit Price | 0.82in, 0.19in | Right (header only) |
| 7 | Subtotal | 0.82in, 0.19in | Right (header only) |
| 8 | Discount | 0.82in, 0.19in | Right (header only) |
| 9 | Item Total | 0.82in, 0.19in | Right (header only) |
Table 4 – Column header, width and text alignment
Then, select the first textbox in the data row and set the height of the textbox to 0.18in through the “Properties” panel. This will change the height of the data row. After we load data into the report, the width may change slightly to avoid wrapped text.
Click on an empty space in the report body, and the report body is selected. Change the width of the body to “7.96in”, as illustrated in Figure 14.
At end of this step, we should obtain a report table as shown in the Figure 30.

3.4 Append a Row with Total Amount to the Table
Select the data row and right click on the grey bar. The context menu appears as shown in Figure 31.

Select the menu item “Outside Group – Below” from the context menu, and a new row appends to the table. Select the first textbox in the new row, set the height to 0.19in. Then, select all cells and right click on any place in the selected cells, a context menu appears as shown in Figure 32.

Select the “Merge Cells” item to merge all selected cells into one cell. De-select the cell and select the cell again. Change the textbox properties according to Table 5.
| Property | New Value |
|---|---|
| BorderColor: Top | DarkSlateBlue |
| BorderStyle: Top | Solid |
Table 5 – Change the row properties
Select the merged cell again, and right click on an empty space in the selected cell. A context menu appears as shown in Figure 33.

Select “Expression…” item from the context menu. In the pop-up window, as shown in Figure 34, select “Datasets” in the Category list, select “sp_sales_order_detail_read” in the “Item” list, and select “Sum(Subtoal)” in the value list.

Double click on the “Sum(Subtotal)” item in the “Values” list. An expression is automatically generated in the textbox, as shown in Figure 35.

Click on the “OK” button to close the pop-up window. Enter the text “Total:” before “<<Expr>>” in the textbox. In the “Properties” panel of the textbox, set the property “TextAlign” to “Right”. Select the text “Total:” and the expression “<<Expr>>”, respectively, and set the property “FontWeight” to “Bold”. Like Microsoft other text editors, we can also change the text properties through the buttons on the top menu bar, as shown in Figure 36. The table should look like Figure 36.

3.5 Format Numbers in the Report
Business users ask to maintain 2 decimal places for any dollar amount. Right click on an empty space in the textbox “Unit Price” in the data row to select the textbox. Select “Textbox Properties…” from the context menu. A pop-up window appears. Set properties as shown in Figure 37. Either using numeric format or currency format is determined by business users.

Click “OK” to close the window. The format property of this textbox in “Properties” panel is automatically set to “#,0.00;(#,0.00)”. Thus, an easy method to apply this format to other textboxes is to set their “Format” properties with the value “#,0.00;(#,0.00)”.
Then, switch to the “Preview” tab. Select a Sales Order No. “SO51739” from the drop-down list. The table spans two pages, and the second page does not have a table header, as shown in Figure 38.
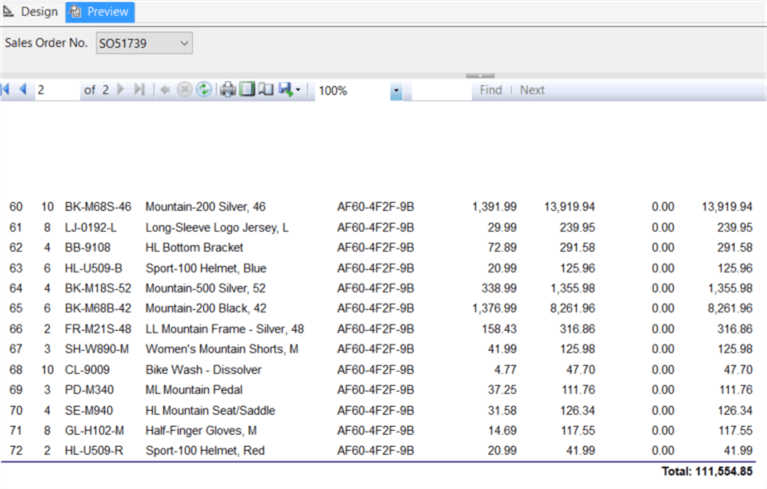
3.6 Add a Repeated Table Header
We have already set the table property “RepeatColumnHeader” to “True” as shown in Table 1. Figure 38 indicates that the table header did not repeat in the second page. We can confirm that we have configured the table properties correctly by looking at the table properties as shown in Figure 39. To access the “Tablix Properties” window, right click on a grey bar of the selected table, as shown in Figure 31, and then click on the “Tablix Properties…” item.

It seems the SSRS does not recognize the column header. To make the column header repeat on the second page, we need to use the “Advanced Model” in the grouping panel. Click on the arrow as shown in Figure 40 and select “Advanced Mode” item from the context menu.

In the “Advanced Mode” panel, click on the first “Static” in the “Row Groups” panel, as shown in Figure 41. In the “Properties” panel, change the property “RepeatOnNewPage” to “True”. We also need to ensure the option “After” is selected as a value of the property “KeepWithGroup”.

Then, switch to the “Preview” tab and Select a Sales Order No. “SO51739” from the drop-down list. The second page has the table header as shown in Figure 42.

3.7 Apply Color to Alternate Rows
To apply color to alternate rows, we use an expression to determine the background color of a row dynamically. Select the data row in the table, and drill down into the “BackgroundColor” property in the “Properties” panel, as shown in Figure 43.

Select “Expression” item from the pull-down menu. In the pop-up window, enter an expression “=iif(RowNumber("tbl_Sales_Order_Detail") Mod 2, "White", "AliceBlue")”, as shown in Figure 44. The value “tbl_Sales_Order_Detail” is the name of the report table.

Switch to the “Preview” tab. With a Sales Order NO. “SO43670” selected, the report looks like Figure 45.

3.8 Add a Report Header and a Report Footer
Like the way we dragged the table item to the report, we drag 3 textbox items to the header section and drag 2 textbox items to the footer section. Then we set the properties of these textboxes according to Table 6. We can set font properties through either the “Properties” panel or the tool bar on the top. The layout should look like Figure 46.

| Textbox No | Size | Text | Font | Expression |
|---|---|---|---|---|
| 1 | 4in,0.22in | Adventure Words Cycles Sales Department | FontFamily: Arial FontSize: 9pt | |
| 2 | 4in,0.22in | Sales Order Detail Report | FontFamily: Arial FontSize: 10pt FontWeight: Bold | |
| 3 | 4in,0.16in | Order #: | FontFamily: Arial FontSize: 8pt | =First(Fields!SalesOrderNumber.Value, "sp_sales_order_detail_read") |
| 4 | 4in,0.16in | Generated at | FontFamily: Arial FontSize: 8pt Color: LightGrey | =Globals!ExecutionTime |
| 5 | 1.0in,0.16in | FontFamily: Arial FontSize: 8pt Color: LightGrey | ="Page " & CStr(Globals!PageNumber) & " of " & CStr(Globals!OverallTotalPages) |
Table 6 – Configure textboxes properties
To position these textboxes in the header and footer sections, we can use Ctrl + arrow keys to move a textbox precisely when a textbox is selected.
4 – Add Configurable Settings to the Report
The SSRS in the SQL Server 2016 release provides a new web portal, which is a web-based application, for report managers to configure reports. We should draw a dividing line between the report development and report management. When the development has been completed, the control of the reports should pass to report managers. The report managers should be able to modify the reports. For instance, the text in the first textbox and text in the second textbox in the header section should be configurable. Thus, the report manager can modify the text in the header section without any development effort.
4.1 Create Parameters
Right click on the “Parameters” folder in the “Report Data” panel. Select “Add Parameter…” menu item in the context menu. A pop-up window shows up and the fill-up form is shown in Figure 47. With the “Hidden” being selected as the parameter visibility, business users will not be asked to provide a value to the parameter, but the report managers can change the default value of the parameter through the web portal.

Switch to the “Default Values” panel. Check the “Specify values” option and click the “Add” button to add a default value “Adventure Works Cycles Sales Department”, as shown in Figure 48.

Click the “OK” button to close the pop-up window. Then drag the new parameter “report_owner” to the first textbox in the header section and delete other words in the box. The report header should look like Figure 49.

4.2 Use Report Metadata
The second textbox in the report header section contains the report name. Since report managers can change the report name through the web portal, we should use the build-in field “ReportName”. Right click on the second textbox. The pop-up context menu is shown in Figure 50.

Select “Expression…” item from the context menu. In the pop-up window, use the expression “=Globals!ReportName” to replace the initial text, as shown in Figure 51.

Click the “OK” button to close the window. The design view of the report should look like Figure 52.

5 – Add External Images to the Report
The report design provides 3 options to reference images. The three options are “Embedded”, “External” and “Database”. The “Embedded” option can always ensure images are available to the report, but images cannot be shared [9]. The report manages also cannot change images through the web portal. If images are part of data, for example product images, it will be preferable to use the “Database” option. For static images, such as a company logo, we should always use “External” option. By using the “External” option, images can be stored in the report server or a web server. In this exercise, we store a company logo in the report server.
5.1 Upload an Image to the Report Server
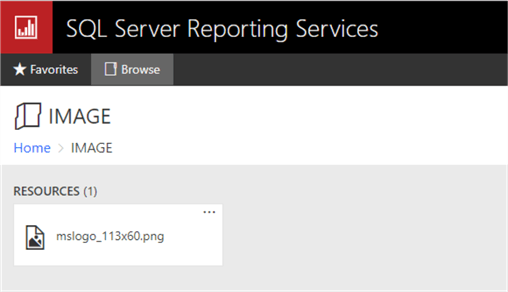
Access the web portal through: “http://<servername>:80/reports”. As shown in Figure 53, select “Folder” item from the “New” pull-down menu. In the pop-up window, enter “IMAGE” as the new folder name and click on the “Create” button to create the new folder. Then, use the “Upload” menu button to upload the logo of mssqltips.com to the IMAGE folder.

Access the IMAGE folder on the web portal. The “IMAGE” folder page should look like Figure 54. In the meanwhile, copy the logo image file into a local folder “C:\Development\workfolder”.
5.2 Configure the Unattended Execution Account
The SSRS provides a special account, the unattended execution account, to retrieve external image files that are used in reports. To configure the account, we first need to create or select a domain account, which should have reduced permission [10].
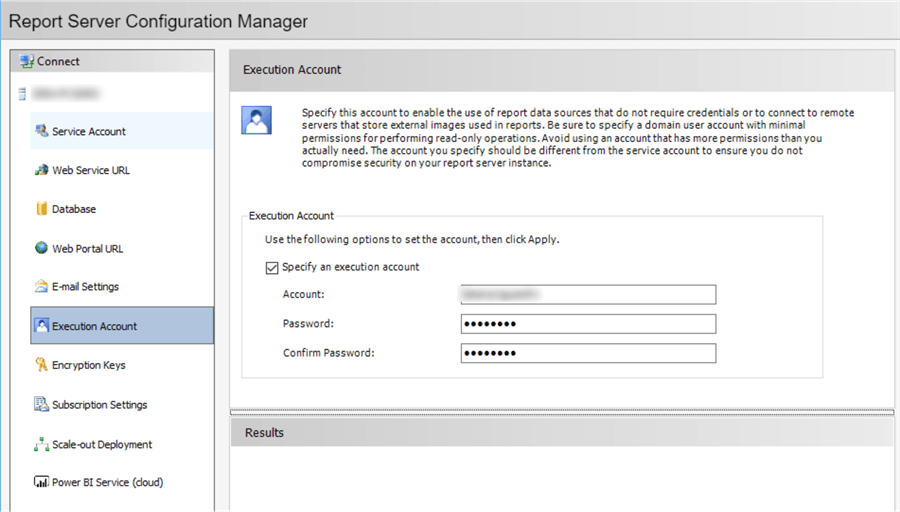
5.2.1 Specify the Unattended Execution Account
Run the “Report Server Configure Manager” from the start up menu and switch to the “Execution Account” panel. As shown in Figure 55, the description on the right panel is very informative. Check the “Specify an execution account” checkbox. Then, enter the account name and password. Click the “Apply” button to apply the changes.
5.2.2 Configure a Folder Security
Go back to the web portal and click the “…” on the top-right corner of the IMAGE folder. Select “Manage” menu item from the pop-up menu. The browser reaches the “Home > IMAGE > Manage > Properties” page. Click the “Security” link button on the right panel and access the “Security” page, as shown in Figure 56.

Click on the “Add group or user” link button, assign the unattended execution account to the “Browser” role, as shown in Figure 57.

Click the “OK” button and the browser switches back to the “Security” page which should look like Figure 58.

5.3 Add the Image to the Header Section
Drag an Image item from the toolbox to the report header section. A pop-up window appears. Name the image as “logo” and select “External” option as a value of the image source, as shown in Figure 59.

Click on the “fx” button beside the “Use this image” box, enter the following code in the “Set expression for: Value” box in the pop-up window:
=IIF(Globals!ReportServerUrl is Nothing,
"file:C:\Development\workfolder\mslogo_113x60.png",
Globals!ReportServerUrl + "?/IMAGE/mslogo_113x60.png")
The expression reveals the report will use the image file in the local computer when we view the report on the “Preview” tab, and the report will use the image through http:// <servername>/reportserver?/IMAGE/mslogo_113x60.png when we view the report from the report server. The box should look like Figure 60. Click on the “OK” button to close the pop-up window. Click the “OK” button to close the “Image Properties window”.

Move the Image item to a desired location as shown in Figure 61. Sometimes, we need to go back to the “Image Properties” window to set up the image size properties. Switch to the “Preview” tab. Select Sales Order No “SO43680”. We should obtain a report which looks like Figure 1.

5.4 Access the Report through the Web Portal
5.4.1 Deploy the Report to the Report Server Through Visual Studio
Right click on the report project in the “Solution Explore” panel. Select the “Deploy” item from the context menu, as shown in Figure 62.

Figure 63 shows the confirmation of the deployment.

5.4.2 Access the Report through the Web Portal
Access the web portal through “http://<servername>/reports/” and drill down into the “MSSQLTIPS” folder. As shown in Figure 64, the new report is in the folder.

Double click on the report and select “SO44110” as the “Sales Order No.”. The report should look like Figure 65. Since my development environment and the report server are in the same computer, we doubt the report server may pick up the logo from the folder “C:\Development\workfolder”. However, to ensure this has not happened, we can delete the logo from the local folder and access the report again.

Drill down into the “Save” icon, select the “PDF” item from the pull-down menu, as shown in Figure 66. The report is exported into the local computer.

Open the PDF file, the window should look like Figure 67. If there is an extra blank page, we need to check the report body width, which should be 7.96in.

5.4.3 Modify the Report Header Through the Web Portal
Since we have made the first two textboxes and the logo in the report header section be configurable, report managers can use the web portal to modify the report.
Access the page “Home > MSSQLTIPS > Sales_Order_Detail_Report > Manage > Parameters” through the Web Portal, as shown in Figure 68, and change the default value of the “report_owner” parameter to “Adventure Words Cycles Accounting Department”. Click the “Apply” button.

Click on the “Properties” link on the left panel. Change the report name on the “Properties” page as shown in Figure 69. Click the “Apply” button.

Upload a new logo file to the report server to overwrite the existing logo file. Figure 70 shows a modified report header section.

Summary
In this tip, we have walked through a process to create a well-designed report. We have reviewed the concept of RDL and emphasized a point that we should have a programming mindset in the report development process. We have added a shared data source and two datasets to the report. The table data region has been used to list data row-by-row. We also demonstrated a trick to show the table header on every page. To enable report managers to modify the report, we have created a hidden parameter with a default value and replaced the report name in the header section with the build-in field. Finally, we have presented an approach to add an external image to the report.
References
[1] Priyankara, D. & Cain, C. R. (2016). Server 2016 Reporting Services Cookbook. Birmingham, UK: Packt Publishing.
[2] Larson, B. (2016). Microsoft SQL Server 2016 Reporting Services (5th Edition). New York, NY: McGraw-Hill
[3] Kess, B. (2017, December 12). AdventureWorks sample databases. Retrieved from https://github.com/Microsoft/sql-server-samples/releases/tag/adventureworks.
[4] MSFTRSProdSamples: Microsoft SQL Server Product Samples: Reporting Services. Retrieved from https://archive.codeplex.com/?p=msftrsprodsamples.
[5] Guyer, C., Hamilton, B., Sparkman, M., Rabeler, C., Petersen, T., Kumar, S., Howell, W. J., & Milener, G. (2017, March 13). Report Definition Language (SSRS). Retrieved from https://docs.microsoft.com/en-us/sql/reporting-services/reports/report-definition-language-ssrs?view=sql-server-2017.
[6] Jin, Y. S., Wenzel, M., Latham, L., Hoffman, M., Jones, M., Blome, M. & Guyer, C. (2017, March 29). Managing Permissions with Stored Procedures in SQL Server. Retrieved from https://docs.microsoft.com/en-us/dotnet/framework/data/adonet/sql/managing-permissions-with-stored-procedures-in-sql-server.
[7], Inmon, H. W. (2005). Building the Data Warehouse (4th Edition). Indianapolis, IN: John Wiley & Sons
[8] Sparkman, M., Milener, G., Howell, W. J., Guyer, C. & Rabeler, C. (2017, March 13). Tables, Matrices, and Lists (Report Builder and SSRS). Retrieved from https://docs.microsoft.com/en-us/sql/reporting-services/report-design/tables-matrices-and-lists-report-builder-and-ssrs?view=sql-server-2017.
[9] Sparkman, M., Milener, G., Howell, W. J., Guyer, C. & Rabeler, C. (2017, February 28). Images (Report Builder and SSRS). Retrieved from https://docs.microsoft.com/en-us/sql/reporting-services/report-design/images-report-builder-and-ssrs?view=sql-server-2017.
[10] Ghanayem, M., Milener, G., Howell, W. J., Guyer, C. & Sparkman, M. (2017, May 30). Configure the Unattended Execution Account (SSRS Configuration Manager). Retrieved from https://docs.microsoft.com/en-us/sql/reporting-services/install-windows/configure-the-unattended-execution-account-ssrs-configuration-manager?view=sql-server-2017.
Next Steps
- I have placed my focus on creating a report that is ready to be used in a work environment. We firstly make the report work for business users. Then, we can play with all these features provided by SSRS to make the report work better. If you want to know some data regions or SSRS features in more depth, the books [1] and [2] are good references. If this is your first report in your organization, it is a good time to work with your business users and your co-workers to compile some reporting conventions (for example, report layout, font size, and text alignment). This helps to maintain consistency in your organization.
- Check out these related tips:
- What's New for SQL Server Reporting Services 2016 Q&A
- Installing SQL Server Reporting Services 2017
- SQL Server Reporting Services 2017 Setup
- SQL Server Reporting Services (SSRS) Repeating Headers on Pages
- SQL Server Reporting Services Image Source Report Options
- Rendering images from a database on SSRS reports
- SQL Server Reporting Services Custom Code Assemblies
- Alternate Row Background Color in SQL Server Reporting Services Tablix and Matrix
- SQL Server Reporting Services Formatting and Placeholders

Nai Biao Zhou has twenty years of experience in software development, with strong analytical skills and a broad range of computer expertise.
He has fifteen years of experience in development and maintenance of database applications on SQL Server in OLTP/OLAP/BI environments.
He has a master’s degree in Control Engineering and is pursuing a Master of Science degree in Predictive Analytics.
Knowledge/Skills
Advanced computer programming skills and well versed with C/C#, Java, ASP.NET, JavaScript, and SQL.
In depth knowledge of Solution Architecture, and Software Development Life Cycle (SDLC).
Microsoft Certified Application Developer (MCAD) since 2004.
- MSSQLTips Awards: Author of the Year – 2021 | Rising Star (50+ tips) – 2024 | Author Contender – 2020, 2023
Great article! Helped me a lot with shared images for reports.
Thank you!!!
One of the best article on internet, thank you so much sir.
Explanation is also brilliant.