By: Gauri Mahajan | Comments (1) | Related: > Azure Data Studio
Problem
Azure Data Studio is a free multi-platform database tool with built-in support for both SQL Server on-premises and Azure SQL Databases. These databases can be accessed in Azure Data Studio for numerous tasks like query editing, data development, built-in charting of T-SQL queries, etc. In an organization, database designers, analysts and administrators work closely together for SQL Server database performance tuning and optimization through diverse methods. Database developers or administrators often have a need to track usage for usage-based performance optimization using mechanisms like monitoring index usage, memory allocation, etc. of large datasets on a regular basis. For this, accessing this information in a convenient method rather than executing some scripts or reports repeatedly will be a better choice for data professionals. In this tip, we will learn one of the techniques to address this problem.
Solution
Azure Data Studio users can add customized widgets to the default dashboards which can be used to track and access performance of databases. We can turn the T-SQL query result set into interesting charts and graphs like donut, pie, table, etc. using the Chart tab in Azure Data Studio. With basic JSON configuration of these visualizations, an effective custom insight widget can be created.
Azure Data Studio offers building customizations without making use of any other language other than T-SQL and some basic JSON configuration, which is generated for the users by the tool itself. One thing to note is that Azure Data Studio, formerly known as SQL Operations Studio, is not a replacement for SQL Server Management Studio (SSMS), but is a supportive tool to SSMS. It supports Windows, MacOS and Linux platforms as well.
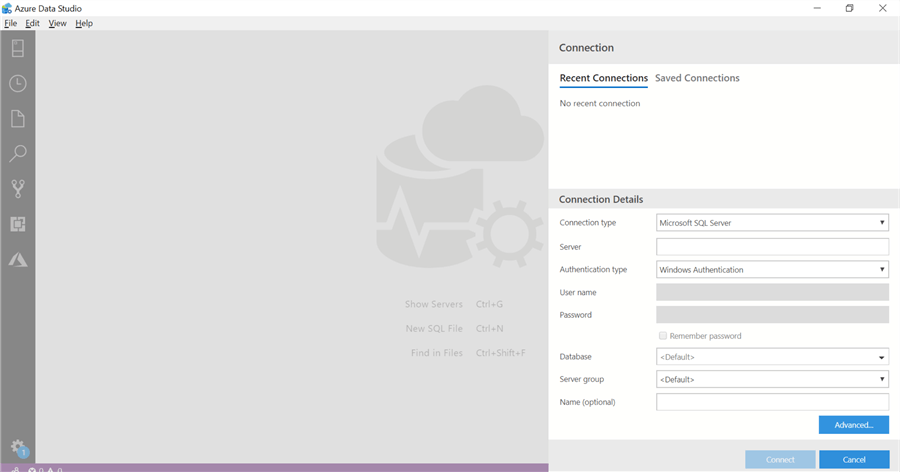
Before we proceed and start working with Azure Data Studio, we need to ensure that the system has access to SQL Server. In case, you do not have Azure Data Studio, refer to this site to download Azure Data Studio. Once, it is downloaded, open the application (exe file) by double clicking on it. When you open it for the first time, the following Connection dialog appears on the right side of the screen.
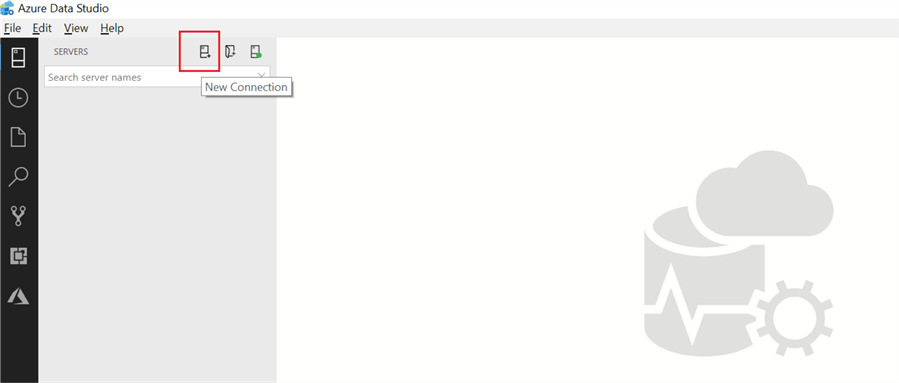
In case it does not appear, you can click on the New Connection button in the SERVERS section.
Connecting default Dashboards in Azure Data Studio
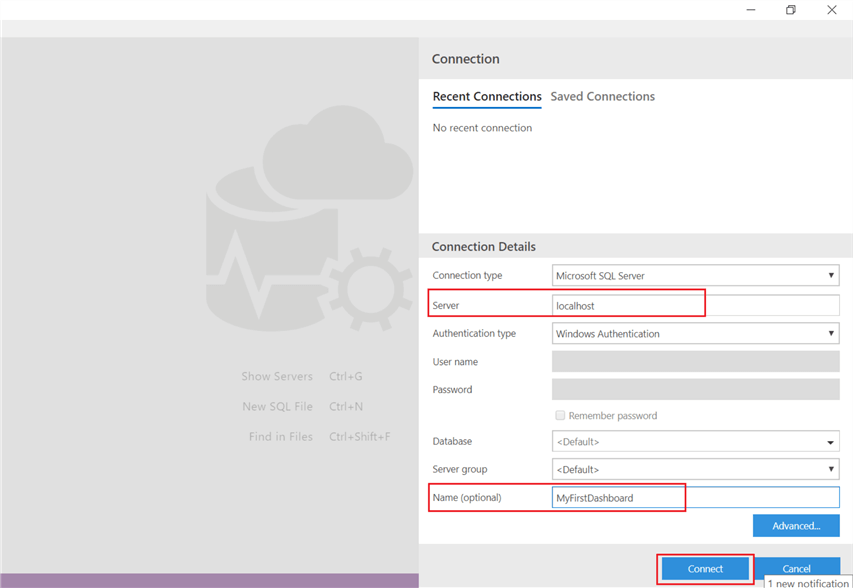
We will connect to a local on-premises instance of SQL Server using Windows Authentication. You can opt to use a SQL Login as well and Azure Active Directory if you are working on Azure SQL Database. You can refer to a particular Database that you would like to access, however, we will not select any value for this field and leave it as <Default> for now. Let's quickly specify Name (which is optional here) as 'MyFirstDashboard' for this new connection and then hit the Connect button.
Server Dashboard in Azure Data Studio
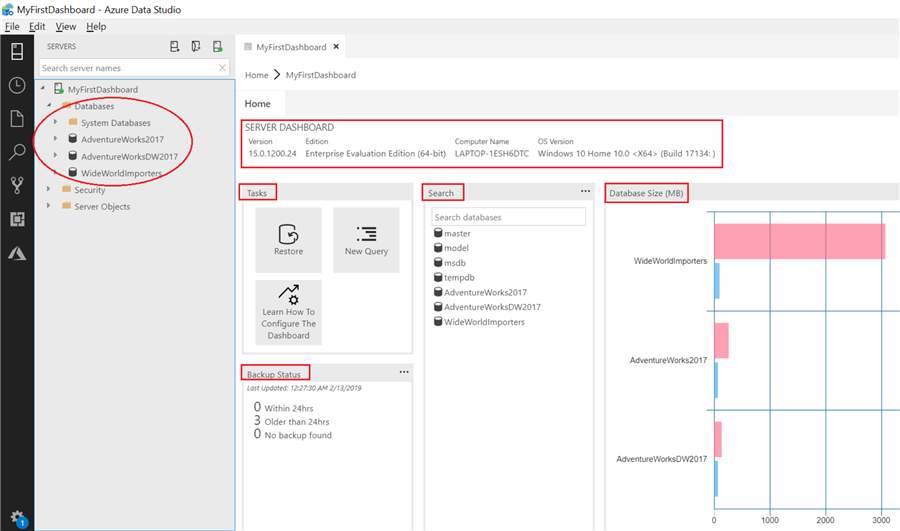
Once the connection is made, SERVER DASHBOARD information about the server is displayed on the home page of Azure Data Studio. A list of Databases present in the local instance of SQL Server can be seen on the top-left of the screen. Fundamental statistics like Version and Edition of SQL Server that is connected, and Computer Name and OS Version that supports this instance are shown on the top section of the screen. Server Dashboard offers a number of Tasks like restoring, opening a New Query on the Dashboard, and Backup history status. Additionally, it provides a Search capability to look for databases (and hence tables available) and shows the sizes of Databases graphically in MB.
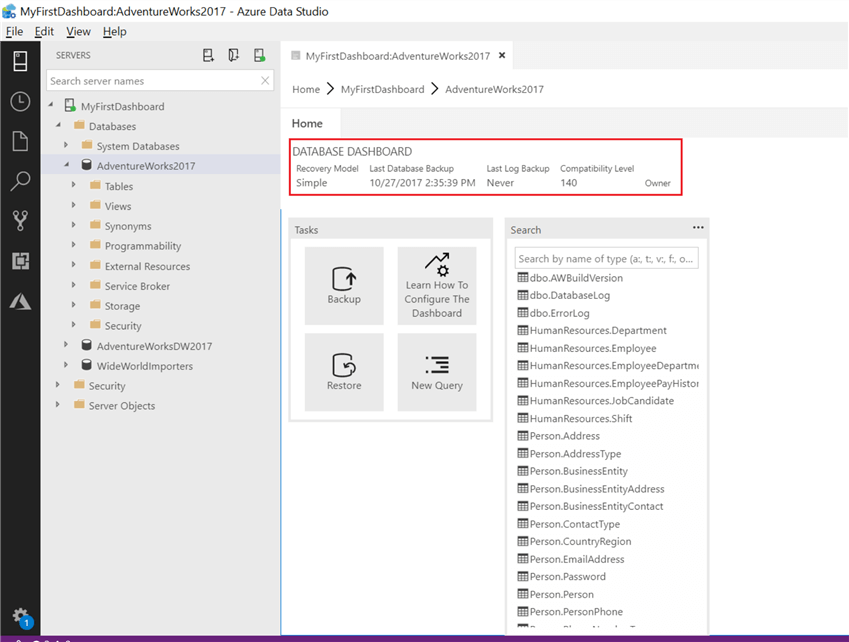
Database Dashboard in Azure Data Studio
You can switch to Database Dashboard from Server Dashboard either by double clicking a Database name or right clicking on the Database name and select Manage. We intend to use AdventureWorks2017 database in this tip. Database specific details are displayed right below the Database Dashboard header name.
Alternatively, you can create a new database and table in the tool itself and also do some data insertions by running queries. There is a straight forward method explained in this link which you can refer to for creating sample data of your own.
Customizing Database Dashboard in Azure Data Studio using T-SQL code
Click on the New Query icon under the Tasks section, this will open a new blank query window. If you notice, this query editor is much simpler and convenient to use than the Database Engine Query Editor in SSMS. However, the query editor in Azure Data Studio is a graphical query editor and provides a more advanced experience with great features like fast intellisense, ability to create custom T-SQL code snippets, source control integration, custom-built dashboards, etc. It also allows you to save a result set in CSV, Excel, JSON and XML formats.
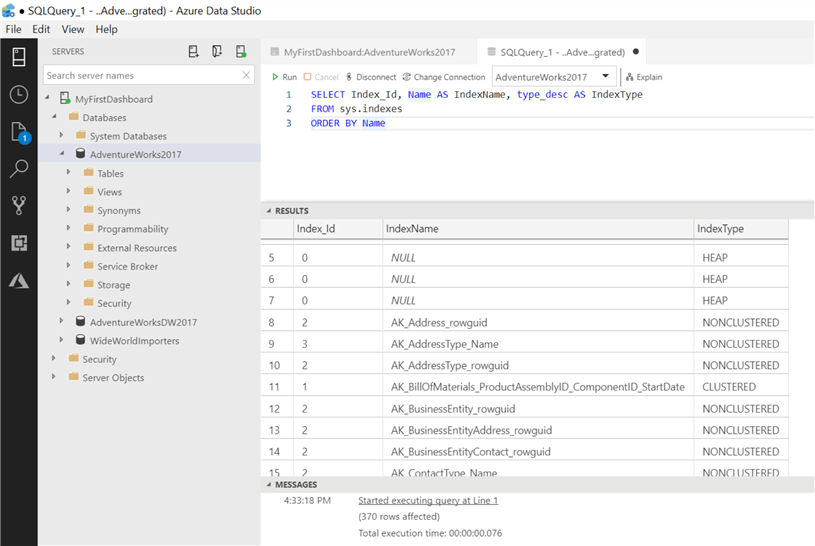
Let's jump into customizing dashboards using T-SQL queries and a very basic JSON configuration. Paste the following snippet into the blank query window and hit Run. This query is executed against DB AdventureWorks2017 and returns the ID number, name and type of all indexes for the objects like table, view, functions in the AdventureWorks2017 database.
SELECT Index_Id, Name AS IndexName, type_desc AS IndexType
FROM sys.indexes
ORDER BY Name
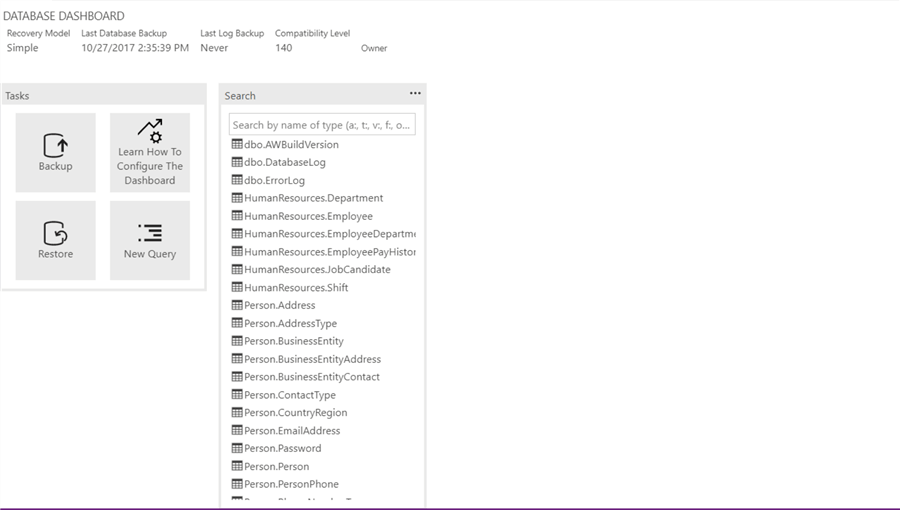
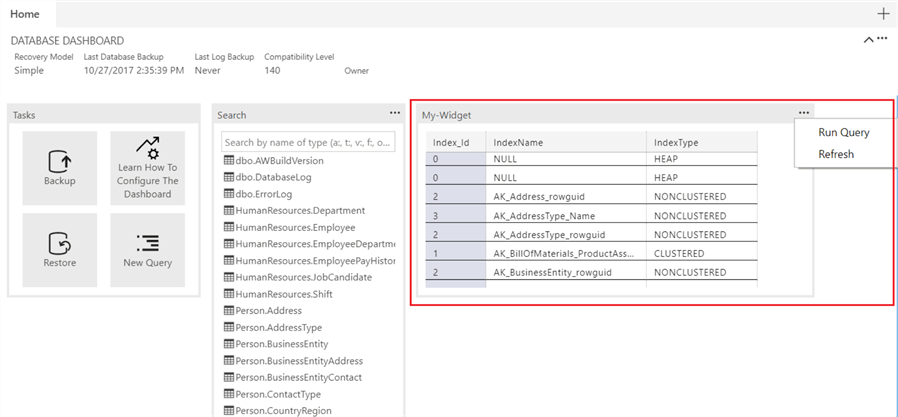
Our Database Dashboard looks like below as of now. We will try to incorporate a new widget (that displays a list of indexes used) on this dashboard using the above query.
Let's walk through a couple of steps that we will need to customize dashboards.
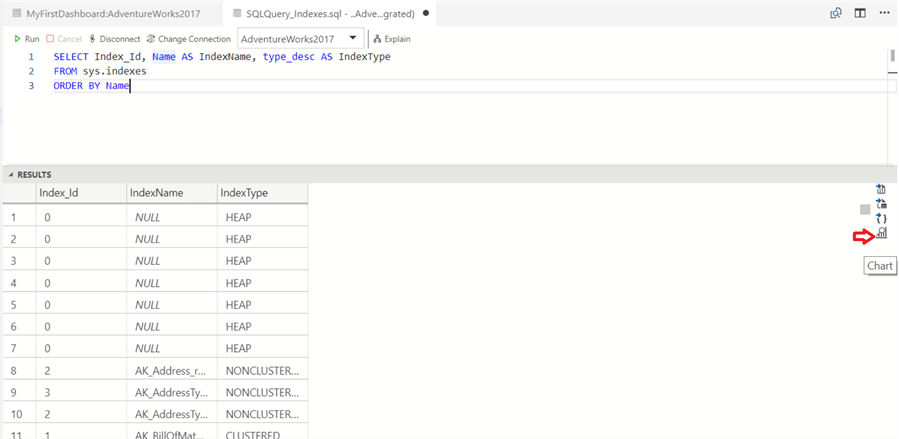
1. Save SQL script - Save the query that we just ran above in the query editor. Name it SQLQuery_Indexes.sql and save in the default location provided by Azure Data Studio.
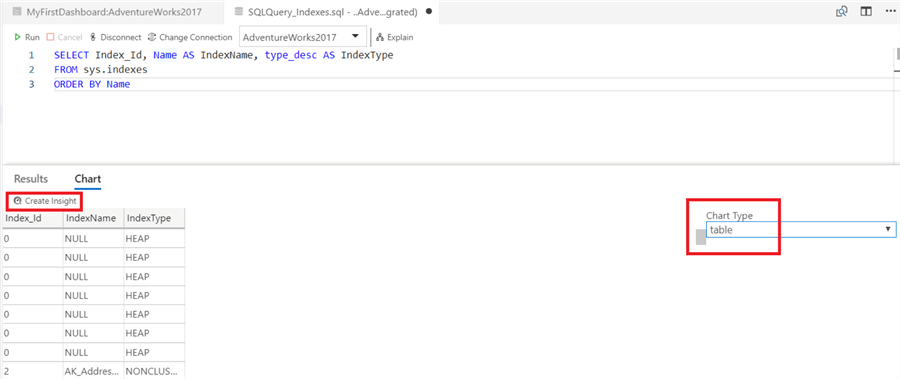
2. Select Chart type - Once the query is saved, run it again and click on the Chart icon present in the right bottom section of the RESULTS screen as shown below. A new Chart tab is opened when we click on the Chart icon. By default, the Chart Type is set as bar. Since, we would like to show the output as a table Chart Type, we will switch the bar type to table type as shown on the right.
3. Create Insight - We will have to generate JSON code in order to modify the dashboards on Azure Data Studio. Click on Create Insight header which is seen right above the table in the Chart tab.
Once you click the Create Insight header, JSON code is generated in a new tab as a single line of text. This JSON code references the SQL file (that we saved and executed above). We will have to modify user settings of the Database Dashboard and include this JSON code to incorporate the new widget on the dashboard. Let's copy this single line of code for now.

4. Making changes to User Settings - Use keyboard shortcut "Ctrl+," to open the User Settings page in Azure Data Studio. In order to override the default user settings for Database Dashboard, we will need to find the widget code for Database Dashboard in the default User Settings file. To achieve this, let's quickly type "dashboard.database.widgets" in the search text box as shown below. Hovering over the pencil icon (marked in the red circle in the screenshot below) highlights dashboard.database.widget node, click on this pencil icon and select the Copy to Settings option.
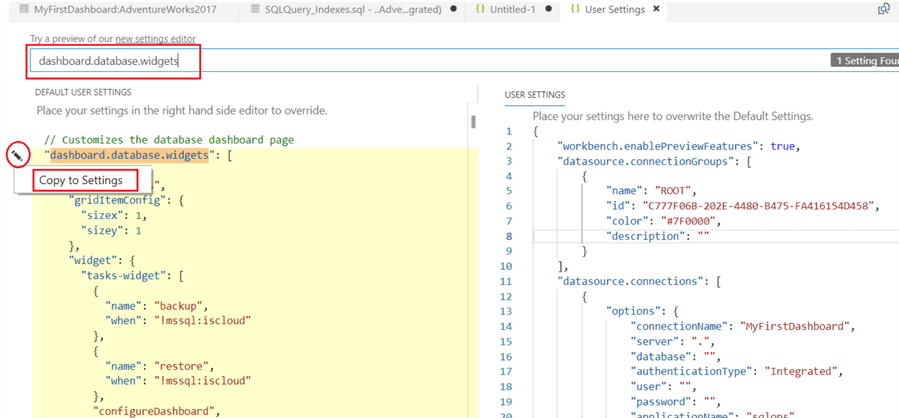
This will replicate the code in User Settings section on the right-hand side of the screen as shown below.
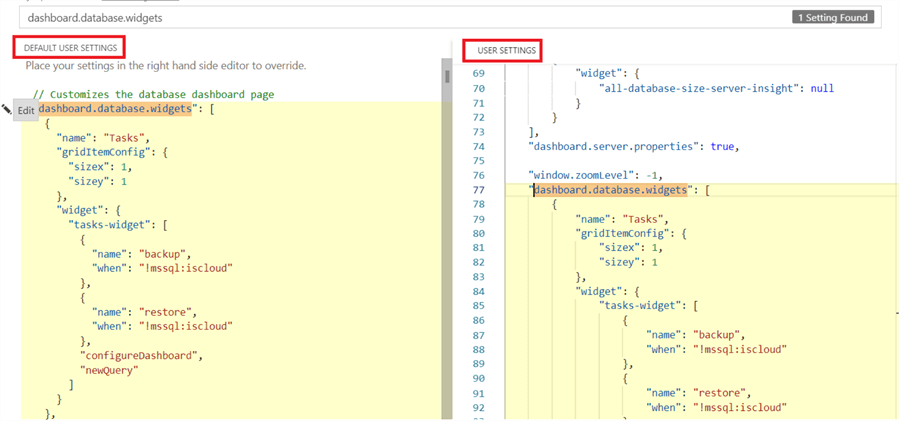
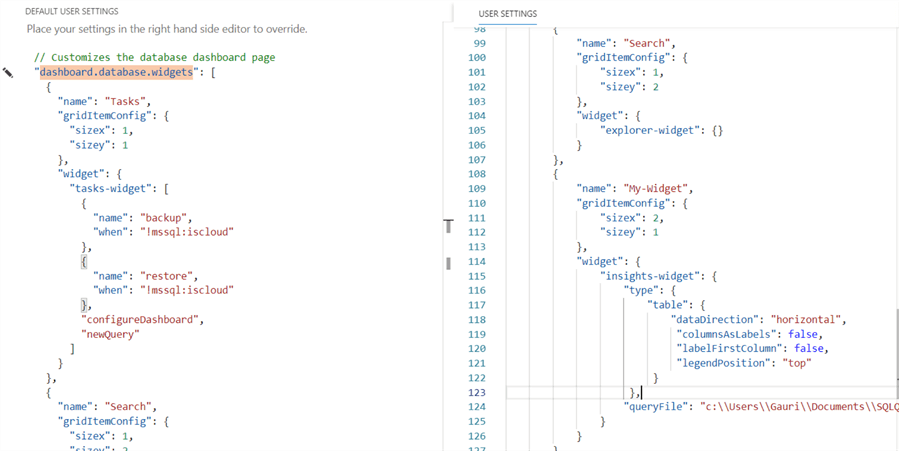
Paste the code that we copied in step 3 above to the dashboard.database.widgets node section and save the file. You can format the copied code by selecting Format Document option on right clicking it. Also, we can provide a new name of the widget by modifying it in the code, we are using the default name i.e. "My-Widget". The new widget code is added to the User Settings file as shown below. Make sure to save this configuration file.
After saving Settings file, double click Database name (AdventureWorks2017) and you will notice a new custom widget is included on the Database Dashboard. Two options Run Query and Refresh are provided when you click on the ellipsis on the main header of My-Widget.
Adding details to a custom widget in Azure Data Studio
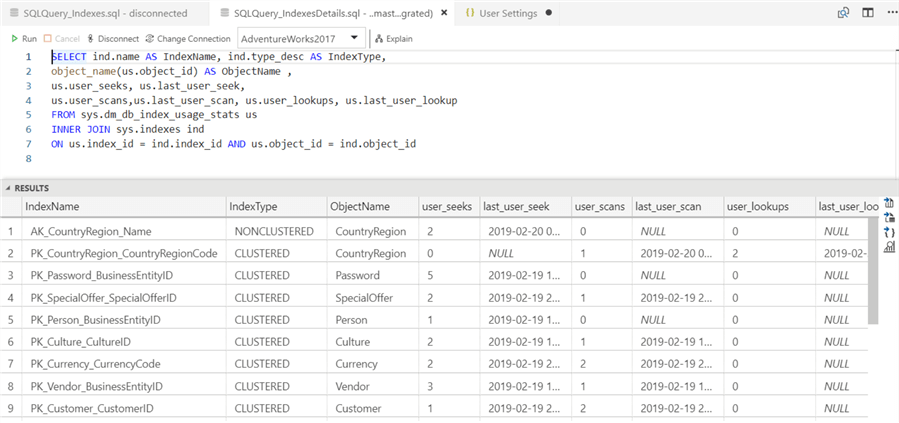
There is one more interesting feature in Azure Data Studio that lets us create an insight details page with drill in information for each element listed in the high-level custom widget. We will have to write a separate SQL query to define data in Details page. Let's go ahead and see how to implement this. Open a new query editor by pressing Ctrl+N. Paste the following snippet into the query window and press Run. We are saving it under name SQLQuery_IndexesDetails and in the default location.
SELECT ind.name AS IndexName, ind.type_desc AS IndexType,
object_name(us.object_id) AS ObjectName ,
us.user_seeks, us.last_user_seek,
us.user_scans,us.last_user_scan, us.user_lookups, us.last_user_lookup
FROM sys.dm_db_index_usage_stats us
INNER JOIN sys.indexes ind
ON us.index_id = ind.index_id AND us.object_id = ind.object_id
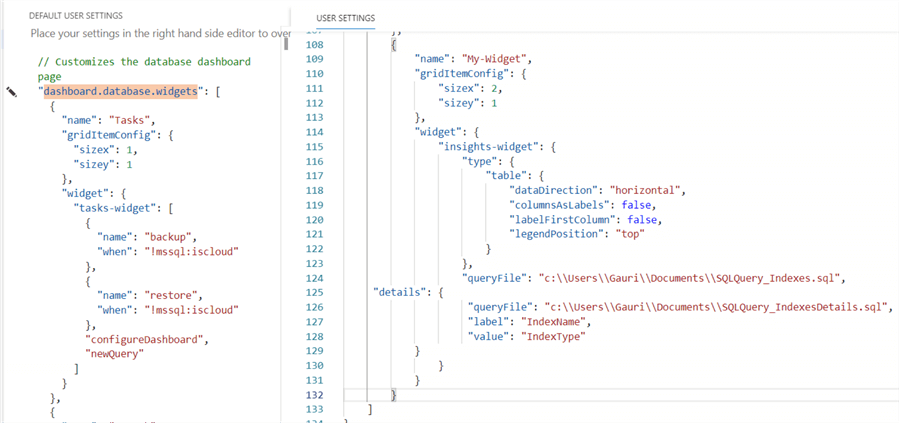
Reiterate steps 2 and 3 for this SQL query. Just to make sure, we are following it correctly, with these steps, Table Chart Type is selected and JSON code is copied after generating it by clicking on Create Insight header in the Chart tab. JSON code references SQLQuery_IndexesDetailsquery here. Open User Settings using keyboard shortcut (Ctrl +,) to edit the existing dashboard.database.widget node to incorporate Details query data as shown below.
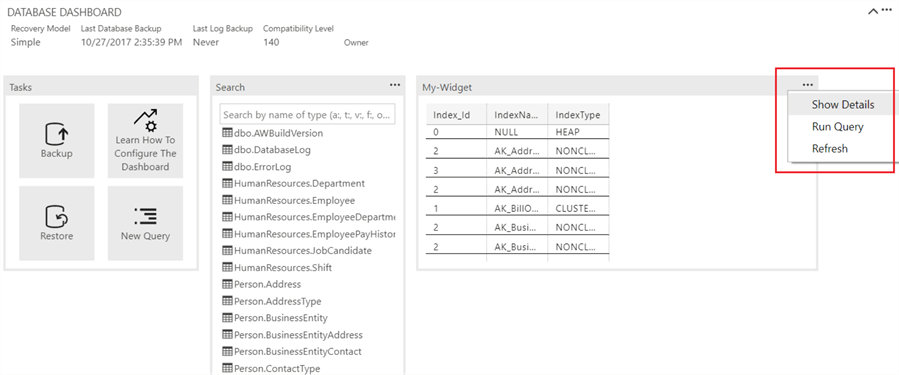
Double click on DB AdventureWorks2017 and click on ellipsis on My-Widget. One more option named "Show Details" is added to the list as shown below.
Click on Show Details and Insights details page is displayed on the right side of the screen. This screen comprises of two sections. The top half of the screen is called summary view and two columns shown in this view are defined by the label and value properties that we configured in the JSON code. Bottom half of the screen displays the full list of column information when a particular row is selected in the summary view.
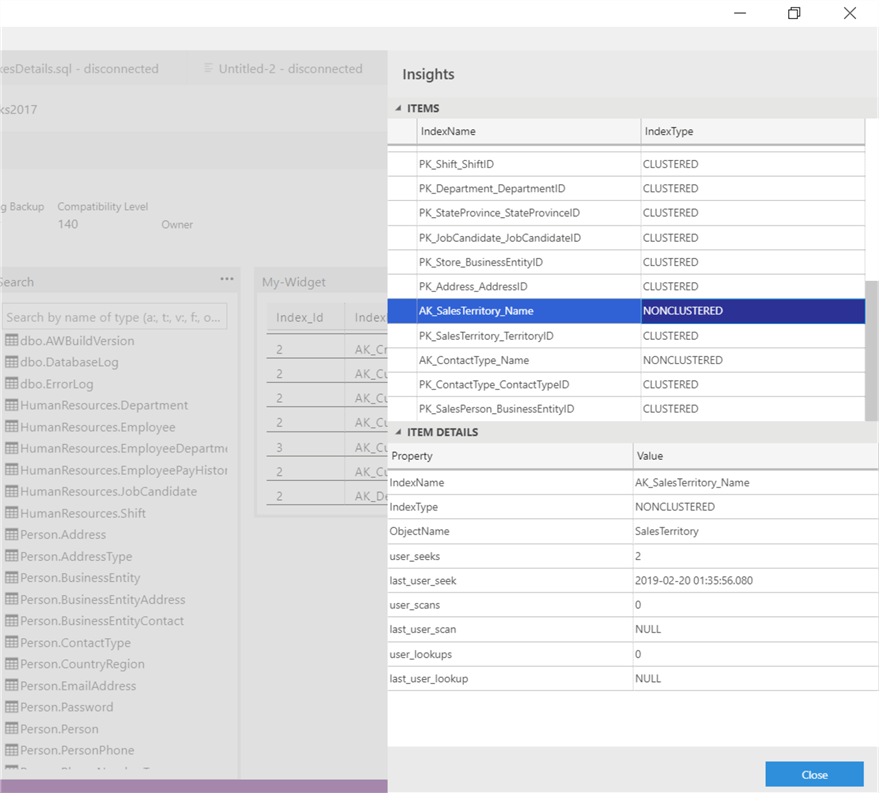
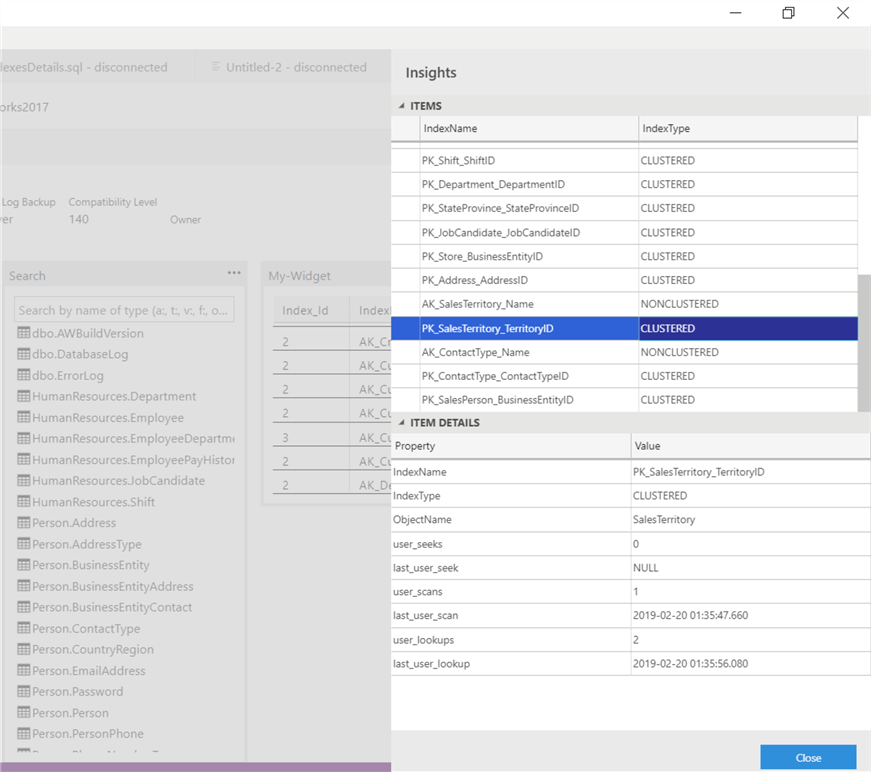
Click on summary row in the Items section to see details for that particular row in the bottom half of the flyout of the insights details page.
Summary
Azure Data Studio supports building custom-made dashboards using a T-SQL query, its result set and simple JSON configuration. We also saw, how we can display further detailed information using an insight details query. We exhibited the process to customize Database Dashboards in this tip. Server Dashboard can also be modified in a similar way.
Next Steps
- With the basics explained here, try creating rich and complex customizations on both server and database dashboards in Azure Data Studio.
- You can also try building widgets for different Chart Types like bar, pie, donut, etc. and orientations for vivid visualizations.
- Refer to this link to learn more about Azure Data Studio.


About the author
 Gauri Mahajan is very passionate about SQL Server Reporting Services, R, Python, Power BI, the Database engine, etc. and enjoys writing.
This author pledges the content of this article is based on professional experience and not AI generated.
View all my tips
