Problem
Metrics or Key Performance Indicators (KPIs) play a crucial role in monitoring business progress in any organization. There are key influencers that impact the KPI values to go up and down. Knowing what all factors influence KPIs in an industry, helps organizations make informed business decisions to either meet their goals or apply business strategies to target the right areas. With the February 2019 release, Power BI has introduced its first ever AI-driven visual known as Key Influencers to comprehend the behavior of major factors that impact key metrics. In this tip, we will learn how this visual works and also how it is beneficial to an organization.
Solution
The key influencers visual helps to understand the factors that drive KPIs. Once a metric that we want to analyze is selected, the key influencers visualization helps investigate what matters the most in driving that metric. This visualization makes use of machine learning under the covers to analyze data and provides interesting insights about the key drivers impacting the metric that we want to analyze. The main advantage of this visual is, it lets us analyze a metric from various perspectives, without the need of keeping any influencer(s) constant.
Importing Key Influencers Visual in Power BI Desktop
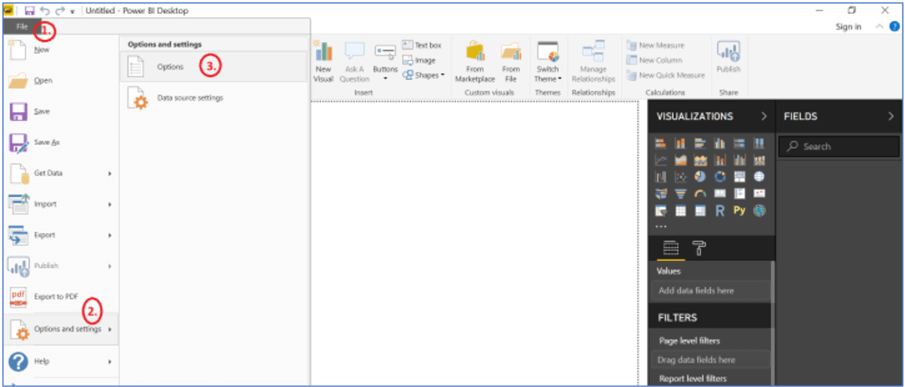
In order to get started, we need to ensure that Power BI Desktop is installed on the system. In case, it is not available, you can download it from here. Since, this visual is not in GA yet, we will have to enable it in Power BI by enabling preview options in the Options Dialog. To do so, open Power BI Desktop application and select File > Options and settings > Options as shown below.
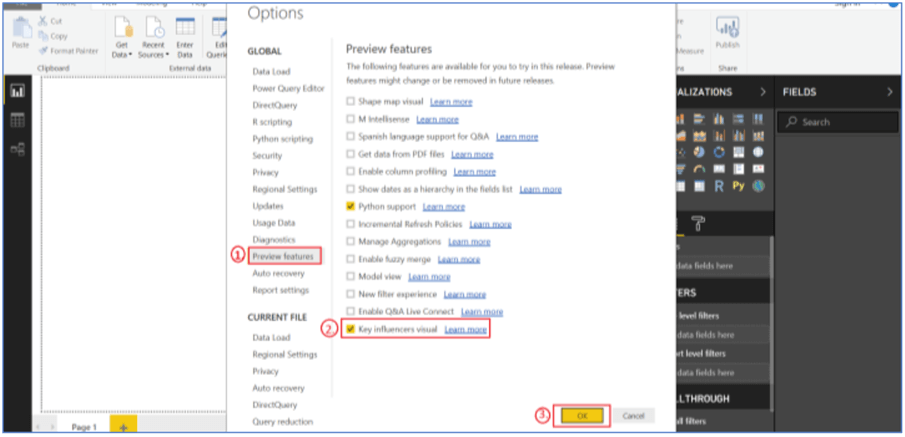
Go to Preview features in the Options dialog box and select Key influencers visual option and press OK.
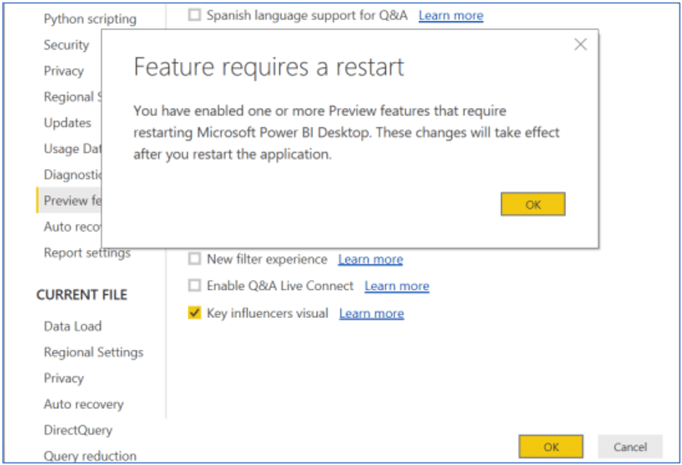
The following message asks to restart the application. The key influencers visual will be added in the visuals gallery once this application is restarted. Select OK.
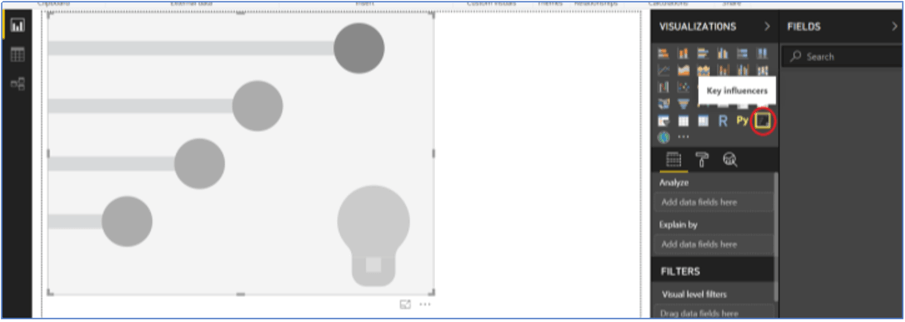
The key influencers visual is added in the Visualizations pane and hovering over this icon displays tooltip Key influencers. Select the icon to bring this visual into the report canvas of Power BI Desktop as shown below.
Loading Sample Data
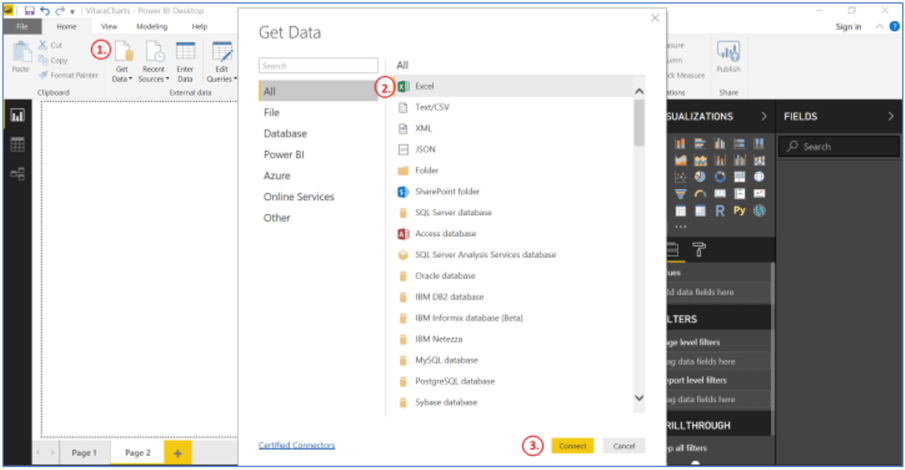
We will need data to understand how the key influencers visual actually works. Let’s move forward and import some sample data to work with. To do so, click Get Data on Home ribbon, select Excel and hit the Connect button.
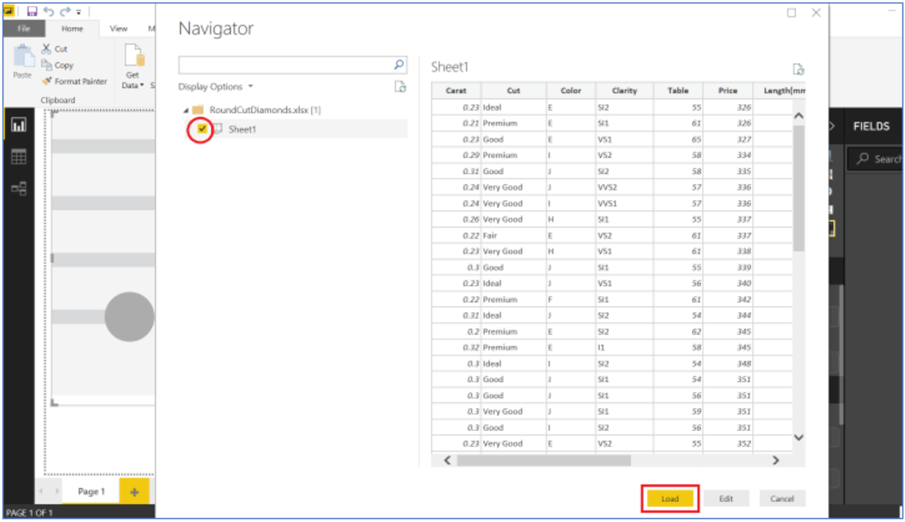
Navigate to a pertinent Excel file that you have in your system, we will be navigating to a sample Excel file named RoundCutDiamonds here to show functionality of key influencers. You can download this Excel from here. Click on Sheet1 and select the Load button to populate data into Power BI Desktop. You can see the preview of this datasheet on the right side of the navigator screen.
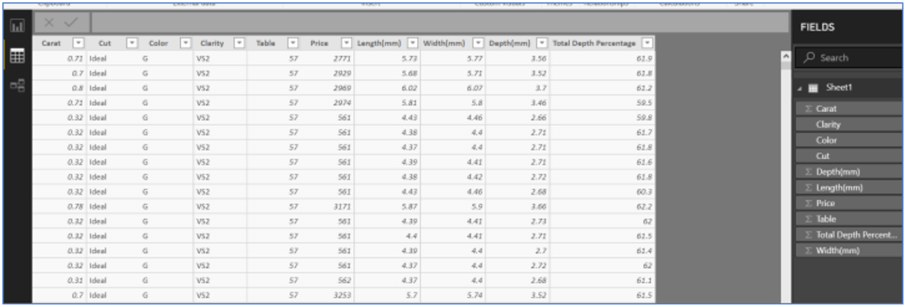
You can see data loaded in the Fields pane on the extreme right side of the Power BI Desktop screen.

Before, we move ahead and explore this visualization, let’s quickly delve into the sample Diamond data that we just imported to understand some basics that diamond industry follow to access and ensure quality of a diamond.
This data frame contains prices (in $), 4 important C’s (Carat, Cut, Color and Clarity) and other attributes of almost 50k round shaped diamonds. Clarity provides a measurement of how clear the diamond is and is categorized like I1 (worst), SI2, SI1, VS2, VS1, VVS2, VVS1, IF (best) in this dataset. Diamonds are graded into cuts like Ideal, Premium, Very Good, Good, Fair and carat component represents how much a diamond actually weighs. A preview of data is displayed below for a quick reference.
Getting Started with Key Influencers
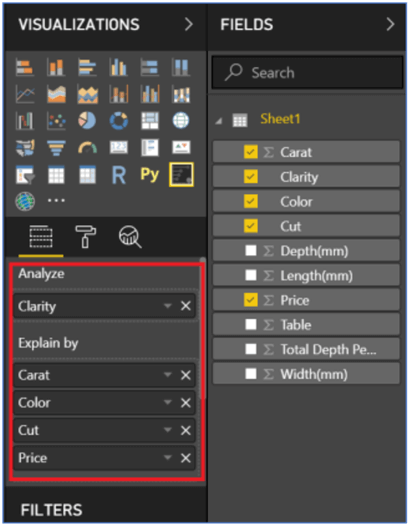
We want to investigate Clarity of a diamond here so we will start by adding Clarity field to Analyze in the Fields section below the Visualizations pane. Next, we will add fields that we think can influence Clarity into the ‘Explain by’ section. Let’s drag Carat, Color, Cut and Price into it for now, you can add as many relevant fields as you want.
Scatter Plots in Key Influencers View
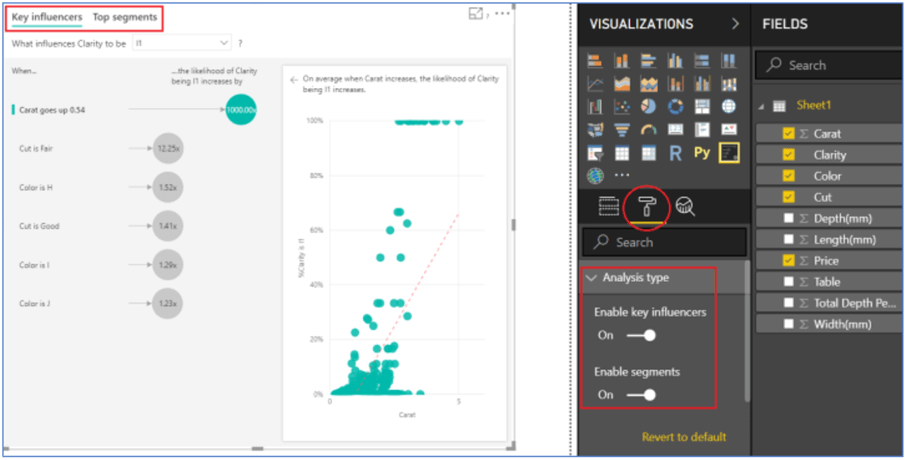
Once the fields are brought into both segments of the Fields pane, an interesting visualization is created in the report canvas with key influencers as a default view in the visual. It allows user to select distinct values of Clarity in the dropdown and helps to understand factors that influence Clarity of a diamond, these factors are called influencers and can be seen on the left side of the visual. Let’s select clarity grade as I1 (Inclusions Included) from the dropdown and we can see the list of factors influencing Clarity = I1 by a factor 1.20 and above on the left-hand side of the visual. Distribution of data with respect to the selected influencer and Clarity as I1 is seen on the right-hand side of the visual. Basically, the key influencers visualization examines the likelihood of achieving Clarity as I1 based on different influencers selected.
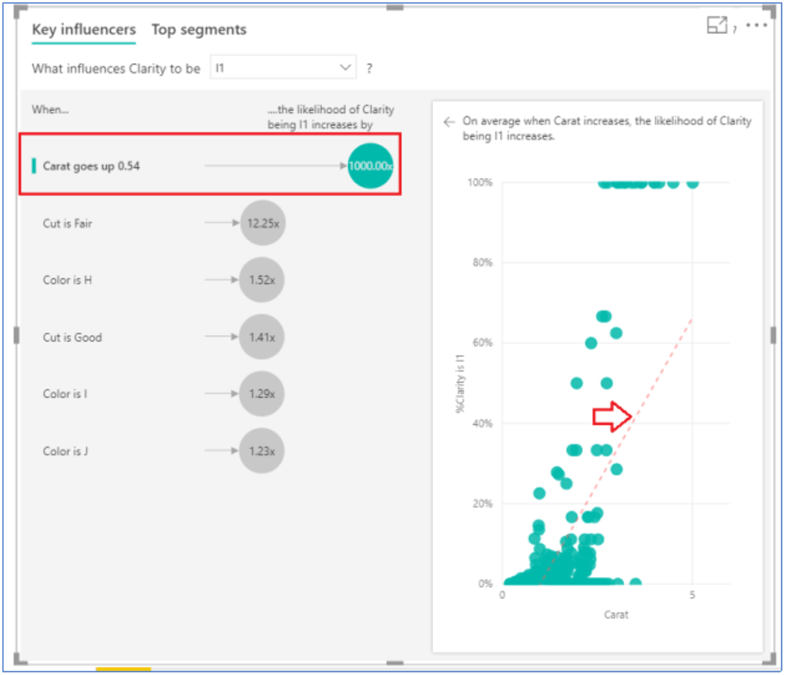
Let’s quickly go over the top influencer for Clarity selected as I1 in the example above. Key influencer visualization explains as Carat increases, the likelihood of Clarity = I1 increases, to be precise, every time there is a growth of 0.54 in Carat, on average the likelihood of Carat being I1 increases by 1000.00x times. The scatter plot displays data points for the average % Clarity (is I1) for each value of Carat and also points out a linear trend on the right side of the visual.
Column Charts in Key Influencers View
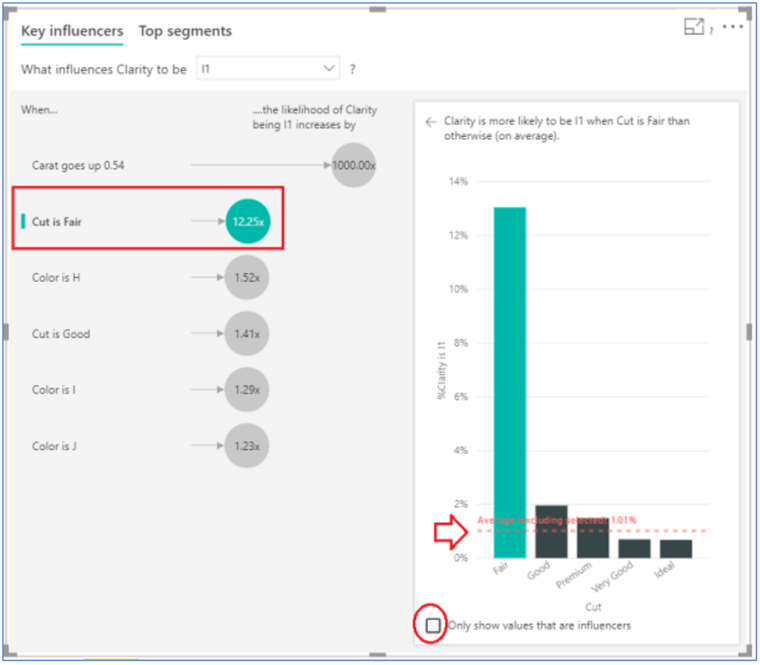
We can select and go through each bubble-shaped influencer present on the left side of the visual and different visualizations are created on the right side. Click the second factor in the list that impacts likelihood of Clarity being I1 grade and you will notice an instant change in the visualization to the column chart is represented for Cut = Fair. This influencer depicts that Clarity is 12.25 more likely to be I1 when the Cut is "Fair". The red dashed line shows average % of Clarity being I1 of all values except for the Key influencer selected. That means this average line is based on the average of all other values and excluded Fair Cut in this case. Additionally, there is a box shown below (encircled in red) at the bottom right of the visual that when checked will filter results based on the influencers.
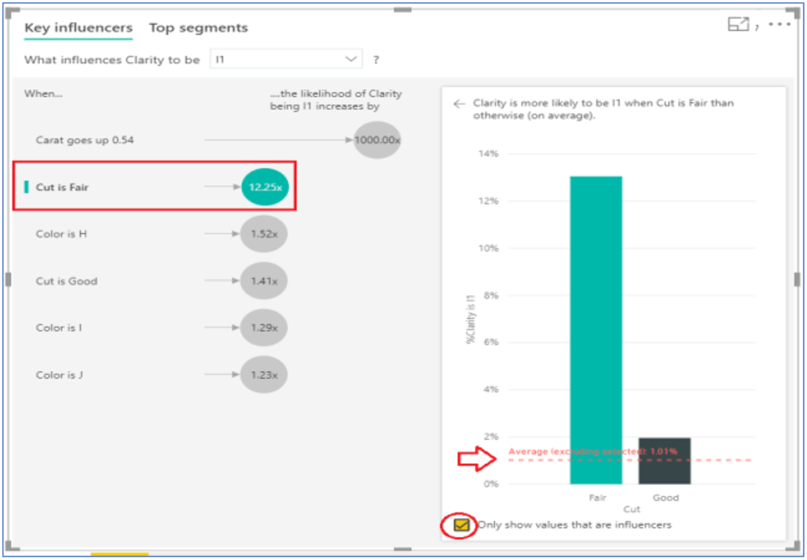
Once this box is selected, the visual will only show values that are influencers. In this case, Cut = Fair and Cut = Good are two influencers analyzed by this visual. So, checking this box, will narrow down the column bars from 5 to 2 as shown below.
Top Segments View
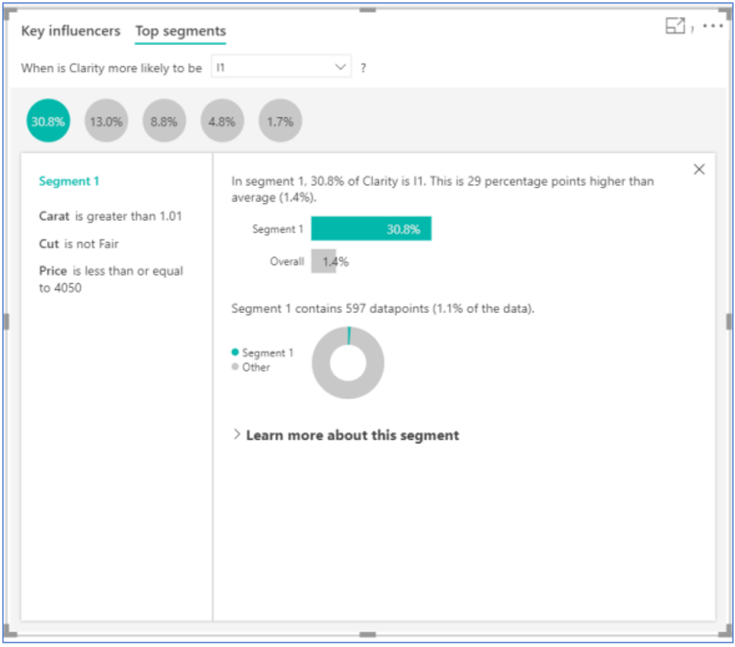
There is one more view – 'Top segments' supported by this visual. It is placed right next to the Key influencers tab. This tab lets the user understand how a group of factors influences the metric we are analyzing. This combination of factors makes up a segment. In our case, the visual has identified 5 segments that are more likely to have a Clarity of I1 along with the population count. The higher the bubble, the higher the likelihood of clarity being I1. Segments are also ranked based on the population size. One such example of Top segments view is shown below.
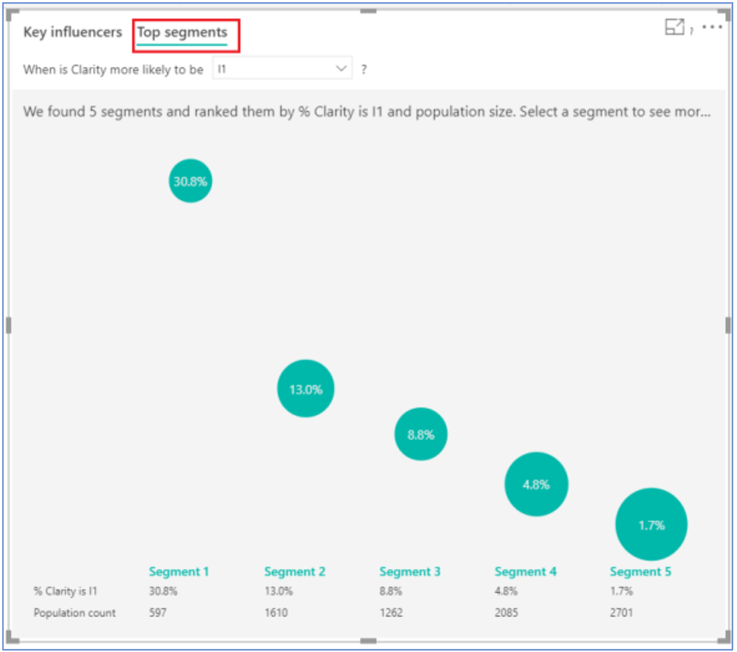
On clicking one of the bubbles, we can see what all factors contribute to this segment and some additional characteristics like how the segment is doing against the average. In our case, we noticed that in Segment 1, 30.8 % of Clarity is I1 and it contains around 1.1 % of the data, i.e. this segment has 597 observations for the factors listed.
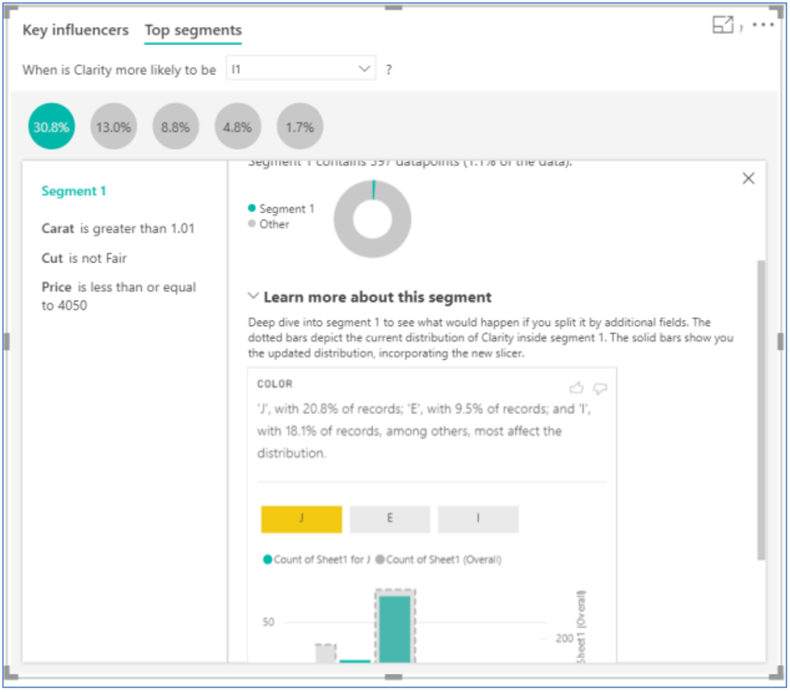
You can generate more insights about the particular segment by using Learn more about this segment option. Click on this to deep dive into the segment and further split the segment by additional fields.
Enable or Disable views in Key Influencers Visual
At times, there may be a need to abstract some data on the visual. These visuals permit BI Developers to hide either of the two views-Key influencers or Top segments before publishing the report to the end users. In order to make these formatting changes in the visualization, click the paint roller icon below the visualizations pane. Click on Analysis type and set "Off" for any view that you would want to obscure.
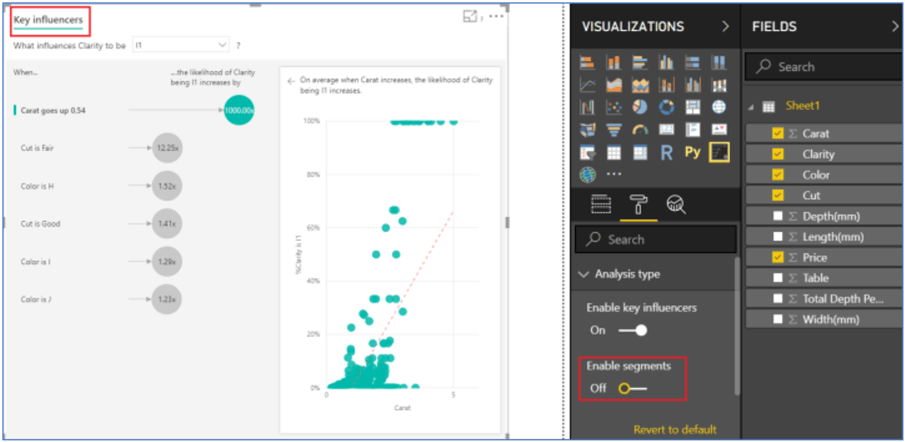
Disabling segments by setting the option "Enable segments" to "Off" under Analysis type in the Format pane will result in the following visualization report.
A Few Limitations of Key Influencers Visual to Consider
There are some limitations associated with this visual that Power BI report developers or users should be aware of. These limitations are as listed below:
- It does not support analysis of metrics that are Measures/Aggregates.
- This visual cannot be used in Power BI Embedded and Power BI mobile apps.
- Row Level Security support, Direct Query support and Live Connection Support are currently unavailable.
Summary
The purpose of this tip is to get you familiar and started with Key Influencers in Power BI Desktop. We learned how the Key Influencers visual is intuitive to work with for elaborate and detailed data analysis using just drag-drop features without any coding. As the visual is still in public preview, we can expect more advancements in this visual from the Power BI team in the near future.
Next Steps
- Consider exploring this visual for the metrics and data that may seem useful and relevant to you.
- To learn more about the Key Influencers visual, read this documentation.
- For more information on Power BI, refer to these other Power BI Tips.

Gauri Mahajan is a SQL Server Professional with 6+ years of experience of working with global multinational consulting and technology organizations. She is very passionate about SQL Server Reporting Services, R, Python, Power BI, Database engine, etc. She has years of experience in technical documentation and enjoys writing. She has deep experience in designing data and analytics solutions and ensuring its stability, reliability, and performance. She is also certified in SQL Server and has passed the 70-463: Implementing Data Warehouses with Microsoft SQL Server exam.
- MSSQLTips Awards: Author of the Year Contender – 2019
