Problem
The data skew is one of the most common reasons why your Apache Spark job is underperforming. How to you determine if your Spark job, running on Azure Synapse Analytics is impacted by the data skew issues?
Solution
Why data skew is bad for performance?
Spark is a distributed system, and as such, it divides the data into multiple pieces, called partitions, moves them into the different cluster nodes, and processes them in parallel. If one of these partitions happens to be much larger than others, the node processing it may experience the resource issues and slow down entire execution. This kind of data imbalance is called a data skew.
The size of the partitions depends on the factors, like partitioning configuration of the source files, the number of CPU cores and the nature of your query. The most common scenarios, involving the data skew problems, include the aggregation and join queries, where the grouping or joining field has unequally distributed keys (i.e. few keys have much more rows, than the remaining keys). In this scenario, Spark will send the rows with the same key to the same partition and cause data skew issues.
A traditional Apache Spark UI has some dashboards to determine data skew issues. In addition to that, Azure Synapse Analytics introduced nice data skew diagnosis tools. I’m going to describe both standard and new data skew diagnosis tools here. I’ll assume here that you are already familiar with the basics of Azure Synapse Analytics and its Spark capabilities (see Azure Synapse Analytics Overview and Explore your Spark databases in Azure Synapse Analytics for more info).
Prepare the sample data and code
Before we proceed, let’s prepare some sample data. I’ll use an open-source US population by state and county data from Microsoft, which can be extracted using the Python libraries.
Let us open the Synapse Studio, navigate to the Develop tab and create a PySpark notebook:
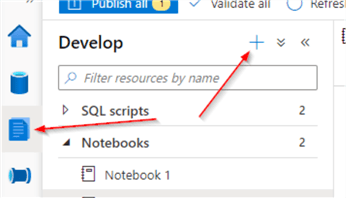
Figure 1
Add the below provided code, to create the data from the open-source library and display the sample output:
from azureml.opendatasets import UsPopulationCounty
data = UsPopulationCounty()
data_df = data.to_spark_dataframe()
#Display10rows
display(data_df.limit(10))
Here is the sample output:
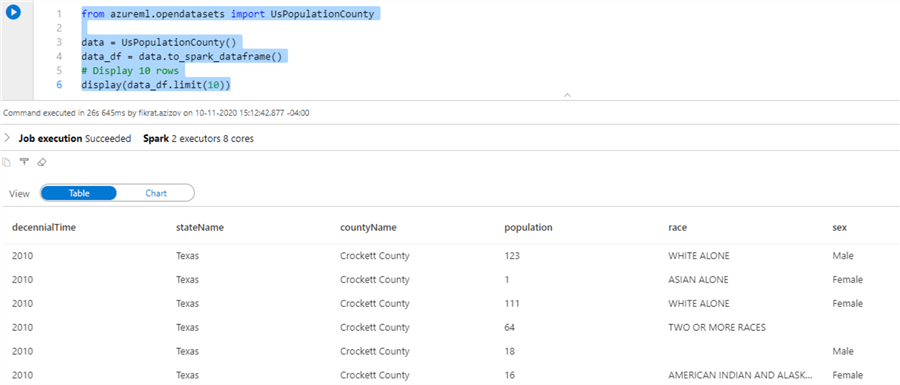
Figure 2
We’ll mostly work with the stateName and population columns in this dataset. Let’s explore the distribution of the data by the state name, using the following code:
from pyspark.sql.functions import *
dfSub=data_df.select('stateName',col('population').cast('bigint'))
display(dfSub.groupBy('stateName').count())
Here’s the query output in chart format:
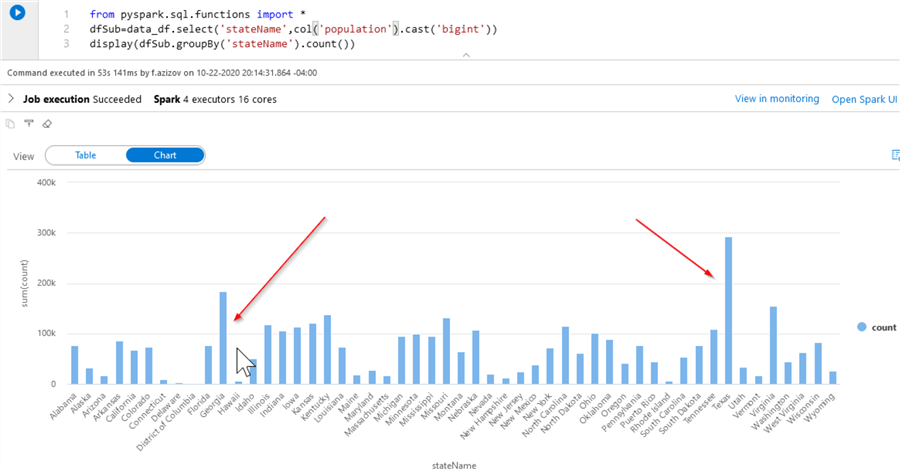
Figure 3
As you can see from the above chart, the states Texas and Georgia have more rows than other states. To make these differences even bigger, I will artificially increase the number of rows related to these states, using the below code:
dfLargest=dfSub.filter("stateName='Texas' or stateName='Georgia'")
dfUnion=(dfSub.union(dfLargest).union(dfLargest).union(dfLargest)
.union(dfLargest).union(dfLargest))

display(dfUnion.groupBy('stateName').count())
Here’s the query output:

Figure 4
Next, let’s use the below code to partition the data by state name and write it to the storage:
filePath='/SparkPerformance/UsPopulation/'
(dfUnion.write.format('csv')
.mode('overwrite').option('header',True)
.partitionBy('stateName').save(filePath))
Exploring the data skew issues using Apache Spark UI
Now that we’ve got a partitioned data source with a data skew, let’s read it into another data frame, aggregate and display, using the below code:
dfAgg=(spark.read.format('csv').option('header',True)
 .load(filePath).groupBy('stateName')
 .agg(sum('population')
 .alias('TotalPopulation')))
display(dfAgg)
Once the execution completes, use the Open Spark UI link, to navigate to the Spark UI page:

Figure 5
Open the Stages tab and review the Duration and Input columns for different job stages. Stage #9 appears to be the biggest from data consumption and execution duration points:
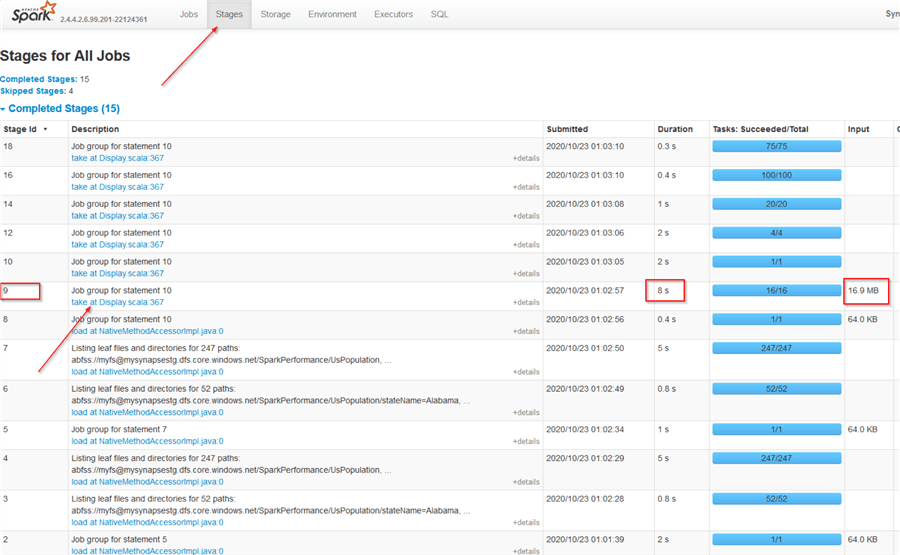
Figure 6
Open the stage details, using the Description link for stage 9 and expand the Event Timeline window:
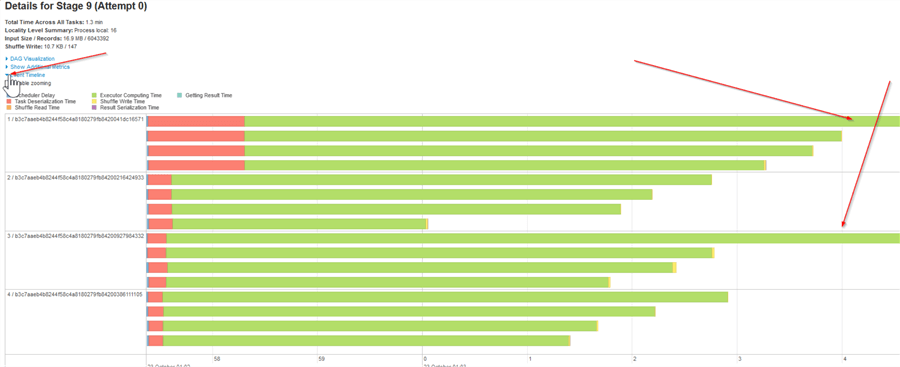
Figure 7
As you can see from the event timeline diagram, some of the tasks were much longer than others, which indicates data and time skew issues.
Now, let’s examine the task execution stats, located at the bottom of this screen. As you can see from the below screenshot, the slowest tasks (tasks #0,1) had much larger input data sizes, compared to the other tasks, which confirms the data skew issues:

Figure 8
Explore the data skew issues using Azure Synapse Analytics
The Azure Synapse Analytics’ skew analysis tools can be accessed from Spark History server, after the Spark spool has been shut down, so let’s use the Stop session link to shutdown the spool, as follows:

Figure 9
Once the spool is down, use the Open Spark history link, to navigate to the Spark history page:

Figure 10
Use the link under the App ID column, as follows:

Figure 11
Here we can see two extra tabs (Graph and Diagnosis), alongside the traditional Spark UI pages. Open the Graph tab:
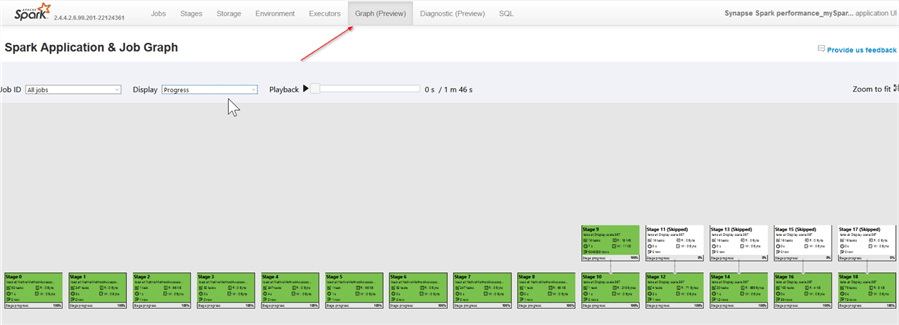
Figure 12
This tab displays all job stages with their corresponding execution stats, and the colors reflect their execution statuses, where the completed stages are highlighted with green color. We can also examine the stages from data I/O perspective, by selecting the Read option from the Display combo box:

Figure 13
Once we switch to the Read mode, you’ll notice that stage #9 is highlighted, because it caused much more data I/O, than others:
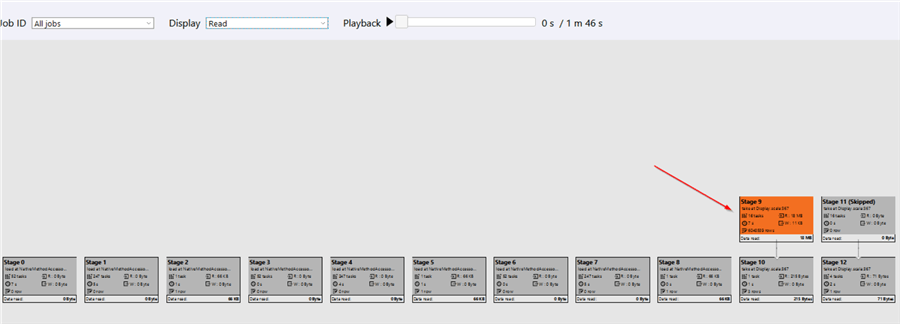
Figure 14
Now, let’s navigate to the Diagnostic tab:

Figure 15
This screen allows us to explore data and time skew issues. Let’s start by examining the data skew issues. Change the skew parameters as follows:

Figure 16
Once we change the parameters, the Skewed Stage table will display the stats for stage #9. If you select any stage in this table, the Skew Chart diagram at the bottom of the screen will display the scatter plot for duration and data I/O characteristics of all tasks in stage #9, in a convenient way. Notice that two tasks are highlighted as outliers on this chart, because of their significantly larger data I/O reads. You can also navigate to Spark’s detailed task page, using the View all tasks link, located at the top-right corner.
Now, let’s navigate to the Time Skew tab and change skew parameters as follows. This page is similar to the Data skew page, except it shows time skew issues.

Figure 17
Conclusion
In this tip, I’ve illustrated traditional Spark tools alongside newly introduced Azure Synapse Analytics tools to diagnose data and time skew issues with your Spark applications. I should mention that the links to access the Spark history server, described here, are accessible within the relevant notebook immediately after the shutdown of the Spark pool, but may disappear a few days afterwards. However, you can still access the Spark history server from the Monitor tab as follows:

Figure 18
Next Steps
Once you identified the data skew as a culprit, you can apply various techniques to address it and I’ve included a few related links below.
- Read: Azure Synapse Analytics Overview
- Read: Analyze with Apache Spark
- Read: Use extended Apache Spark history server to debug and diagnose Apache Spark applications
- Read: Fix – Data Skewness in Spark (Salting Method)

Fikrat Azizov (MCSE Data Platform and MCSE Azure Solutions Architect) has been working with SQL Server since 2002. Fikrat’s main passions are SQL Server performance optimization, cloud data technologies and machine learning. Fikrat is currently working as a Solutions Architect at Slalom Canada.
- MSSQLTips Awards: Author of the Year Contender – 2019-2022 | Rising Star (50+ tips ) – 2021