Problem
One observation of business and new Power BI users is that when they do not have a defined date columns in a table or an existing date dimension table that they tend to source the date dimension tables by either manually populating columns over time in an Excel worksheet or just manually entering the dates into Power BI calculated tables. Both approaches are not efficient at all and neither are they automated.
It should be noted that time intelligence calculation in Power BI is easier to work on when we have a well-defined date dimension table. The contrary would usually lead to complicated DAX calculations as well as messy model design in some cases. So, I am sure most would agree with me that it is very important to define a robust date dimension from the outset, no matter how complicated generating this might be initially, it is worth it.
I am sure most advanced Power BI developers are already aware of the techniques I will use to solve these scenarios. However, this article is based on what I have observed business users and less experienced Power BI developers do, thus the article would be more helpful to anyone in the later categories.
Solution
To demonstrate this, let’s say we have a dataset as seen in the snapshot below. Let’s say we need to create a Time Intelligence calculation for the Previous Quarter or Previous Year, the table below is not yet ready to handle such calculations as there is no defined date column.

If you have a similar dataset having dates as texts as seen in the above table snapshot, I will now demonstrate an approach in several steps that would be simple and yet efficient to ensure you are able to create a Date Dimension table from the dataset above.
- Split the “Month-Year” column to separate Year from Quarter period
- Take the middle month of each quarter as the month name
- Create a date column off the month name and year
- Create the Date Dimension table from the Dates column
- Create a relationship between the Date Dimension table and the original table
STEP 1: Split the “Month-Year” column to separate Year from Quarter period
After importing the dataset into Power BI, within the Power Query Editor we are going to create a new column for “Month” and “Year”. To do this we need to split the “Month-Year” column to separate the “Year” and “Quarter Period” as seen in the diagram below. Please see this article on Common data transformations in Power Query if you are unsure how the split was done as seen in the diagram below.

Now we have a “Year” and we need a “Day” and “Month” next to generate a date column that would enable us to create a Date Dimension table.
STEP 2: Take the middle month of each quarter as the month name
We would in this case assume each “Month-Year” entry is representing a quarter of the year. Thus, we will enter the middle month name as the month for each quarter period, i.e. “Jan-Mar” would be “February”, and “Jul-Sep” would be “August” and so on.
To do this, we need to create a Conditional Column as seen in the diagram below.

On the window that opens, we need to enter the details as seen in the snapshot below.

The above will create a new column called “Month” and the new look of the table is as seen in the diagram below.

STEP 3: Create a date column off the Month name and Year
Since we now have a “Year” and “Month” columns, we are only left with a “Day” column. But for the purpose of this approach, we will consider each day to be the first day of the month. Thus, we would have “01 February” or “01 August” and so on.
Thus, we will now create a column that combines the “Month” and “Year” columns and the “Day” would become visible once we are finished.
To do this, we need to create the column using “Column from Examples” as seen in the diagram below (Note: remember to highlight the two columns we are going to combine).

Then, we need to enter the “Month” value before the “Year” value as seen in the diagram below.

The resulting table should now look like the diagram below.

We still need to do one more thing at this stage, we need to change the data type for the “Dates” column so we can have the “Day” values too. To do this, just follow the snapshot below.

Now that we have a useful date column, we can now easily create a Date Dimension table using these date columns.
STEP 4: Create the Date Dimension table from the Dates column
To begin step 4 we need to first “Close & Apply” the Power Query Editor and load the data to the model. Having done this, we need to navigate to the “Modeling” tab in Power BI and select “New table” as seen in the diagram below.

Next, we need to write out a DAX query to create the “Date Dimension” table for us. We will name the tale as “DateTable” as seen below.
DateTable = CALENDAR(MIN(Sheet1[Dates]), MAX(Sheet1[Dates]))

You can get some more information on how the “CALENDAR” function works in DAX here. The DAX query for the “DateTable” would automatically generate a single column of dates between the first and last date values in the original dataset. See the snapshot below for generated dates.

From here, we can create additional columns for the Date Dimension table as we wish. However, this post is mainly focused on the approach to creating the Date Dimension table not how to create columns in the Date Dimension table. I will leave links in the “Next Steps” of this article on creating more columns in Date Dimension tables.
STEP 5: Create a relationship between the Date Dimension table and the original table and create sample Time Intelligence calculation
Next, we need to create a relationship between the newly created “DateTable”, and the Original table as seen in the diagram below. It’s always best to have a One to Many (from DateTable to Sheet1 Table) relationship as well as a single directional where possible.

After these, we are good to go, we can start creating Time Intelligence calculations in measure and creating visuals.
First, let’s create a column chart visual with dates from the Date Dimension table and “Values” from the “Sheet1” table as seen in the diagram below.

We will compare this with the same chart, but using “Dates” and “Quarter Period” columns from the “Sheet1” table as seen in the diagram below.
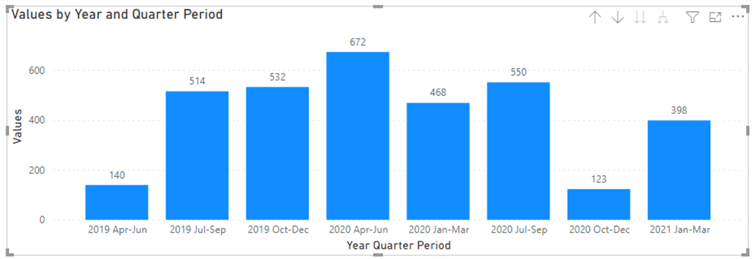
As can be seen, there is no difference in the output on both charts when sorted appropriately.
Next, we need to create a “Previous Quarter” measure by using the “SAMEPERIODLASTYEAR” DAX function as seen below.
PQ Values = CALCULATE(SUM(Sheet1[Values]), SAMEPERIODLASTYEAR(DateTable[Date]))
The output of this measure on a table visual is as seen below.

In summary, we have been able to demonstrate that it is quite simple to create a date table from a text column containing date elements. Also, we have shown that the values on the original table were not affected after all the transformations we have applied in this approach. And in the end, we were able to create a very simple DAX query for Time Intelligence calculations. This approach would save time on populating a separate dates table in Excel, ensure you only write very simple DAX queries as well as it is 100% automated.
Next Steps
- Download the sample code (*.pbix file) for this tip.
- See this YouTube video from Enterprise DNA on Creating Date Tables in Power BI here.
- Checkout this article on how to create Date Tables in Power BI by Sqlbi here.
- Checkout this Microsoft documentation on Time Intelligence functions here.
- Be sure to check this blog by Enterprise DNA on importance of Date Tables in Data Modeling here.
- Try this tip out in your own data as business requires.
- Check out all of the Power BI tips on MSSQLTips.com.

Kenneth A. Omorodion is a Microsoft Certified Solutions Associate (MCSA) with 12+ years of enterprise application experience in Power BI, DAX, Microsoft Fabric, Business Intelligence, data warehousing, SSRS, T-SQL, and Azure. Beyond his technical skills, Kenneth has expertise working with stakeholders’ and business leaders to help them better understand key insights. He has a great track record of successfully delivering full life cycle Business Intelligence and data solutions to organizations with measurable business impact.
- MSSQLTips Awards
- Achiever Award (75+ Tips) – 2025
- Author of the Year-2021
- Author Contender-2022/2023/2024


Can you provide the excel sheet the column month-year is not exists