Problem
I was recently tasked to support a team to help create DAX logic in Power BI to enable the team to calculate values for previous year’s weeks as compared to that of current year. On first look, this seemed like a simple and straight-forward task, but as you will see in this tutorial it was not a straight-forward at all.
What the team wanted to do in summary includes the ability to compare the current selected fiscal week to the same fiscal week in the previous year while calculating the total sales month till date. I understand some will think, why don’t we just apply the DAX time intelligence functions to solve that. Hmm, yes to some extent, and no, you would need to apply more logic to achieve this along with the DAX time intelligence functions. Let’s see what was complicated in this task and how this can be approached.
Solution
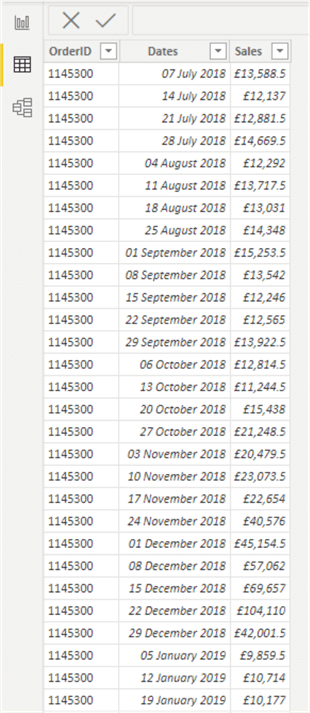
To demonstrate this, I have created a sample dataset as seen in the diagram below. In this sample dataset I have a Sales column (this can be any other values in your case), a Dates column, and an “OrderID” column. Your dataset is expected to contain more columns than this, but this is for illustration purposes.
Also note that the “Dates” column has dates ranging between 2018 and 2022 years as would be seen later.
So, what the team was trying to achieve was to get a column that holds fiscal week numbers, and this would be used as a slicer in the Power BI report and create a calculated measure for the total Sales for each fiscal year as well as another measure to show the total sales for the selected fiscal week number in same fiscal week in the previous fiscal year. The challenge came from the fact that some months in some years have more weeks than same months in other years. So, it would not be as simple as using DAX time intelligence functions to solve this.
As an example, looking at the global dates calendar for August (2019, 2020 and 2021) below, and counting new weeks to start from Sundays, we would see that
- August 2019 has 4 Sundays
- August 2020 has 5 Sundays and
- August 2021 has 5 Sundays.
This is not applicable to August only, there are other months with similar case.
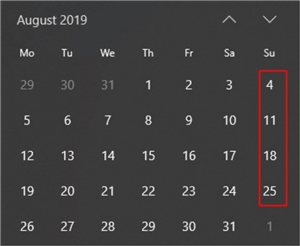
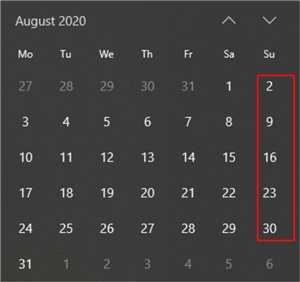
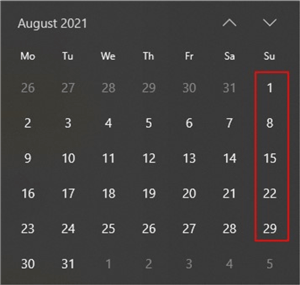
For situations where Fiscal months starts from July, in 2021, August starts from fiscal week 5 to fiscal week 9, which is a 5-week period. This is not the case for 2019 where although August starts from fiscal week 5 up to fiscal week 9, but there are 4 weeks period (if we count number of Sundays).
So, as we would see later calculating Month to Date for the Sales values for week 9 for example for same period previous years would generate inaccurate results as we will be comparing additional weeks sales for August week 9 in 2021 and 2020 (as they have 5 weeks) to that of 2019 with just 4 weeks.
To achieve the above requirements, I will breakdown the solution in several steps to make it as easy and possible to apply to any business case. Please do note that each step is essential for the approach to work.
- Create a Dates Table
- On the Dates Table add a “Calendar Week Number” column
- On the Dates Table add a “Calendar Month Number” column
- On the Dates Table add a “Calendar Year” column
- On the Dates Table add a “Fiscal Year” column
- On the Dates Table add a “Fiscal Week Number” column
- On the Dates Table add a “Fiscal (Week+Year)” column
- Create a “Week Ending” column on the Dates Table
- Add a Calculated Column “Week of Month Fiscal” on the Dates Table
- Create the DAX logic measures
STEP 1: Create a Dates Table
There are different approaches to create a Date Table in Power BI, I have previously written about some of these approaches in this article and another one showing how this can be done from scratch using Power Query. I will not go into detail of creating Dates Table again in this article, but I will show a simple way I created a Dates Table as seen in the diagram below.
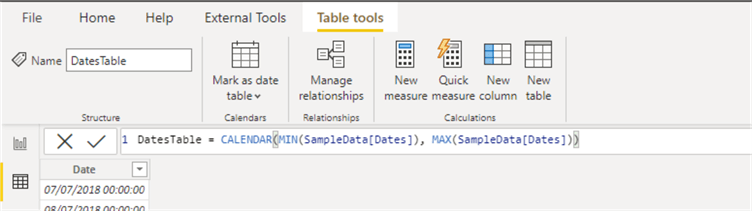
DatesTable = CALENDAR(MIN(SampleData[Dates]), MAX(SampleData[Dates]))
The above DAX code will create a single column of dates in the Dates Table.
STEP 2: On the Dates Table add a “Calendar Week Number” column
To add a Calendar Week Number column to the dates table we simply create a calculated column on the Dates Table as shown below.
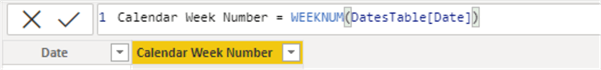
Calendar Week Number = WEEKNUM(DatesTable[Date])
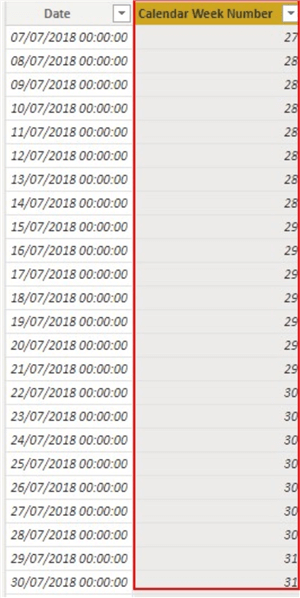
The output on the table is as seen below.
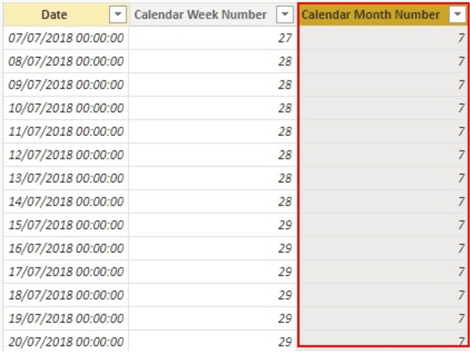
STEP 3: On the Dates Table add a “Calendar Month Number” column
Like how we did in the second step, we need to add a “Calendar Month Number” column as seen below.
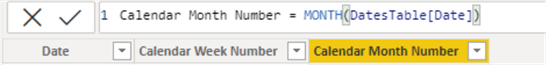
Calendar Month Number = MONTH(DatesTable[Date])
The output of the column on the table is as seen below.
STEP 4: On the Dates Table add a “Calendar Year” column
Next, we add a “Calendar Year” column as shown in the diagram below.
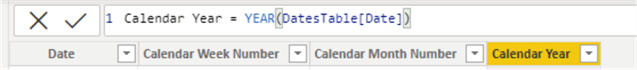
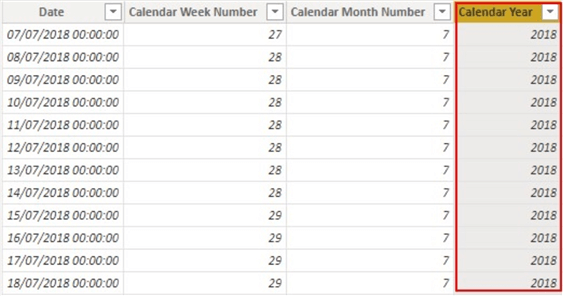
Calendar Year = YEAR(DatesTable[Date])
The output on the table is as seen below.
STEP 5: On the Dates Table add a “Fiscal Year” column
Next, we add a “Fiscal Year” column as shown in the diagram below.

Fiscal Year =
VAR _FiscalMonthStart = 7
RETURN
    IF (
        DatesTable[Calendar Month Number] >= _FiscalMonthStart,
        DatesTable[Calendar Year] + 1,
        DatesTable[Calendar Year]
    )
The output on the table is as seen below.

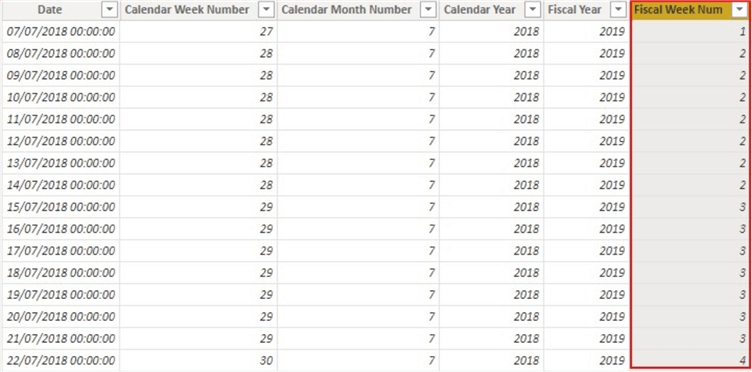
STEP 6: On the Dates Table add a “Fiscal Week Number” column
Next, we add another column to the Dates Table which would hold the “Fiscal Week Number” as seen below.
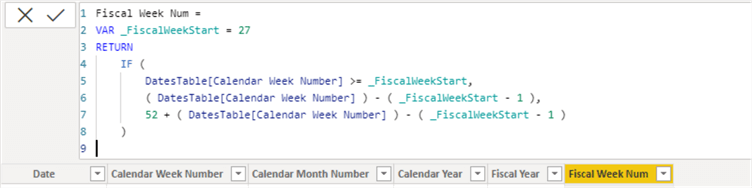
Fiscal Week Num =
VAR _FiscalWeekStart = 27
RETURN
    IF (
        DatesTable[Calendar Week Number] >= _FiscalWeekStart,
        ( DatesTable[Calendar Week Number] ) - ( _FiscalWeekStart - 1 ),
        52 + ( DatesTable[Calendar Week Number] ) - ( _FiscalWeekStart - 1 )
    )
The above DAX code will create a column in the Dates Table which would be used as a slicer later in the Power BI report to determine the selected Fiscal Week. The sample output is as shown below.
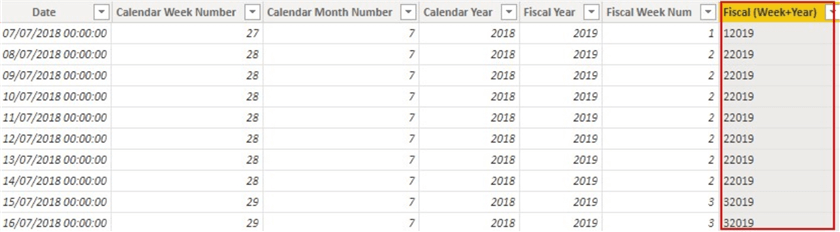
STEP 7: On the Dates Table add a “Fiscal (Week+Year)” column
From this step onwards, we now start applying some logics to ensure we get accurate values as per the requirements later. Here, we need to create a column containing a concatenation of the Fiscal Week Number and the Fiscal Year as seen below. Where applicable change data type on this column to “Whole Number“.
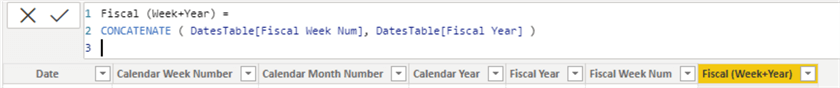
Fiscal (Week+Year) =
CONCATENATE ( DatesTable[Fiscal Week Num], DatesTable[Fiscal Year] )
The sample output is as shown below.
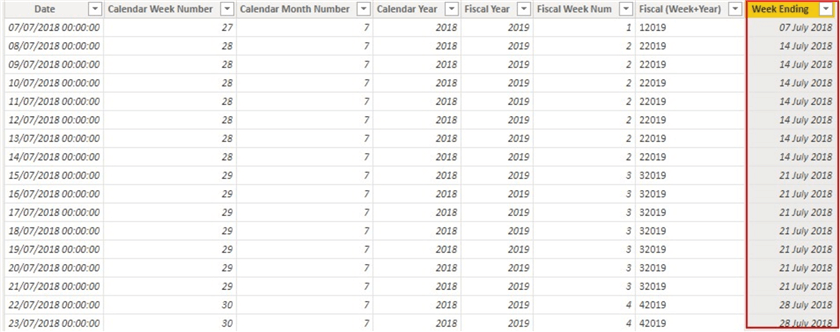
STEP 8: Create a “Week Ending” column on the Dates Table
This is another logic column created to be able to determine for every fiscal week date what was the week ending date of the week. This would enable us to calculate the same week period in the previous year and optimally deduce the Total Sales for that period as compared to the current period depending on the selected Fiscal Week number.
To add the Week Ending column we do as seen in the diagram below.

Week Ending =
 DatesTable[Date]
   - MOD ( DatesTable[Date] – 1, 7 ) + 6
The output is as shown below.
STEP 9: Add a Calculated Column “Week of Month Fiscal” on the Dates Table
This column will give a more accurate Fiscal week number relating to dates that start from Sundays each week. It will be very useful in creating the logic for the measure used later to get accurate values. The DAX code for creating this column is as seen below.

Week of Month Fiscal =
1 + WEEKNUM ( DatesTable[Week Ending], 1 )
    - WEEKNUM ( STARTOFMONTH ( DatesTable[Week Ending] ), 1 )
The output of the above DAX calculated column code is as seen below.

STEP 10: Create the DAX logic measures
At this point we have now created all the columns we require; we now need to apply these in creating the logic in the measures. The measures created entirely depends on your business requirement, but for the purpose of this article I will create the Month to Date measure from the Sales values.
MTD =
CALCULATE ( SUM ( SampleData[Sales] ), DATESMTD ( DatesTable[Date] ) )
When I represent this measure on a table visual along with Calendar Week Number, Fiscal Week Num, Week of Month Fiscal, Fiscal Year and Sales columns as seen in the diagram below.
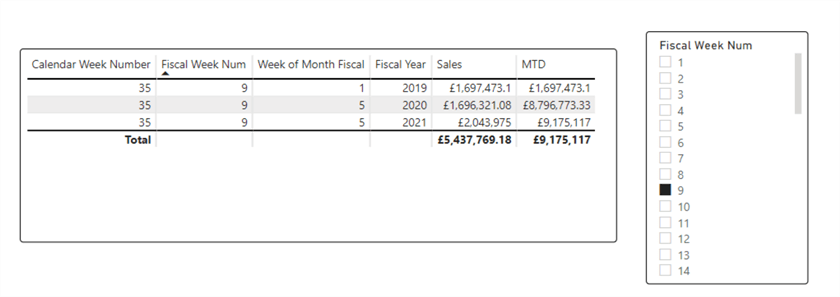
From the above diagram, you can see that we selected Fiscal Week Number 9 which is equivalent to Calendar Week Number 35. As can be seen, Fiscal Week Number 9 is equivalent to Week 1 (Week of Month Fiscal) of September in 2019 and Week 5 (Week of Month Fiscal) of August in 2020 and 2021. Thus, when we look at the MTD measure its not actually reflecting August MTD in 2019 but that of Week 1 in September.
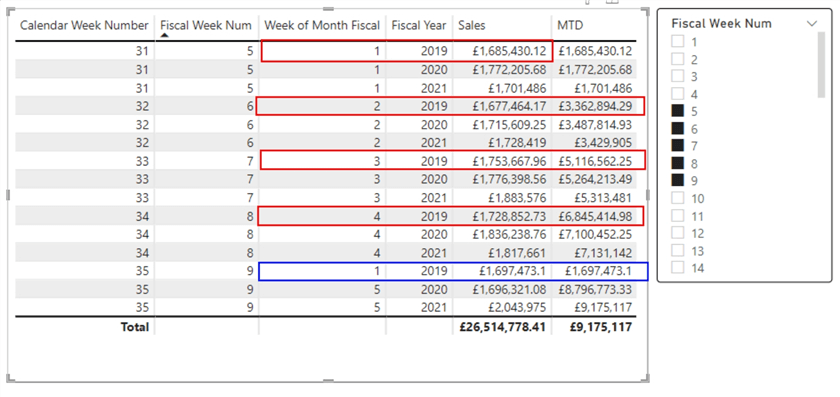
To further describe this, let’s select all the weeks in August (Week 5 to 9) and you would see that the value of Week 9 in 2019 fell in September not August unlike that of 2020 and 2021. I have highlighted the cumulative Month to Date values as well as the corresponding Week of Month Fiscal in “Red colors” to show what happened in that week in 2019. Once it got to Week of Month Fiscal 4 it started from Week 1 again, signaling there are 4 weeks in August 2019 (counting from Sundays).
So, when we use the default DAX Time intelligence Functions to calculate the Sales this week as against same period last year or previous years we end up with wrong values. See the DAX Code for Same Period Last Year and table visual below.
SPLY =
CALCULATE ( SampleData[MTD], SAMEPERIODLASTYEAR ( DatesTable[Date] ) )
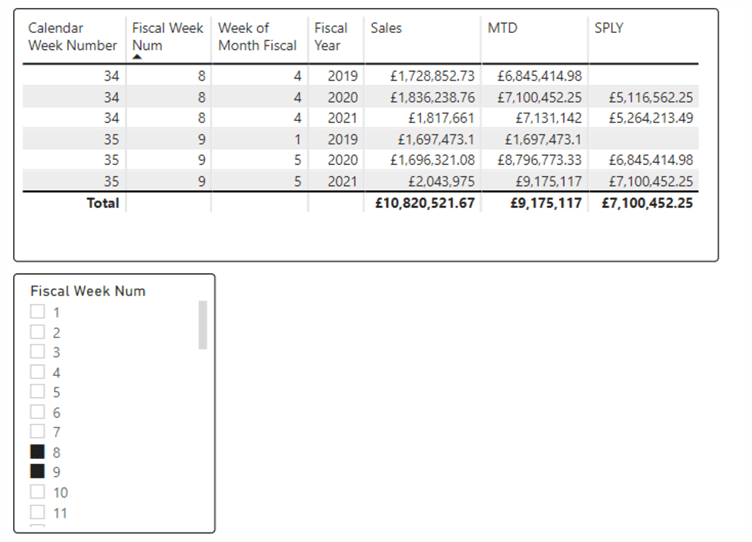
I have selected Fiscal Week Numbers 8 and 9 so we are able to see the previous weeks values. As you can see the Same Period Last Year value for 2021 Week of Month Fiscal 5 is showing £7,100,452.25. You might wonder where this is coming from as you might be expecting to see £8,796,773.33 (which is a cumulative of August 2020 Week 4 and August 2020 Week 5). This is not actually wrong either, but what we are trying to achieve in this article is when we select Week 9 on the slicer, we should be able to see £8,796,773.33 on the SPLY for 2021 Week of Month Fiscal 5, £1,697,473.1 on the SPLY for 2020 Week of Month Fiscal 5, and £7,100,452.25 on the SPLY for 2020 Week of Month Fiscal 4 and so on.
To achieve this, we need to create two measures as follows:
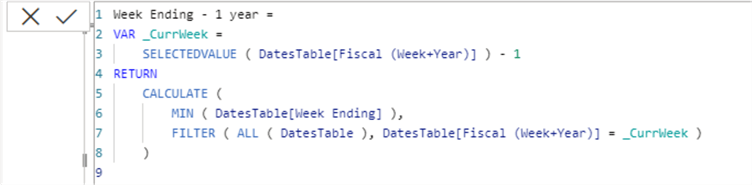
Week Ending - 1 year =
VAR _CurrWeek =
    SELECTEDVALUE ( DatesTable[Fiscal (Week+Year)] ) - 1
RETURN
    CALCULATE (
        MIN ( DatesTable[Week Ending] ),
        FILTER ( ALL ( DatesTable ), DatesTable[Fiscal (Week+Year)] = _CurrWeek )
    )
You can see how this measure code leverages some of the columns we have been creating earlier. The DAX code for the second measure is as seen below.
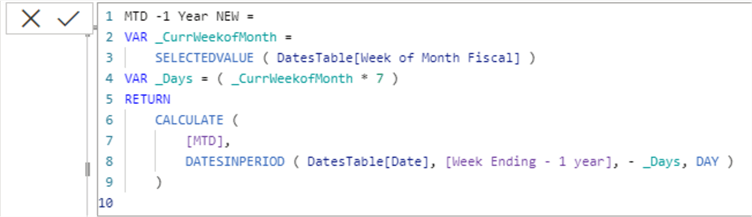
MTD -1 Year NEW =
VAR _CurrWeekofMonth =
    SELECTEDVALUE ( DatesTable[Week of Month Fiscal] )
VAR _Days = ( _CurrWeekofMonth * 7 )
RETURN
    CALCULATE (
        [MTD],
        DATESINPERIOD ( DatesTable[Date], [Week Ending - 1 year], - _Days, DAY )
    )
As you can see, the second DAX measure depends on the first. The second measure is the one to be used to solve this business requirement. I will now add this to the table visual earlier as seen below.
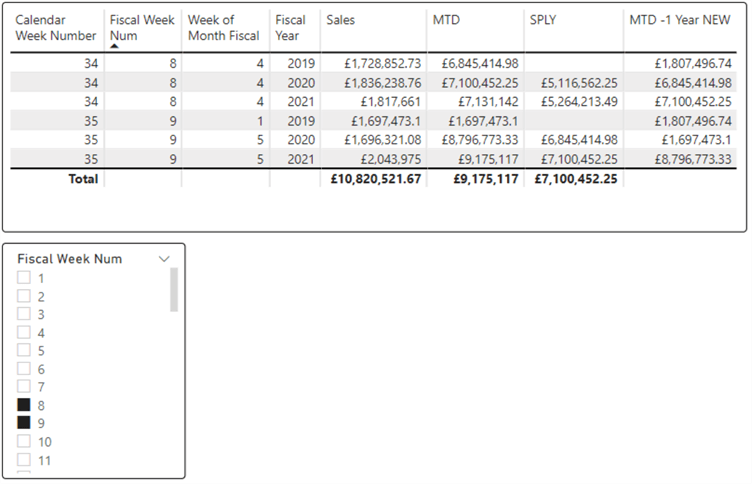
As you can now see in the diagram above, the values for Same Period Last Year are now correct as we expect it to be. For example, in 2021, in Fiscal Week Number 9, the value of Month to Date for previous year same period is £8,796,773.33 as expected.
In summary, in this article, we have been able to work out a logic on how to deal with another week DAX calculation. In this case, we needed to work on fiscal weeks. Your explicit measure might not be Month to Date calculation but any other forms of time intelligence measures. In each case, the logic should work just okay. It would be great and interesting to hear anyone comment on any other approach they have employed to solve similar business problems.
Next Steps
- Get more information on DAX Time Intelligence Functions from this Microsoft documentation.
- Read more on the DAX DATESINPERIOD Function.
- Read more on the DAX WEEKNUM Function.
- Read more on the DAX STARTOFMONTH Function.
- Try this tip out in your own data as business requires.

Kenneth A. Omorodion is a Microsoft Certified Solutions Associate (MCSA) with 12+ years of enterprise application experience in Power BI, DAX, Microsoft Fabric, Business Intelligence, data warehousing, SSRS, T-SQL, and Azure. Beyond his technical skills, Kenneth has expertise working with stakeholders’ and business leaders to help them better understand key insights. He has a great track record of successfully delivering full life cycle Business Intelligence and data solutions to organizations with measurable business impact.
- MSSQLTips Awards
- Achiever Award (75+ Tips) – 2025
- Author of the Year-2021
- Author Contender-2022/2023/2024


Hi – thank you so much for your guide!
When I enter:
Week Ending =
DatesTable[Date]
– MOD ( DatesTable[Date] - 1, 7 ) + 6
I get the error “The following syntax error occurred during parsing: Invalid token, Line 3, Offset 29, -.”
How do I fix this issue?
Hello! Thank you for share this knowledge. How do you solve the fact that in the Calendar Year of 2017 the starting week of the fiscal month July was at the week no 26?
Hi Kenneth, Nice Explanation, Kindly attach the sample dataset which would be helpful, Thanks
Thanks, Kenneth. The explanation is so thorough and very user-friendly (being able to copy the script). Thank you very much. Great help indeed.