Problem
Power Apps as a citizen development platform is targeted mainly at developing forms and mobile applications. What if you want to create a Power App that is more geared toward analytics and presenting information hosted in Power BI? There are a couple of options.
Solution
In a previous tip we discussed embedding a canvas app into a Power BI report. In this tip we will investigate the reverse scenario: how to display Power BI reports and/or dashboards in a Power App.
Use cases
Let’s take a quick step back before we examine the technical capabilities for embedding Power BI content in Power Apps. Why would you want to do that at all, especially when there is already a Power BI mobile App? Here’s five reasons:
- Create a thematic collection of information: inside a mobile or an embedded app you can arrange several different Power BI dashboards and/or reports.
- Include reports from different workspaces: you can add multiple Power BI controls to your app and configure them differently so that they are connected to multiple workspaces.
- Display certain reports or dashboard tiles conditionally, based on business rules in the form: every Power BI control has the Visible property so it is straightforward to implement conditional logic and show or hide certain information when needed.
- Provide an extra layer of security or permission control: this is quite a niche scenario buy maybe you share your reports in “silent” mode (i.e. don’t notify your audience once the report is shared)? In that case you can serve the content with a power app instead of pointing the users to the Power BI portal.
- Gather feedback from users: since you are already working inside Power Apps, it would be quick to set up a basic form for gathering feedback of any type for your analytics content.
Bonus reason: you don’t want to use the default charts in Power Apps but you do need a chart in your app. From the Insert menu, Power Apps gives you the option to add some basic visualizations, such as a column chart or a line chart:

The disadvantage of these controls is that they do not have a lot of customization options. On the upside though, they are native to Power Apps and optimized for performing on a mobile device.
With these few points in place, let us see how to implement the Power BI embedding:
The Power BI Control
The Power BI tile control is accessible from the Charts menu:

When you add it, a pane will pop up to the right, asking you to choose a certain tile. This already tells you the default configuration is applicable only to existing dashboards:

Before publishing and sharing the app, it is important to share the dashboard explicitly with the users of the app:

That covers the basic configuration but there are two flavors to it, the old API and the new one.
Old API
First, let us investigate the default setting for this control referring to the “old API”, i.e., allowing you to embed only dashboard tiles. At their core, dashboards in Power BI are kind of an information aggregator which gathers data from one or multiple reports. However, they only support certain visuals, such as the table visual, card, gauge, or the line chart visual. To build on top of this, you can use your power app to showcase different tiles, which in turn may be coming from different reports. The real added benefit though comes from the extra properties we have on the Power BI tile. Let’s look at the most important ones:
- DisplayMode: the available options are
View,DisabledandEdit. - LoadPowerBIContent:
trueorfalse, acting accordingly. - PowerBIInteractions:
trueorfalse. If set totrue, the tile is clickable and opens the dashboard in the Power BI service. If set tofalse, but DisplayModeisVieworDisabledthen the tile is not clickable. - Visible:
trueorfalse. Use this in tandem with the LoadPowerBiContent property if you want to display multiple visuals conditionally, depending on business rules in the form. A tile that is not visible will still load so multiple tiles may impact the performance of the app negatively. For example, you can have a dropdown with a list of countries or cities. When a certain value from the dropdown is selected you can load and display only the relevant tiles.
New API
AllowNewAPI is a property of the Power BI control:
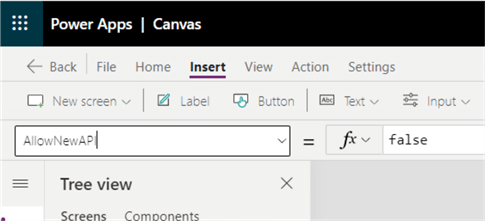
Configuring it to true allows using the new version of the Power BI API, available from around the end of July 2021. The default value is false. Note that according to the official documentation this functionality “isn't supported in mobile and some embedded scenarios”. According to my last tests (September 2021) indeed it does not work in a canvas app but does work in a SharePoint form or when the app is embedded onto a SharePoint page.
To use the new API, set the property to true and put the embed link of the report you want to display in the TileUrl property:

To control the interactions, use the PowerBIInteractions property. By setting it to true, you will allow browsing the pages of the report and using any of the filters available on the side or as slicers inside the report canvas:

On the screenshot above I have selected a filter (Florida) in the report from the canvas app.
Advanced filtering
You can also filter a report using query string parameters. This option coupled with the Power BI new API can be a powerful combo. Note that by default query string filter works with the direct report link. It looks like this:
ID}
If you use this link as input to tile URL, it will not work. You must use the embed link. You can obtain it by opening your report from the Power BI service, then go to File, then Embed, then Website or portal:

The link will look like this:
id}&appId={appid}&autoAuth=true&ctid={ctid}&config={config
hash}
The last two parameters you can safely delete – that is everything up to the authAuth=true. To the resulting link append:
- &pageName=ReportSection{page number} – in case you want to open a specific report page
- &$filter={Table name}/{Column Name} eq {‘value to filter on’}
Note that I use the curly brackets to signify a placeholder, i.e. an argument value that changes depending on your environment. For the report I use as an example, the TileUrl link would like this (StateFilter is the dropdown control being used for the filter value):
StateFilter.Selected.Value & "%27"
All spaces must be encoded (%20) and the filter value must be enclosed with single quotes, also encoded (%27). This is how the raw link looks like:
eq ‘" & StateFilter.Selected.Value & "'”
And here is how it behaves:
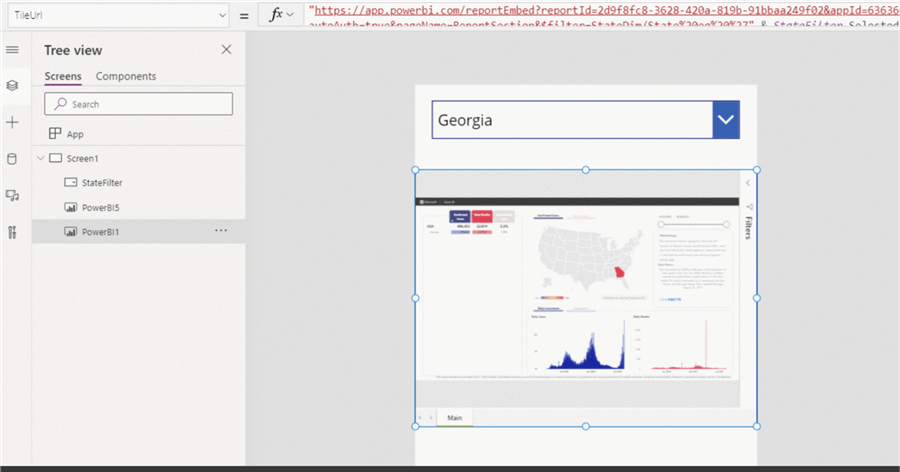
For the example I have used a sample report on Covid in the US. You can get by opening the Power BI app section and searching for it:

Performance
A last word on performance: do not overcrowd your app with too many reports or fewer but exceptionally slow reports. There is a great chance loading times may increase, especially for mobile users (although the new API is not supported vi mobile). If you plan to use the dynamic filtering option, also make sure your reports’ data models are optimized for those filters (e.g. have the appropriate indices) or cached queries, depending on the report data method (import or direct query).
Next Steps
- Power BI tile control in Power Apps
- Service URL Filters
- Filter a report by using query string parameters

Hristo Hristov is a seasoned data professional with 10+ years of experience spanning the intersection of data engineering and smart manufacturing solutions. Since 2017, he has specialized in implementing advanced analytics solutions for bridging the IT/OT gap.
A technical writer with over 80 published articles on data and AI technologies, Python development, and cloud solutions. Passionate about transforming complex data into business value through innovative applications of Azure Data Platform, Python, IoT solutions, databases, and other cloud technologies.
Currently applying Industry 4.0 best practices, focusing on IoT connectivity, and implementing data and AI systems in manufacturing. Hristo holds a degree in Data Science and several Microsoft certifications covering SQL Server, Power BI, and related technologies.
- MSSQLTips Awards
- Achiever Award (75+ tips) – 2026
- Rookie of the Year – 2021
- Author Contender – 2022/2023/2024/2025

Hi there and thanks for your comment. Unfortunately, the new API is not supported yet under mobile (Oct 2021). I can suggest two things:
1. monitor this page https://docs.microsoft.com/en-us/powerapps/maker/canvas-apps/controls/control-power-bi-tile which contains the core documentation for the PowerBi tile and should be updated as soon as there is a change; 2. Submit an idea to Power Apps user voice here: https://powerusers.microsoft.com/t5/Power-Apps-Ideas/idb-p/PowerAppsIdeas/status-key/Started If there is enough support, then MS will consider its implementation. The new API works differently in terms of authentication so we will get mobile embedding, just not straight away :)
Thanks for this very helpful article. Do you know how to get this to show when viewing the app from a mobile device? An embedded PBI report works great for desktop apps, but mobile gets stuck on a sign in screen.