Problem
Sometimes in Power BI dashboards we may have a SQL Server or SharePoint dataset with fields that should be grouped in a table visual, but the values that need to be grouped are not separated into different columns. This might seem straight-forward to solve, but I assure you not most Power BI Analysts are not aware of how to achieve this business intelligence solution as I recently discovered. So, in this tutorial we look at how this could be achieved.
Solution
The dataset used in this demo is as seen below.

So, we need to get each Name category grouped under the required column group like “Total Buyers“, “New Buyers” and “Existing Buyers” as seen below.

What the requirement could be is to get the table visual below.
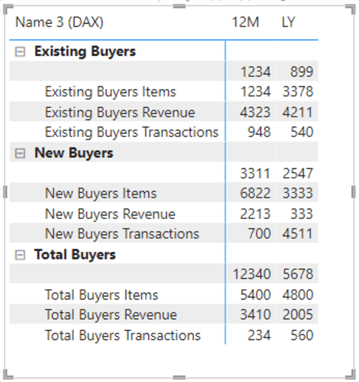
But, looking at the source dataset above, it is not a simple drag and drop solution since the Heading Column (Name 2) and the Sub Column (Name) both exist within the same column in the source dataset.
So, lets now look at the different approaches to create groups to meet the business requirement as described in the table visual above. We can achieve this using Power Query Editor or using DAX in Power BI.
Using Power Query Editor
What we need to do here is to create a new column “Name 2” out of the values we have in the original column “Name”. Looking at the second diagram above, we understand that all values in the Name column is based on three group values coexisting with other values in the same column. So, we need to separate these three group values into a separate column, so the rest of the values are now sub-columns.
To do this follow the steps below.
This depends on your preference; you can use either Column from Examples or create a new column using Custom Column.
Column from Examples Approach
If you choose to use Column from Examples to create the new grouped column, then do the following:
- While highlighting the Name column, click on the “Add Column” tab in Power Query and select the drop down on the “Column from Examples” as seen in the diagram below.
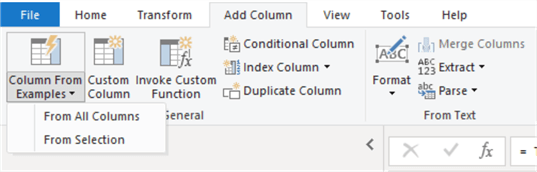
- Select the “From Selection” option
- Enter a name for the new column and type in the values as seen in the diagrams below
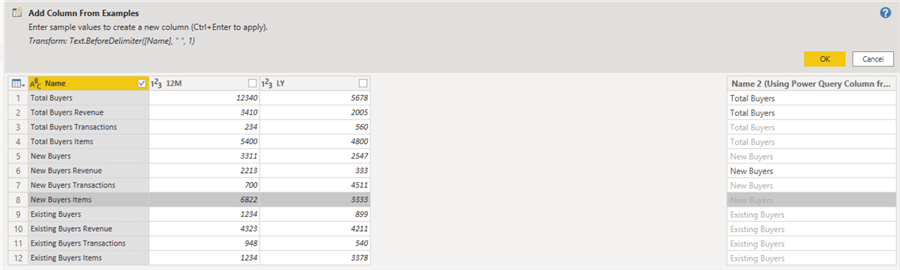

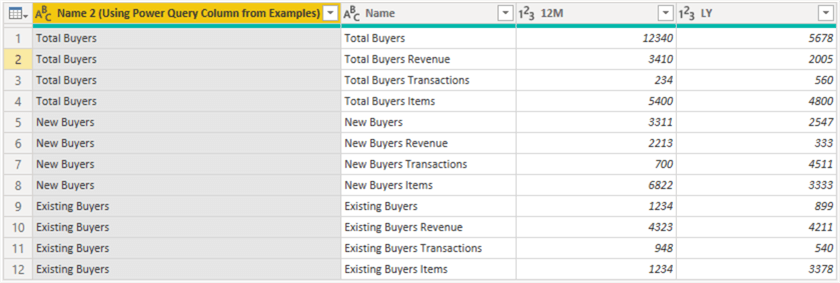
That would be it, the new column should look like the diagram below.
Custom Column Approach
If you choose to use Custom Column to add a new column to the dataset, then do the following:
- Click on the “Add Column” tab in Power Query and select “Custom Column” as seen in the diagram below.

- On the window that opens, you need write an M query to add a new column as required. See the sample M Query used here as shown below.
if(Text.Start([Name],2) = "To") then "Total Buyers" else
if(Text.Start([Name],2) = "Ne") then "New Buyers" else
"Existing Buyers"
The diagram below shows the window and code within it. Do note that the code above is literally saying, if the Name column has values that start with “To”, then represent it as “Total Buyers”, and if the Name column has values the starts with “Ne”, then represent it in the new column as “New Buyers”, and if the Name column has values that start with anything Else (in this case though) then represent it in the new column as “Existing Buyers”.

The new column created using Custom Column in Power Query should look like the diagram below.

Using DAX
Using DAX for this solution is like the same approach used with Power Query – we need to create a new column that holds the grouped column values from the Name column.
To do this, we simply create a calculated column as follows.
Name 3 (DAX) =
IF (
    LEFT ( 'Sheet1 (2)'[Name], 2 ) = "To",
    "Total Buyers",
    IF (
        LEFT ( 'Sheet1 (2)'[Name], 2 ) = "Ne",
        "New Buyers",
        IF ( LEFT ( 'Sheet1 (2)'[Name], 2 ) = "Ex", "Existing Buyers" )
    )
)

So, whichever approach you take up to this point is all the same – DAX or Power Query.
Display Data on Matrix Visual
Next, we need to show this on the Matrix visual as seen below.

As can be seen in the diagram above, I have used the new column created in DAX, I could have used the ones created in Power Query too. Also, we can see that the values “Total Buyers“, “New Buyers” and “Existing Buyers“” are still showing in the Sub- Column, this might not be the business requirement. In that case we need to remove them from the Matrix visual. We can do this either by creating a new Calculated Column or use the filter panel to exclude them. Let’s see how both is done.
Remove Name Using Calculated Column Approach
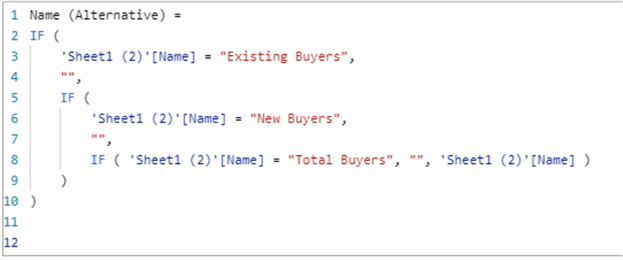
To create the calculated column, use the sample code below.
Name (Alternative) =
IF (
    'Sheet1 (2)'[Name] = "Existing Buyers",
    "",
    IF (
        'Sheet1 (2)'[Name] = "New Buyers",
        "",
        IF ( 'Sheet1 (2)'[Name] = "Total Buyers", "", 'Sheet1 (2)'[Name] )
    )
))
The column created should look like the one shown in the diagram below.
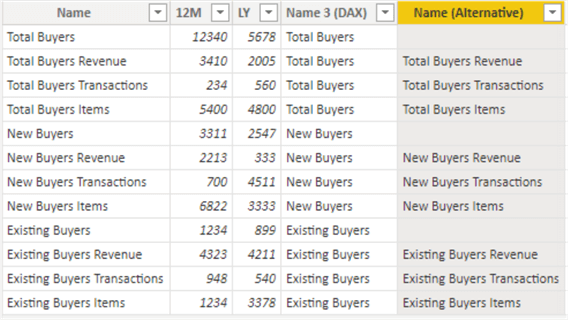
When this column is used in the Matrix visual, you should be able to see the diagram below.
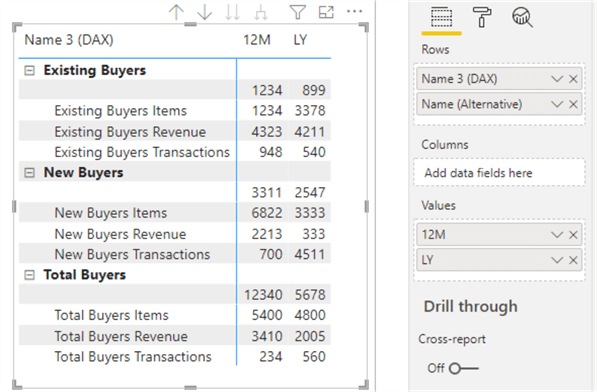
Now we can see that the “Total Buyers“, “New Buyers” and “Existing Buyers“” values are not repeating in the Sub-Column anymore by using the new “Name (Alternative)” column.
Remove Name Using Filter Panel Approach
As mentioned earlier, we can also achieve same by using the filter panel in Power BI to remove the rows individually as seen in the diagram below.

Next Steps
- Go through this Microsoft documentation on how the Text.Start M Query function works.
- Get more information on how to use the IF function in Power Query.
- See this article on Common Data Transformations in Power Query.
- Try this tip out in your own data as business requires.

Kenneth A. Omorodion is a Microsoft Certified Solutions Associate (MCSA) with 12+ years of enterprise application experience in Power BI, DAX, Microsoft Fabric, Business Intelligence, data warehousing, SSRS, T-SQL, and Azure. Beyond his technical skills, Kenneth has expertise working with stakeholders’ and business leaders to help them better understand key insights. He has a great track record of successfully delivering full life cycle Business Intelligence and data solutions to organizations with measurable business impact.
- MSSQLTips Awards
- Achiever Award (75+ Tips) – 2025
- Author of the Year-2021
- Author Contender-2022/2023/2024