Problem
The various Data and Analytics platforms on Azure support a number of unique methods of designing processes and implementing pipelines for Extraction, Loading, and Transformation (ELT) of your data. With Azure Data Factory and Synapse Pipelines, GUI driven tasks and activities simplify the design, implementation, and time to market for your ELT pipelines and jobs. Additionally, ADF’s Mapping Data Flows and Synapse Pipelines leverage Apache Spark’s compute engine under the hood.
Apache Spark’s unified analytics engine is a market game changer since it is capable of large-scale data processing and brings the architectural benefits of resilient distributed datasets (RDD) which supports fault tolerance for distributing data over clusters of machines. While there are numerous GUI based activities for data ingestion and transformation within Data Factory and Synapse Analytics, oftentimes Data Engineers that are building these ELT pipelines need more flexibility in their approach to building these ELT pipelines by having the capability to write custom code in multiple languages with access to open source and custom libraries.
Solution
With Databricks and Synapse Analytics workspaces, Azure’s two flagship Unified Data and Analytics Platforms, it is possible to write custom code for your ELT jobs in multiple languages within the same notebook. Apache Spark’s APIs provide interfaces for languages including Python, R, Scala, and SQL. Also, these platforms provide the capability of accessing custom and open-source libraries at either the cluster or notebook scope to provide Data Engineers with the right tools for developing their custom code to tailor their ELT scripts and processes to the unique business use cases and scenarios. While it is possible to write custom code in multiple languages with both Databricks and Synapse Analytics, in this article, you will gain a deeper understanding of how to write efficient custom code in PySpark, Scala, and SQL for ELT workloads using Databricks notebooks.
There are a few ways of writing custom code for extracting and loading data from a source to a destination in Azure. With Spark’s API support for various languages, ScalaSpark, SparkSQL, and PySpark can all be used within the same notebook when needed. Additionally, the Delta engine supports these languages as well. In this article, you will learn about a few use cases for extracting and loading Excel, XML, JSON, and Zip URL source data with custom PySpark code. Towards the end of this article, you will learn about how you could also use Scala, SQL, and User Defined Functions (UDFs) within your Databricks ELT notebooks.
PySpark
PySpark is an interface for Apache Spark in Python, which allows writing Spark applications using Python APIs, and provides PySpark shells for interactively analyzing data in a distributed environment. PySpark supports features including Spark SQL, DataFrame, Streaming, MLlib and Spark Core. In Azure, PySpark is most commonly used in the Databricks platform, which makes it great for performing exploratory analysis on data of a volumes, varieties, and velocities. It allows users to build machine learning pipelines and create ELT for the Data Lakehouse. Popular libraries such as Pandas along with custom libraries can be leveraged by PySpark analyses and pipelines. Users often struggle to get started with writing functional PySpark code and regularly search for patterns of success when getting started with PySpark for Lakehouse ELT jobs.
PySpark is widely used by Data Engineers, Data Scientists, and Data Analysts to process big data workloads. PySpark is great because it supports in-memory computations, distributed processing, fault-tolerance, immutability, caching, lazy evaluation, built in optimizations, and support for ANSI SQL. This makes applications that run on PySpark significantly faster than traditional systems. It seamlessly supports both streaming and machine learning pipelines which make it a popular choice for Data Engineer and Data Scientists that are interested in working with their big data residing in the Lakehouse. Databricks on Azure has been widely adopted as a gold standard tool for working with Apache Spark due to its robust support for PySpark. In this section, you will learn the fundamentals of writing functional PySpark code in Databricks for creating databases and tables, reading and writing a variety of file types, creating user defined functions (UDFs), working with dataframes and the Spark Catalog, along with other useful Lakehouse pipeline related PySpark code to ingest and transform your data.
The following section will demonstrate how to extract and load Excel, XML, JSON, and Zip URL source file types.
Excel
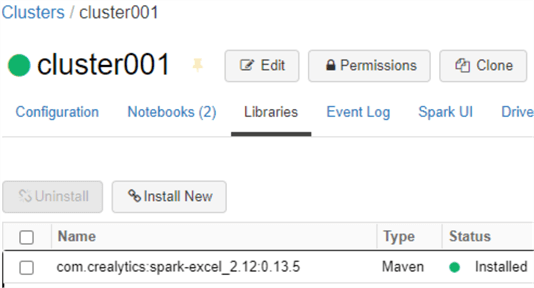
With Databricks notebooks, you can develop custom code for reading and writing from Excel (.xlsx) data sources that are stored in your ADLSgen2 account. Firstly, you’ll need to ensure that your ADLSgen2 account is mounted to your Databricks workspace so that your data will be accessible from your notebook. Before you begin development, ensure that you cluster has the following Maven library com.crealytics:spark-excel_2.12:0.13.5 installed on it. Simply head over to the libraries tab on your cluster, as shown in the figure below, and search for spark-excel in the Maven Central library source. When you find the above-mentioned library, install it on your cluster. For this exercise, I have used the following cluster version 9.1 LTS (includes Apache Spark 3.1.2, Scala 2.12).
Next, create a new Python notebook and ensure that the cluster that you previously created in attached to it. The PySpark code shown in the figure below will call the Maven Spark Excel library and will load the Orders Excel file to a dataframe. Notice the various options that you have at your disposal which include the capability for specifying headers, sheet names, and more. You can also specify the cell range using the dataAddress option.

Here is the PySpark code that you will need to run to recreate the results shown in the figure above.
excel=spark.read.format("com.crealytics.spark.excel").option("header", "true").option("sheetName", "Orders").option("dataAddress", "'Orders'!A1:F600").option("inferSchema", "true").option("useHeader", "true").option("treatEmptyValuesAsNulls", "true").option("addColorColumns", "False").load("/mnt/raw/Orders.xlsx")
After running the code successfully, run the display(excel) command to view the results of the Excel file being loaded to the dataframe. Notice from the figure below that the data is organized into a tabular format which makes this easy to consume for further analysis.

The following PySpark code shows how to read a CSV file and load it to a dataframe. With this method, there is no need to refer to the Spark Excel Maven Library in the code.
csv=spark.read.format("csv").option("header", "true").option("inferSchema", "true").load("/mnt/raw/dimdates.csv")
The display(csv) command will then retrieve the results in a similar tabular format as the previous example.

To take the use case a step further, notice from the sample PySpark code below that you have the option select the content from a CSV file and write it to an Excel file with the help of the Spark Excel Maven library.
csv.select("*").write.format('com.crealytics.spark.excel').option("header","true").option("inferSchema","true").save('/mnt/raw/dimdate.xlsx',mode="overwrite")
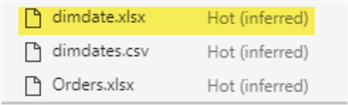
Sure enough, after the code successfully completes running, notice from the figure below that a new dimdate.xlsx file has been created in your ADLSgen2 account.
To further display the contents of this new file, you could run the following PySpark code to read the Excel file into a dataframe.
csv_to_xls=spark.read.format("com.crealytics.spark.excel").option("header", "true").option("inferSchema", "true").load("/mnt/raw/dimdate.xlsx")
When you run the display(csv_to_xls) command, notice from the figure below that the Excel file now contains the same data as the CSV file.

The XlsxWriter is a Python module for writing text, numbers, formulas and hyperlinks to multiple worksheets in an Excel (.xlsx) file. It supports highly customizable formatting and more. To install the XlsxWriter, run the pip install xlsxwriter within a cell of your Python notebook and notice the messages that will be displayed, as shown in the figure below, to confirm that it has been successfully installed.

Once installed, you will be able to import the xlsxwriter by using PySpark code similar to the following. You can then write custom PySpark code to extract, transform and load data within your Excel file.
import xlsxwriter
from shutil import copyfile

workbook = xlsxwriter.Workbook("/mnt/raw/Orders.xlsx")
worksheet = workbook.add_worksheet()
worksheet.write(0, 0, "Key")
worksheet.write(0, 1, "Value")
workbook.close()

copyfile('/mnt/raw/Orders.xlsx', '/mnt/raw/dimdate.xlsx')
XML
When working with XML files in Databricks, you will need to install the com.databricks - spark-xml_2.12 Maven library onto the cluster, as shown in the figure below. Search for spark.xml in the Maven Central Search section. Once installed, any notebooks attached to the cluster will have access to this installed library.

After you install the XML library, you’ll need to ensure that your xml data file is uploaded to your ADLSgen2 account which is mounted to your Databricks workspace. The code below shows a few sample records of the XML file books.xml that is used in this example. This is a Microsoft sample file which can bel found here: https://docs.microsoft.com/en-us/previous-versions/windows/desktop/ms762271(v=vs.85). In addition, you can find another sample xml file related to Purchase Orders here: https://docs.microsoft.com/en-us/dotnet/standard/linq/sample-xml-file-multiple-purchase-orders.
 <?xml version="1.0"?>
<catalog>
   <book id="bk101">
      <author>LEsteve, Ron</author>
      <title>The Definitive Guide to Azure Data Engineering</title>
      <genre>Computer</genre>
      <price>44.95</price>
      <publish_date>2020-08-01</publish_date>
      <description>Modern ELT, DevOps, and Analytics on the Azure Cloud Platform.</description>
   </book>
   <book id="bk102">
      <author>Ralls, Kim</author>
      <title>Midnight Rain</title>
      <genre>Fantasy</genre>
      <price>5.95</price>
      <publish_date>2000-12-16</publish_date>
      <description>A former architect battles corporate zombies,
      an evil sorceress, and her own childhood to become queen
      of the world.</description>
   </book>
   <book id="bk103">
      <author>Corets, Eva</author>
      <title>Maeve Ascendant</title>
      <genre>Fantasy</genre>
      <price>5.95</price>
      <publish_date>2000-11-17</publish_date>
      <description>After the collapse of a nanotechnology
      society in England, the young survivors lay the
      foundation for a new society.</description>
   </book>
</catalog>
After your xml file is loaded to your ADLSgen2 account, run the following PySpark script shown in the figure below to read the xml file into a dataframe and display the results. Notice that the format is not tabular, as expected because we have not yet integrated the spark xml package into the code.

Here is the PySpark code that you will need to run to re-create the results shown in the figure below.
df=spark.read.text("/mnt/raw/books.xml")
display(df)
Next, run the following PySpark code which loads your xml file into a dataframe using the previously installed spark xml maven package and displays the results in tabular format, as shown in the figure below.

Here is the PySpark code that you will need to run to re-create the results shown in the figure below. rowTag is the row tag to treat as a row and rootTag is the root tag to treat as the root.
df=spark.read.format("com.databricks.spark.xml").option("rootTag", "Catalog").option("rowTag","book").load("/mnt/raw/books.xml")
display(df)
With this next block of PySpark code, you will be able to use the spark xml package to write the results of the dataframe back to an xml file called booksnew.xml.
df.select("*").write.format('com.databricks.spark.xml').option("rootTag", "Catalog").option("rowTag","book").save('/mnt/raw/booksnew.xml',mode="overwrite")
You can then run the following code to read the file and retrieve the results into a dataframe.
df=spark.read.format("com.databricks.spark.xml").option("rootTag", "Catalog").option("rowTag","book").load("/mnt/raw/booksnew.xml")
display(df)
Finally, you could also create a SQL table using the following syntax which specifies the xml format, xml file path, and rowTag. With this table created, you’ll be able to write SQL scripts to query your xml data in tabular format.
%sql
CREATE TABLE books
USING xml
OPTIONS (path "/mnt/raw/books.xml", rowTag "book");
SELECT * FROM books;
JSON
There are numerous scenarios where you may need to read and write JSON data stored within your ADLSgen2 account from Databricks notebook. The following code json=spark.read.json('/mnt/raw/Customer1.json') defines a dataframe based on reading a json file from your mounted ADLSgen2 account. When the display(json) command is run within a cell of your notebook, notice from the figure below that the results are displayed in tabular format.
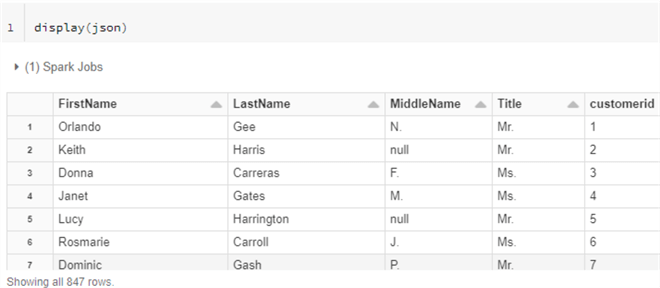
For reference, here are the first three rows of the Customer1 file to shown the structure of the json format.
{"customerid":1,"Title":"Mr.","FirstName":"Orlando","MiddleName":"N.","LastName":"Gee"}
{"customerid":2,"Title":"Mr.","FirstName":"Keith","LastName":"Harris"}
{"customerid":3,"Title":"Ms.","FirstName":"Donna","MiddleName":"F.","LastName":"Carreras"}
This next block of code is SQL syntax which can also be run within your Python notebook by specifying the %sql command in the beginning of the script. With the following scripts, you will be able to create temporary SQL view of the json format data. You could then write SQL statements to query the view just as you would a regular SQL table to retrieve the results in tabular format.
%sql
CREATE TEMPORARY VIEW json_table
USING json
OPTIONS (path "/mnt/raw/Customer1.json")

%sql
SELECT * FROM json_table
WHERE customerid>5
In the next scenario, you can read multiline json data using simple PySpark commands. First, you’ll need to create a json file containing multiline data, as shown in the code below. This code will create a multiline.json file within your mounted ADLSgen2 account.
dbutils.fs.put("/mnt/raw/multiline.json", """
[
    {"string":"string1","int":1,"array":[0,1,2],"key/value": {"key": "value1"}},
    {"string":"string2","int":2,"array":[3,4,5],"key/value": {"key": "value2"}},
    {"string":"string2","int":2,"array":[6,7,8],"key/value": {"key": "value2"}}
]""",True)
After the file is created, you can read the file by running the following script: multiline_json=spark.read.option('multiline',"true").json("/mnt/raw/multiline.json"). After that, the display(multiline_json)command will retrieve the multi-line json data with the capability of expanding the data within each row, as shown in the figure below.

Let’s go over one last JSON based scenario which would allow you to create a Resilient Distributed Dataset (RDD), which is a collection of elements that are partitioned across nodes of a cluster that can be operated on in parallel. In the code shown below, you would store the JSON object per string in a dataframe, create an RDD using the sc.parallelize command, and finally you’ll be able to read the data
# RDD[String] storing a JSON object per string
data = ['{"booktitle":"The Azure Data Lakehouse Toolkit","author":{"firstname":"Ron","lastname":"LEsteve"}}']
rdd = sc.parallelize(data)
df = spark.read.json(rdd)
df.printSchema()
Since the data has been displayed in a multiline format, shown in section 1 of the figure below, you can run the following command: display(df.select("booktitle","author.firstname","author.lastname")) to select the fields that you want to display in tabular format, shown in section 2 of the figure below. Alternatively, you can run this command to display the print format results shown in section 3 of the figure below: df.select("booktitle","author.firstname","author.lastname").show()

ZIP
Reading ZIP files from a URL and downloading them both locally within your Databricks notebook and into your ADLSgen2 mounted container is a capability by importing the urllib package into your notebook code. Simply run the following code and specify the url link to your zip data. Also note that you will not need to run the pip install command. The second part of the code will use the %sh magic command to unzip the zip file. When you use %sh to operate on files, the results are stored in the directory /databricks/driver. Before you load the file using the Spark API, you can move the file to DBFS using Databricks Utilities. The last block of code in this section of the script will list the files stored in the databricks/driver directory.
#Code to import the urllib package and read the contents of the specified URL zip file.
import urllib
urllib.request.urlretrieve("https://resources.lendingclub.com/LoanStats3a.csv.zip", "/tmp/LoanStats3a.csv.zip")


#Code the unzip the url zip file
%sh
unzip /tmp/LoanStats3a.csv.zip
tail -n +2 LoanStats3a.csv > temp.csv
rm LoanStats3a.csv


#Code to list the files in the folder
%fs ls file:/databricks/driver/
Notice from the figure below that the temp.csv file exists in /databricks/driver/

Finally, you can run the following script to move the file from the databricks/driver folder to your mounted ADLSgen2 account. The second section of the code will load the unzipped CSV file into a dataframe and display it. The final code in this section shows an option for running the %sh magic command to unzip a .zip file, when needed.
#Code to move the file from databricks/driver folder to your mounted ADLSgen2 account.
dbutils.fs.mv("file:/databricks/driver/temp.csv", "/mnt/raw/LoanStats3a.csv")


#Code to load the unzipped csv file in your ADLSgen2 account into a dataframe.
df = spark.read.format("csv").option("inferSchema", "true").option("header","true").load("/mnt/raw/LoanStats3a.csv")
display(df)

#Option for unzipping a zip file in your ADLSgen2 account
%sh
unzip mnt/raw/emp.zip
The figure below depicts the display of the tabular results of the unzipped data which has been loaded into a data frame.

Scala
Oftentimes, developers may choose to write their code in Scala since it is also object oriented like Python and is 10 times faster than Python due to its static type language. Some developers may find it easier and more user-friendly to use than Python. Also, Scala handles concurrency and parallelism very well, while Python doesn’t support true multi-threading. All that being said, developers can switch between Scala, Python, SQL, and R languages within their notebooks by simply specifying the language by using the %scala magic command. Multiple languages can be combined in the same notebook by using this process. As an example, the following code will achieve the same goals as the PySpark script in the XML section, with a few obvious syntactical differences. This shows how both PySpark and Scala can achieve the same outcomes.
// Infer schema

import com.databricks.spark.xml._ // Add the DataFrame.read.xml() method

val df = spark.read
  .option("rowTag", "book")
  .xml("dbfs:/books.xml")

val selectedData = df.select("author", "_id")
selectedData.write
  .option("rootTag", "books")
  .option("rowTag", "book")
  .xml("dbfs:/newbooks.xml")
SQL
Through a few scenarios in this article, we have explored just how easy it is to write SQL code within a notebook. This can be achieved by either creating a new notebook with the default language set to SQL or by specifying the magic %sql command within cells of the notebook. Within the notebooks, Databricks uses ANSI standard SQL dialect by default which makes it much easier to migrate your on-premises SQL workloads to the Lakehouse. Furthermore, with SQL you can query JSON as well as create User Defined Functions (UDFs). The following code shows how to query nested json format data using SQL.
SELECT
  book:bookid.author,
  book:bookid.title,
  book:bookid.genre,
FROM book;
SQL UDFs are easy to create as either temporary or permanent functions that can be reused across queries, and they allow developers to extend and customize SQL code in Databricks. They simplify the process of creating queries through better readability and modularity. The code below shows an example of how a function could be created to return the max number of books sold for a specified book id.
/* function to return max amount of books sold
** for the specified book_id
*/
CREATE FUNCTION udf_max_copies_sold_for_title (@book_id CHAR(6))
RETURNS INT
AS
BEGIN
   DECLARE @qty INT
   -- initialize the variable at 0:
   SELECT @qty = 0

   SELECT
      @qty = MAX(qty)
   FROM sales
   WHERE
      book_id = @book_id

   /* If there are no books sold for book_id specified
   ** then return 0:
   */
   RETURN ISNULL(@qty, 0)
END
Next Steps
- Read more about How Databricks’ New SQL UDF Extends SQL on Databricks W/O the Usual Limitations – The Databricks Blog
- Read more about Why NOT to use CSV with Apache Spark | by Mikhail Korolev | Medium
- Read more about how to Load data into a spark dataframe – Learn | Microsoft Docs
- Read the Introduction to Scala Programming – Databricks
- Read more about What is PySpark? – Databricks

Ron C. L’Esteve is a Data and AI Leader and professional Author residing in Chicago, IL, USA. He is well-known for his impactful books and article publications on Azure Data & AI Architecture, Engineering, and Leadership. Ron holds a Master of Business Administration (M.B.A.) and Master of Science in Corporate Finance (M.S.F.) from Loyola University Chicago. Ron possesses deep technical skills and experience in designing, implementing, leading, and delivering modern Azure Data & AI projects for numerous clients around the world. He is a Motorola Certified Six Sigma Green Belt, a Microsoft Global Challenger, and also holds numerous additional Microsoft, Snowflake, and Databricks professional certifications in Big Data Engineering, Artificial Intelligence, Apache Spark and Data Platform Architecture.
- MSSQLTips Awards: Champion (100+ tips) – 2023 | Author of the Year – 2020-2021 | Rookie of the Year – 2019