By: Rick Dobson | Updated: 2022-11-17 | Comments | Related: > Python
Problem
I notice the increasing popularity of remote data access from Restful Application Programming Interfaces (APIs). In this remote access scenario, data are collected from an API, often via JSON files, when a client computer connects to an endpoint on the computer running the API. I seek use case examples demonstrating how to download and process JSON files via Python from a Restful API.
Solution
This tip presents several examples for requesting and processing data from a Restful API accessible over the internet. JSON files are a common means for a Restful API to share data with remote client computers. Python is widely used for these kinds of use cases because of its power, simplicity, and adaptability to many tasks, including remote data access over webs. SQL Server developers will likely find Python somewhat familiar because it is just another scripting environment like T-SQL.
The examples in this tip walk you through several basic Python code examples for downloading data in JSON files over the internet. In addition to the code reviews, sample results are presented to clarify the operation of the code. The examples in this tip use Python version 3.10.4, available from the Python.org site, without charge. Python scripts are run in the IDLE application that automatically downloads when you install Python from the site.
Take time to read this previous article about key-value pairs, json files, and loading and displaying json files in Python. This article picks up where the last article leaves off.
This tip demonstrates the use of the Alpha Vantage Restful API with both JSON files and Python scripts. The Alpha Vantage API is a freemium service that makes securities and economics data available at free and paid levels. The techniques covered in this tip will likely help you request and collect data from other APIs that serve other kinds of data over the internet. Here are four additional resources for learning more about the weather, news, US Fiscal Data, and additional financial data Restful APIs.
To get started with the Alpha Vantage API, you must obtain a key to request data. Happily, a free key is available; no credit cards are required. You can also view the Alpha Vantage API documentation.
The Python script examples in this tip require you to obtain an Alpha Vantage key. However, scripts are available in this tip's download (see Next Steps). You can use your key with the Python scripts in the download to access the Alpha Vantage API. The scripts, excerpts from scripts' output, and the accompanying commentary in this tip are designed so that any motivated beginner or mid-level data professional can acquire the fundamentals of programming remote data access for Restful APIs with Python scripts for downloaded JSON files. Run the sample scripts in the download, and you will gain familiarity with the fundamentals of remote data access for Restful APIs.
Downloading Daily Prices and Volumes for a Ticker Symbol
The following screenshot is for a Python script to download daily prices starting from the most recent date at the time of the download for the SOXL ticker in Alpha Vantage.
- There are four import statements that reference libraries at the top of
the script.
- Three of these libraries (requests, json, and pprint) are internal libraries to the Python application. These install automatically when you install Python.
- The pandas library is an external one that does not ship with Python.
Therefore, you must install it before using it for the first time.
- Installation can be as easy as invoking the "pip install pandas" from a command window inside the root directory for Python. You may need to install the pip application if this does not successfully install the pandas library. If you feel the need, you can learn more here about how to install Pandas.
- The pandas library will be used within this tip to transform a set of key-value pairs that originate with a JSON file into a Pandas dataframe. A dataframe is a tabular array similar to a SQL Server table or an Excel worksheet.
- The first Python command invokes the Python open function to read a text file and assign the text value to a Python string object named key. Before running this script, you need to obtain your Alpha Vantage key value and make it available in a text file referenced by the script. Recall that you can get your key value from Alpha Vantage.
- Alpha Vantage and many other Restful APIs provide a collection of endpoints
for downloading different data types. The text string assignment for the
string object named URL illustrates how to obtain daily stock prices and volumes
for a ticker symbol.
- The text string "https://www.alphavantage.co/query/function=" sets up to reference an Alpha Vantage endpoint
- The text string "TIME_SERIES_DAILY" specifies the endpoint
- The text string "symbol=SOXL" designates SOXL as the ticker symbol for which to download daily price and volume data
- The text string "apikey=key" assigns the value in the Python key object to the request for downloaded data
- The get function from the requests library stores the response to the request
in a Python variable named r. The response (r) is the original JSON contents
returned by Alpha Vantage to the request designated by the URL string object.
When Alpha Vantage downloads JSON content, its format contains two outer keys
- The first outer key name is Meta Data. The nested keys in this outer key describe the structure of the downloaded data
- The second outer key is for the components of the downloaded data. The TIME_SERIES_DAILY endpoint returns data in three levels of keys. The second outer key name in this example is Time Series (Daily)
- Next, the JSON function for r transforms the output from JSON text values
to a Python dictionary object named data. Both r and data contain key-value
pairs, but the format for the values is slightly different.
- r contains string values in a JSON format
- Data contains a Python dictionary data structure populated with the string values from r
- The print function that references the Meta Data key in the data dictionary object displays the data structure in raw text format in the first key.
- The pprint function from the pprint library displays the data dictionary content in a "pretty print" format. A pretty print format highlights the relationships between nested keys in a Python dictionary and its underlying JSON file.
- The DataFrame function in the pandas library can transform the key-value
pairs in a Python data dictionary to a dataframe structure with rows and columns.
- In this example, the dataframe structure name is df_ts
- The Time Series (Daily) key name designates the components of the downloaded data from Alpha Vantage
- The T parameter transposes the data dictionary so that dates appear vertically down the rows of the df_ts dataframe.
- The print function displays the contents of the df_ts dataframe
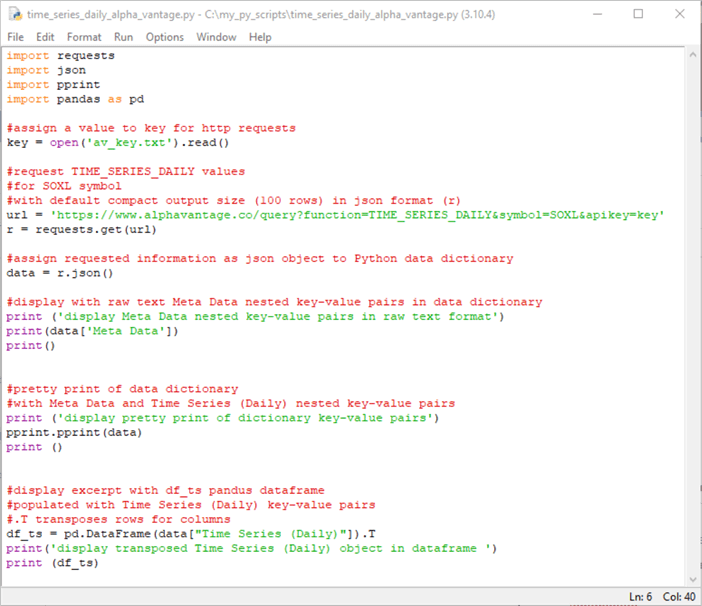
The remainder of this section tells a story about what the preceding script does by examining excerpts from the print and pprint function calls in the script.
The following screenshot shows the top of the IDLE Shell window with the first print function call output. This function call is to display the contents of the Meta Data key in the data dictionary.
- The top of the contents in the Shell window is highlighted in yellow. This content identifies the Python version used to run the code and other background issues that can impact the operation of the print function.
- The print function displays output in raw text. That is, the function has no special capabilities for recognizing the structure of key-value pairs within JSON text strings. As a result, the results from the print function appear as one long text string.
- There are five key-value pairs nested in the Meta Data key.
- The name of the first key is Information; the values for this key are daily prices which are composed of open, high, low, and close values, as well as daily volume values
- The second key is named Symbol; its value for this example is SOXL
- The third key, named Last Refreshed, reflects when the data were downloaded; Alpha Vantage delivers historical data, so the last refreshed date is typically one day before the run date for a script
- The name of the fourth key is Output Size. There are two possible
values for this key: Compact or Full.
- A value of Compact returns the most recent 100 daily rows of information for a symbol
- A value of Full returns all the rows of information available for a symbol
- When the Output Size value is not explicitly specified, as in this example, it is Compact by default
- The name of the fifth key is Time Zone; the value in this example is US/Eastern because the computer running the script was in the US/Eastern time zone

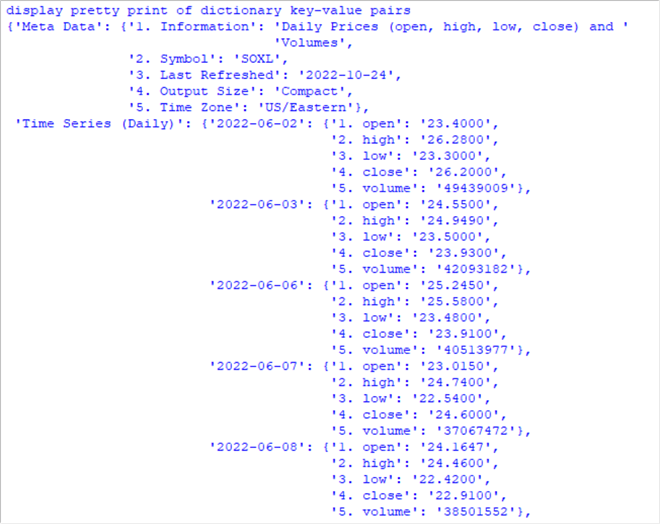
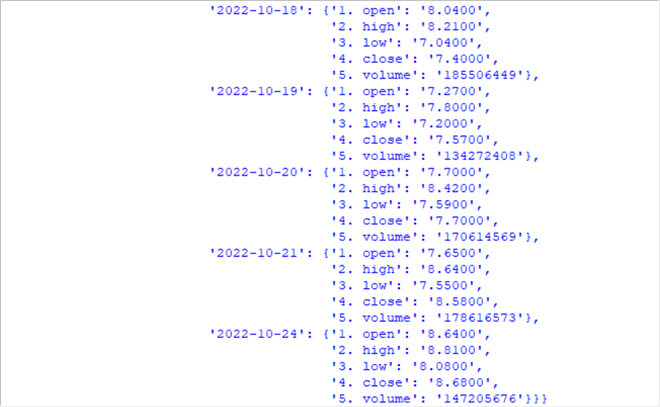
The following two screenshots show a selection of top and bottom lines from the pprint function output successively. This function is invoked to print all the contents of the data dictionary. The pprint function displays the contents of the data dictionary with formatting to highlight the underlying structure of the key-value pairs.
- There is an open curly brace ({) before the outer Meta Data key; this marks
the beginning of the JSON file content
- After a colon and a space, a pair of curly braces ({}) delimit the five key-value pairs nested within the Meta Data outer key
- Each nested key name is embraced within a pair of single quotes (‘'). For example, the first key name is 1. Information and the second key name is 2. Symbol
- A colon and a space separate each key name from its value that also appears in single quotes
- Each key-value pair is separated from the start of the next one by a comma
- The Time Series (Daily) outer key appears after the closing curly brace and a comma for the last nested key-value pair in the outer Meta Data key
- The next level of keys within the Time Series (Daily) key is a date key
in a yyyy-mm-dd format.
- An open curly brace appears before the first date. A close curly brace follows the last set of nested key-value pairs for the last date key.
- Date key names appear within single quotes. While date key names are strings because names are strings, Python can also interpret them as date values (with the help of the pandas library).
- The first date key name in the example is 2022-06-02; this is the first key name in the first following screenshot.
- The last date key name in the example is 2022-10-24; this is the last key name in the second following screenshot.
- The script was run on October 25, 2022. Therefore, the Alpha Vantage historical data runs through the day before the data are downloaded.
- There are a total of 100 date keys; this is because the default output size is 100
- Within each date key, there are five nested key-value pairs
- Each set of five keys for a date key appears within a set of curly braces
- These key names are string values that appear in single quotes
- The key names are 1. open through 5. volume
- The values for each of the keys are numeric; they appear in single quotes,
such as
- 23.4000 for the first key value nested within the first date key name
- 49439009 for the fifth key value nested within the first date key name
- 8.6400 for the first key value nested within the last date key name
- 147205676 for the fifth key value nested within the last date key name
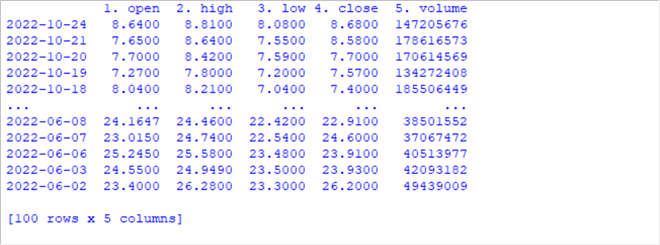
The next screenshot from the preceding script is for the print function output of the first and last five rows from the df_ts dataframe. This dataframe is generated by the DataFrame function from the pandas library. The function transforms string values from the Time Series (Daily) key to numeric and date values. The key names for the innermost set of keys serve as column names for the df_ts dataframe.
By default, this version of Python shows just the first and last five rows in a dataframe. After the last set of five rows, values in brackets denote the number of rows and data columns in the dataframe.
- A column of date values appears to the left of the five data columns. These date values correspond to the date key name values in the preceding pair of screenshots. The rows appear by default in descending date order from the most recent date through the least recent date. The column of date values serves as an index column for the dataframe
- The data columns appear in the order of the nested keys for date key names in the preceding screenshot
- The data column values for successive rows correspond to the innermost nested key values
Downloading Intraday Prices and Volumes for a Variable Ticker Symbol
The script in this section introduces two new features for downloading Python stock prices and volumes from Alpha Vantage.
- Instead of extracting just one set of prices and a volume of shares per
trading day, this script downloads intraday prices and the volume of shares
traded for multiple intervals within a trading day. The example in this
tip uses 30-minute intervals throughout a trading day. Other intervals
are available from Alpha Vantage; consult the
Alpha Vantage
documentation for details. By the way, a trading day has normal and
extended hours.
- The normal US trading times within a day are from 9:30 AM through 4 PM
- Alpha Vantage tracks extended hours from:
- 8 AM through the start of normal trading hours
- The close of normal trading hours through 8 PM
- The second new feature is that the script for this section can easily generate output for multiple ticker symbols. For example, you can run the script for a new ticker symbol by changing the value for one string assignment.
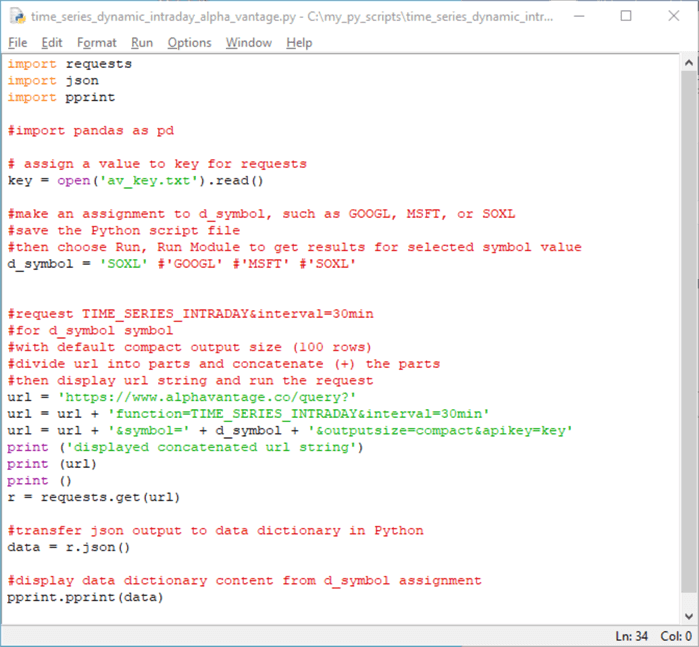
The script design below makes it particularly easy to change the value of the d_symbol object to GOOGL, MSFT, or SOXL. The version of the script below shows the assignment of the SOXL ticker symbol to the d_symbol string object.
Next, the d_symbol string object is spliced into the URL string object for denoting a parameter value to an endpoint for the Alpha Vantage API. The code inserts the current value of d_symbol with plus sign (+) operators into the URL string object.
There are two significant print statements in the script.
- The first print statement with the Python print function displays a URL string value. This URL value specifies the data that the client computer requests from the API. The downloaded data from the API eventually populates the current value of the data dictionary on the client computer.
- The second print statement with the pprint function from the pprint library displays its output in a pretty print format.
Before reviewing the output from the script, it will be helpful to draw your attention to some instructions in comment lines within the script. These instructions are in the three comment lines before the d_symbol assignment line.
- The first instruction is to copy one of the three tickers (or enter another ticker of your choice) into the d_symbol assignment statement.
- The second instruction is to save the edited script file. You can choose File, Save from the IDLE script editing window.
- The third instruction is to run the script with the freshly saved assignment for the d_symbol object.
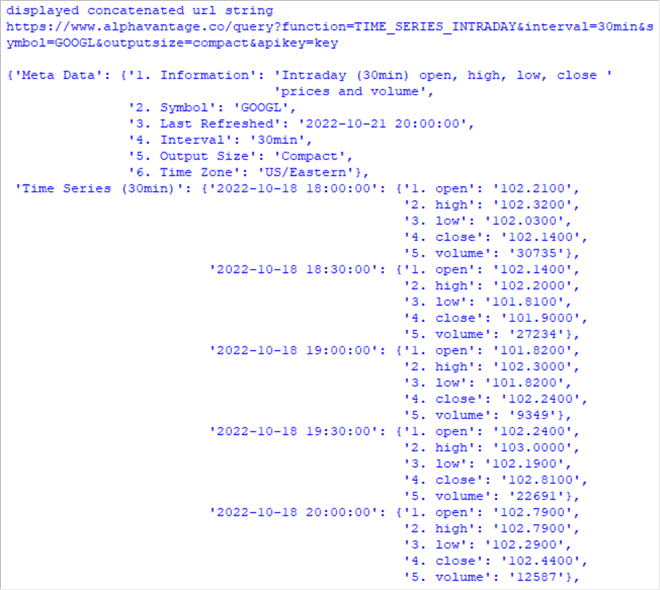
The following excerpt from the IDLE shell window is for running the script with an assignment of the GOOGL ticker symbol to the d_symbol object. The script was run on October 23, 2022. The output below shows the prices and volumes for the five least recent intervals in the results excerpt.
- The excerpt starts with the display of the URL string object value.
- Notice the assignment of GOOGL to d_symbol
- Also, note that the function starts with the designation of the TIME_SERIES_INTRADAY endpoint with an interval value of 30min
- The Meta Data key also confirms the output is for the GOOGL ticker symbol. Also, the interval for the output view of prices and volumes is indicated to be 30min for 30 minutes.
- The excerpt starts by showing five successive sets of nested price and volume
data for five successive dates. The date values are in ascending order.
- The first time interval is 6 PM (18:00:00) on 2022-10-18
- The second time interval is 6:30 PM on 2022-10-18
- The last time interval is 8:00 PM on 2022-10-18; this is the last time interval for which intraday data are available from Alpha Vantage
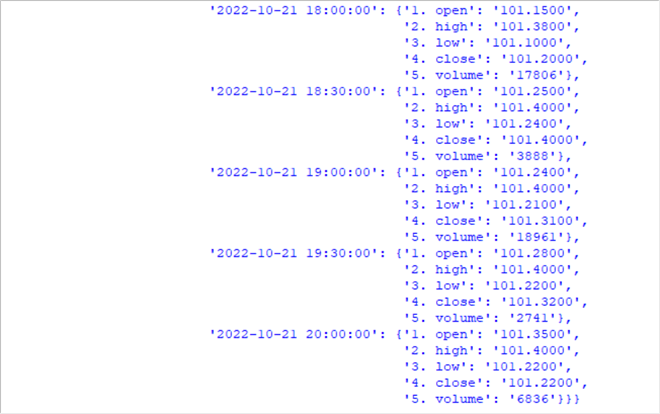
The next screenshot shows the five most recent intervals for the GOOGL ticker. The script was run on October 23, 2022.
- The most recent interval is 8 PM (20:00:00) on 2022-10-21. This is for the last interval in the series of datetime values because datetime values appear in ascending order. Also, 2022-10-21 is the Friday trading day before October 23, 2022, which is a Sunday when US markets are closed.
- The next four intervals on 2022-10-21 have ending times of 7:30 PM, 7 PM, 6:30 PM, and 6 PM.
- The nested values for the most recent interval are trailed by three curly
braces:
- One for the ending interval datetime
- A second one for the outer Time Series (30min) key
- A third one to close the entire data dictionary
The next screenshot is the output for the print statement for the URL string value when d_symbol is assigned MSFT. These results are from the same script as the two preceding screenshots (except that MSFT, instead of GOOGL, is assigned to d_symbol). Notice that the only difference is the symbol value, MSFT, in the following screenshot and GOOGL in the matching preceding screenshot.

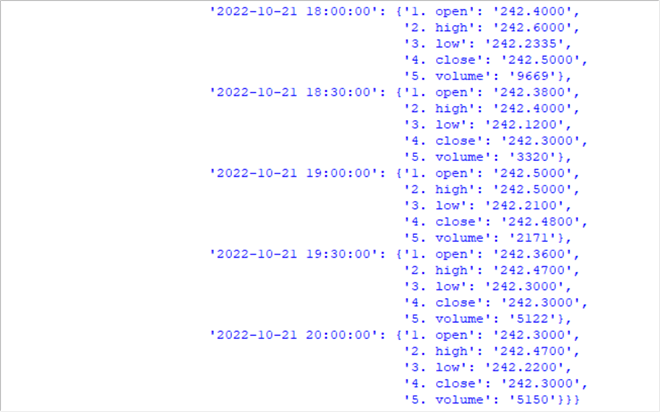
The next screenshot shows the five most recent intervals for the MSFT ticker. The script was also executed on October 23, 2022, a Sunday when the stock market is closed; therefore, the script returns values through the Friday before the weekend (2022-10-21).
- The ending datetime values are 2022-10-21 20:00:00, 2022-10-21 19:30:00, 2022-10-21 19:00:00, 2022-10-21 18:30:00, and 2022-10-21 18:00:00. These datetime values match the ending datetime values for the GOOGL symbol.
- Also, the last set of nested values is trailed by three curly braces
- One for the ending interval datetime
- A second one for the outer Time Series (30min) key
- A third one for to close the entire data dictionary
Sorting a Dataframe in Ascending and Descending Order by Index Values
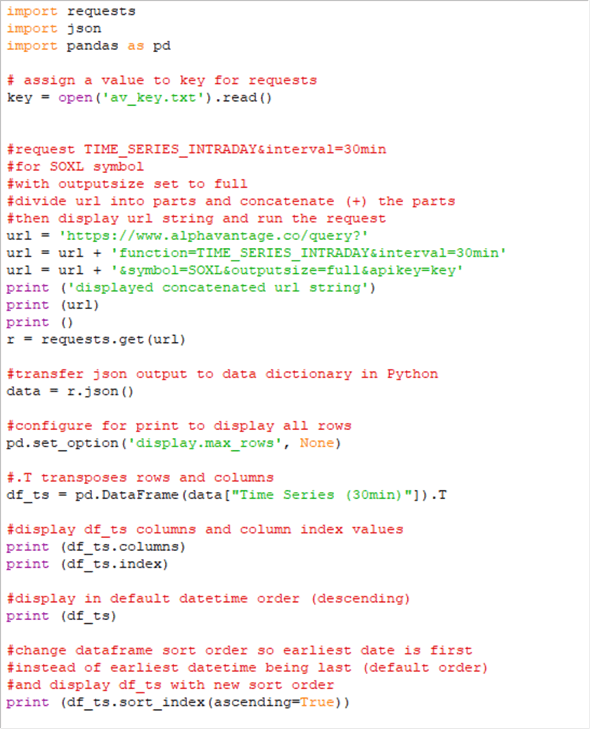
The following IDLE script window displays another example of Python source code for displaying a dataframe populated with JSON intraday data from Alpha Vantage.
- After assigning a key value to the Python string object named key, the code
submits a request to Alpha Vantage. The request is for
- intraday data with 30-minute interval lengths
- the ticker symbol with a value of SOXL
- a full output size – not just a compact size as in the prior examples
- The return JSON values from Alpha Vantage are transferred to a dictionary object named data
- The set_option function from the pandas library is invoked to display all rows for a dataframe from a Python print function -- not just the first and last five rows
- The DataFrame function from the pandas library is invoked with a T parameter value to extract key-value pairs from the data dictionary object for display in the df_ts dataframe with datetime values going down the rows of the dataframe
- A pair of print statements display
- the column names nested within an index indicator
- excerpts showing the first and last ten index values
- Next, a Python print statement prints the full set of rows in the df_ts dataframe in its default descending order; the order is by index values
- The last line of code in the script re-sorts the dataframe rows to ascending index values and then displays with a print function the re-sorted rows
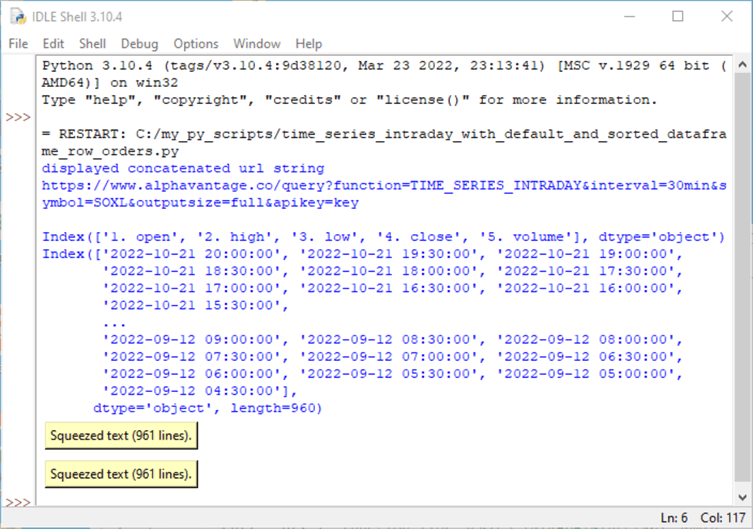
The following screenshot reveals the IDLE shell window populated by the preceding script.
- After the RESTART keyword towards the top of the screenshot, you can view the URL string used by the script to submit a request to the Alpha Vantage API.
- After the display of the URL string, the output from the print function with the df_ts.columns argument displays the column headers for the columns in the df_ts dataframe. The column headers appear nested within a set of parentheses preceded by the term Index. This indicates that the rows of the df_ts dataframe have index values.
- The next output set starts with the first ten index values followed by an ellipsis (…) that precedes the last set of ten index values. The index values are ordered from the most recent datetime index value through the least recent datetime index value.
- The bottom of the following screenshot ends with two buttons. These
button controls access to two different displays of the df_ts dataframe.
The first button is for the df_ts dataframe rows in their default descending
order by datetime values. The second button is for the df_ts dataframe
rows after they are re-sorted in ascending order.
- Notice there are 961 lines in the output for each button. This count includes 960 data rows with column values and one row of column headers.
- By right-clicking a button, you can copy or view the output in a re-sizable window.
- By double-clicking a button, you can open a display within the IDLE Shell window for the output from the df_ts dataframe.
The following screenshot reveals the first ten rows of the Squeezed Output Viewer for the dataframe rows in their default descending order. Notice that the datetime values occur in descending order starting with the most recent date. These dates correspond to the first ten datetime index values. In addition to the index values, the viewer shows the column values for the first ten rows in the df_ts dataframe.

This next screenshot shows the first ten dataframe rows after they are sorted in ascending order by datetime values. These dates correspond to the last ten datetime index values. In addition to the index values, the viewer shows the column values for the last ten rows in the df_ts dataframe.

Next Steps
This tip's download has three resource files – one for each example of requesting and processing JSON data from the Alpha Vantage API with a Python script. A separate section in this script is devoted to each example.
You will obtain a different result from the scripts than they appear in this tip. This is because Alpha Vantage provides historical data – typically starting from the day after a script runs. When you run the scripts, they will provide historical data from the day after you run them, whenever that may be. The returned historical data is for historical trading days – not historical calendar days. Calendar days and trading days within a year are different because US stock markets are closed on weekend days and selected holidays throughout the calendar year.
Before running the scripts in the download, recall that you must obtain a free key from Alpha Vantage. You can store this key in a text file to which your script samples refer, or you can paste the text for your personal Alpha Vantage key directly into the script.
You may be able to adapt many additional examples from the Alpha Vantage documentation. The Alpha Vantage examples are described at a much more cryptic level than the examples in this tip. Nevertheless, if you can get the samples in this tip to work for you, then you will likely also be able to adapt the samples in the Alpha Vantage documentation to work for you. One or more of these additional examples may be precisely what you seek to run.
Beyond the Alpha Vantage API, this tip exposes you to extracting and processing data from other APIs. The Solution section of this tip includes four links to additional sets of APIs. You may find the content from one of the other referenced APIs to be a sufficient motivator to apply the lessons learned from this tip to another API besides Alpha Vantage.
About the author
 Rick Dobson is an author and an individual trader. He is also a SQL Server professional with decades of T-SQL experience that includes authoring books, running a national seminar practice, working for businesses on finance and healthcare development projects, and serving as a regular contributor to MSSQLTips.com. He has been growing his Python skills for more than the past half decade -- especially for data visualization and ETL tasks with JSON and CSV files. His most recent professional passions include financial time series data and analyses, AI models, and statistics. He believes the proper application of these skills can help traders and investors to make more profitable decisions.
This author pledges the content of this article is based on professional experience and not AI generated.
View all my tips
Article Last Updated: 2022-11-17


