Problem
I work in a database group within a business consulting firm. We recently acquired a client that needs to correlate economic indicators with business indicators. Please present examples of importing and processing economic and business indicators to assess the degree of correlation of economic indicators with business indicators.
Solution
This tip illustrates how to correlate nominal and real Gross Domestic Product (GDP) with a business indicator. The tip also provides additional business indicators besides the one analyzed to practice the processing techniques with other data besides the business indicator covered in this tip.
As simple as this assignment sounds, it isn’t representative of what a database developer routinely does. Nevertheless, during times of economic adversity, it is not unusual to encounter business managers wondering about the correlation between economic indicators and company performance.
Moreover, economic indicators, such as nominal GDP or real GDP, have precise (and different) definitions within economics. To properly correlate these economic indicators with business indicators, you must be familiar with the indicators and the sources. Moreover, other widely referenced economic indicators, such as the Purchasing Managers’ Index, the Consumer Price Index, and Personal Consumer Expenditures, also have precise definitions. Using the wrong economic indicator for a correlation analysis can result in misleading conclusions about the impact of the economic indicator on a business indicator.
Importing Business Indicators
It is common for business and economic indicators to originate from different organizations that follow other practices for collecting and/or reporting data. These differences can require special codes for importing, processing, and reconciling the structure of economic indicators with business indicators for correlational analyses. For example, stock prices are typically recorded on a trading day basis, and product sales are often aggregated to weekly or monthly totals. In contrast, economic indicators are usually reported yearly, quarterly, or monthly without any indicator values available for daily or even weekly intervals.
For the business indicator in this tip’s examples, daily closing prices are tracked for the SPY ticker. This ticker is for the exchange-traded fund that tracks the daily prices of the S&P 500 index. This tip additionally provides daily close prices for the QQQ ticker and the DIA ticker, which are for the NASDAQ 100 index and the Dow Industrial Average, respectively.
The correlational processing examples in this tip are for the SPY ticker versus the nominal GDP and the real GDP. You can practice the processing steps for the SPY ticker with fresh data for the QQQ ticker and the DIA ticker. Given these experiences, you will be equipped to apply correlational analyses to business indicators from your organization, such as gross revenue overall as well as by product category and individual product lines.
The data for all three tickers are from the manual user interface for downloading historical data from Yahoo finance. A prior article reviews and demonstrates the steps for using the manual interface for downloading historical stock prices for a ticker symbol, such as SPY. The business indicator data available in this tip’s download are in three files – one file for each of the three tickers referenced above:
- SPY_from_yahoo_on_10_31_2022.csv
- QQQ_from_yahoo_on_10_31_2022.csv
- DIA_from_yahoo_on_10_31_2022.csv
Within this tip, the files are saved in this file path: C:\DataScienceSamples\Correlating_index_etfs_with_econ_indicators\. You can save the files in any other path on your computer. Just update the sample code to reflect the alternate path that is used.
The start date for each ticker is different because the security for each ticker started trading on a different date. If you try to collect data for a ticker before its first trading date, Yahoo Finance reminds you to change your request to the first date for which data is available for a ticker, which it supplies in the prompt. Data are collected through the last trading date in October 2022.
The following script includes the T-SQL code for importing the trading date price and volume data for each of the three tickers (SPY, QQQ, DIA).
- The script starts with a use statement that designates the Correlate_index_ETFs_and_ECON_indices database as the default database for the code. You can use any other database you prefer after updating the code for your preferred database name.
- Next, the script creates fresh empty versions of two tables.
- The design of the dbo.from_yahoo table reflects the structure of the downloaded data in the CSV files.
- Notice that there is no column to denote the ticker symbol. Each CSV file is for a specific ticker symbol. The table is re-used for each ticker (after truncating from the table the data from a prior ticker).
- Also, an ADJ Close column is used for special analyses outside this tip’s scope. The dbo.from_yahoo table retains this column to facilitate the easy use of the bulk insert command. Within the context of this tip, the bulk INSERT command imports the contents of a CSV file to a SQL Server table.
- The design of the dbo.symbol_date table is for a single table that holds concurrently downloaded data for all three tickers.
- Notice the designation of a symbol column. This column allows the solution to track each of the three tickers in a single table. Subsequently, you can extract data for whatever ticker is required by analysis.
- Notice that the ADJ Close column is missing from this table. It is not needed for this tip.
- The last statement in this code block adds a primary key constraint to the symbol_date table based on the table’s symbol and date columns.
- The design of the dbo.from_yahoo table reflects the structure of the downloaded data in the CSV files.
- After creating fresh copies of the from_yahoo and symbol_date tables, the code uses a bulk insert statement to transfer the contents of the SPY_from_yahoo_on_10_31_2022.csv file to the from_yahoo table. The bulk INSERT command is followed by a select statement that echoes the freshly populated from_yahoo table.
- Next, an insert into statement transfers the contents from the from_yahoo table to the symbol_date table. The select clause in the insert into statement
- Specifies a column value of SPY for the symbol column in the symbol_date table
- Omits the ADJ Close column from the symbol_date table
- Another select statement after the insert into statement echoes the contents of the freshly populated symbol_date table.
- The next block of code in the script is for bulk inserting data from the QQQ_from_yahoo_on_10_31_2022.csv file contents into a truncated version of the from_yahoo table. This block of code also transfers the contents of the from_yahoo table to the symbol_date table – except that it updates the symbol_date table for the QQQ ticker. At the end of this block of code, the symbol_date table has contents for both the SPY and QQQ tickers.
- The last block of code performs the same operation as the second code block – except that it updates the symbol_date table for the DIA ticker. At the end of this last block of code, the symbol_date table contains data for all three tickers (SPY, QQQ, and DIA).
use Correlate_index_ETFs_and_ECON_indices
go

drop table if exists dbo.from_yahoo

create table dbo.from_yahoo(
   [Date] [date] NULL,
   [Open] DECIMAL(19,4) NULL,
   [High] DECIMAL(19,4) NULL,
   [Low] DECIMAL(19,4) NULL,
   [Close] DECIMAL(19,4) NULL,
   [ADJ Close] DECIMAL(19,4) NULL,
   [Volume] float NULL
)
go

drop table if exists dbo.symbol_date

create table dbo.symbol_date(
   [Symbol] nvarchar(10) not NULL,
   [Date] [date] not NULL,
   [Open] DECIMAL(19,4) NULL,
   [High] DECIMAL(19,4) NULL,
   [Low] DECIMAL(19,4) NULL,
   [Close] DECIMAL(19,4) NULL,
   [Volume] float NULL
)
go

alter table symbol_date
add constraint pk_symbol_date primary key (symbol,date);

----------------------------------------------------------------------------------------------------------

-- bulk insert raw download for SPY into dbo.from_yahoo
bulk insert dbo.from_yahoo
from 'C:\DataScienceSamples\Correlating_index_etfs_with_econ_indicators\SPY_from_yahoo_on_10_31_2022.csv'
with
(
    firstrow = 2,
    fieldterminator = ',',  --CSV field delimiter
    rowterminator = '\n'
)

-- echo bulk insert
select * from dbo.from_yahoo

-- populate symbol_date with contents for SPY
insert into symbol_date
select
 'SPY' symbol
,cast([date] as date)
,[open]
,[high]
,[low]
,[close]
,[volume]
from dbo.from_yahoo

-- echo transferred data from dbo.from_yahoo
select * from symbol_date

----------------------------------------------------------------------------------------------------------

truncate table dbo.from_yahoo

-- bulk insert raw download for QQQ into dbo.from_yahoo
bulk insert dbo.from_yahoo
from 'C:\DataScienceSamples\Correlating_index_etfs_with_econ_indicators\QQQ_from_yahoo_on_10_31_2022.csv'
with
(
    firstrow = 2,
    fieldterminator = ',',  --CSV field delimiter
    rowterminator = '\n'
)

-- echo bulk insert
select * from dbo.from_yahoo

-- populate symbol_date with contents for SPY
insert into symbol_date
select
 'QQQ' symbol
,cast([date] as date)
,[open]
,[high]
,[low]
,[close]
,[volume]
from dbo.from_yahoo

-- echo transferred data from dbo.from_yahoo
select * from symbol_date

----------------------------------------------------------------------------------------------------------

truncate table dbo.from_yahoo

-- bulk insert raw download for QQQ into dbo.from_yahoo
bulk insert dbo.from_yahoo
from 'C:\DataScienceSamples\Correlating_index_etfs_with_econ_indicators\DIA_from_yahoo_on_10_31_2022.csv'
with
(
    firstrow = 2,
    fieldterminator = ',',  --CSV field delimiter
    rowterminator = '\n'
)

-- echo bulk insert
select * from dbo.from_yahoo

-- populate symbol_date with contents for SPY
insert into symbol_date
select
 'DIA' symbol
,cast([date] as date)
,[open]
,[high]
,[low]
,[close]
,[volume]
from dbo.from_yahoo

-- echo transferred data from dbo.from_yahoo
select * from symbol_date
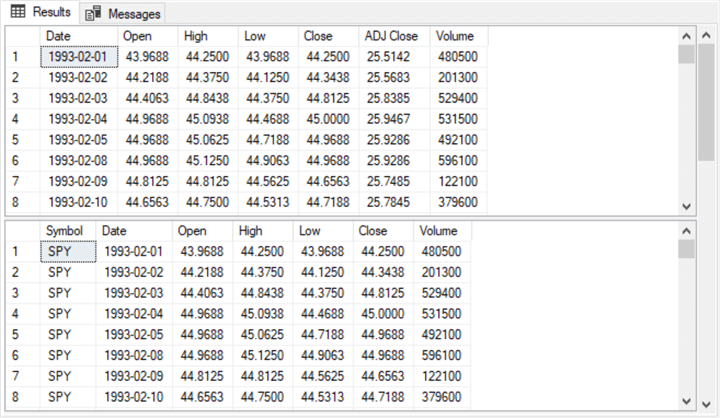
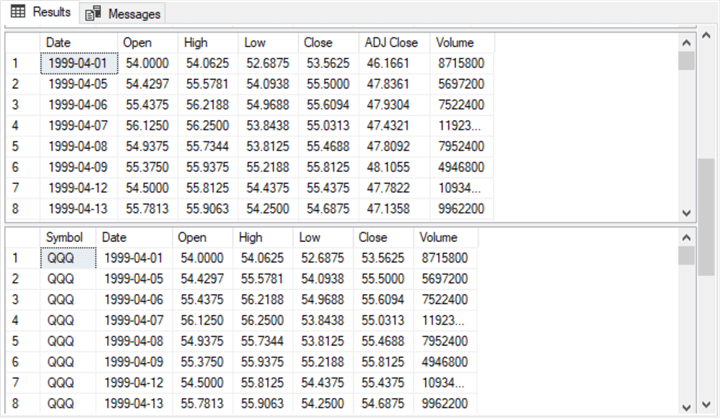
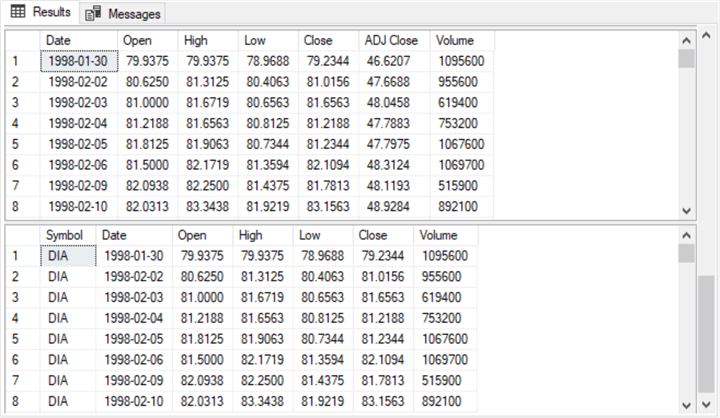
The following three screenshots show the first eight rows from the from_yahoo and symbol_date tables for each of the three tickers. The top pane from each screenshot displays rows from the from_yahoo table, while the bottom pane displays rows from the symbol_date table. The first, second, and third screenshots are for the SPY, QQQ, and DIA tickers, respectively. Within this tip, the Close column values serve as a business indicator.
Another interesting feature of the first eight rows for each ticker is that the start date varies by ticker symbol. The first date for a ticker denotes the initial listing date for a ticker’s underlying security on a stock exchange:
- The SPY ticker has an initial listing date of 1993-02-01
- The QQQ ticker has an initial listing date of 1999-04-01
- The DIA ticker has an initial listing date of 1998-01-30
Learning About and Using Two Types of GDP Indicators
Many economists and financial analysts consider GDP the main economic indicator for the health of a country’s economy. This indicator tracks the size of the overall economy of a country over a datetime period, such as a year or a quarter. The GDP is a lagging indicator because it reports economic activity through the end of a period. Also, it can take months from the close of a datetime period to get all the inputs for GDP. Therefore, the GDP can go through multiple revisions as more and better data for a period become available.
There are two main types of GDP indicators:
- The first type is the value of goods and services within an economy in current dollars. This approach is a good technique for assessing GDP in the current period. This approach generates an output called the nominal GDP.
- GDP can also grow because an economy produces more goods and services in the current period compared to a prior period. The additional goods and services have an economic value reflected in a larger GDP.
- A problem associated with the current dollar approach to valuing GDP is inflation. You can think of inflation as an increase in the cost of a fixed basket of goods and services over a succession of datetime periods. The increase in current dollars to purchase the same fixed basket of goods and services reflects inflation.
- As inflation increases, the size of an economy can appear to increase in current dollars without any growth in the goods and services produced by the underlying economy. This apparent increase from inflation is not because the economy produces more goods and services but because the same amount of goods and services costs more in current dollars relative to a prior period. Another way of expressing this is to say that current period dollars in one period are worth less than the current dollars in a prior period.
- Real GDP is a way of separating the growth in goods and services produced by an economy from the inflation in the cost of living. Real GDP achieves its goal by expressing the value of goods and services in the current period with dollars of a prior period (commonly referred to as a base period).
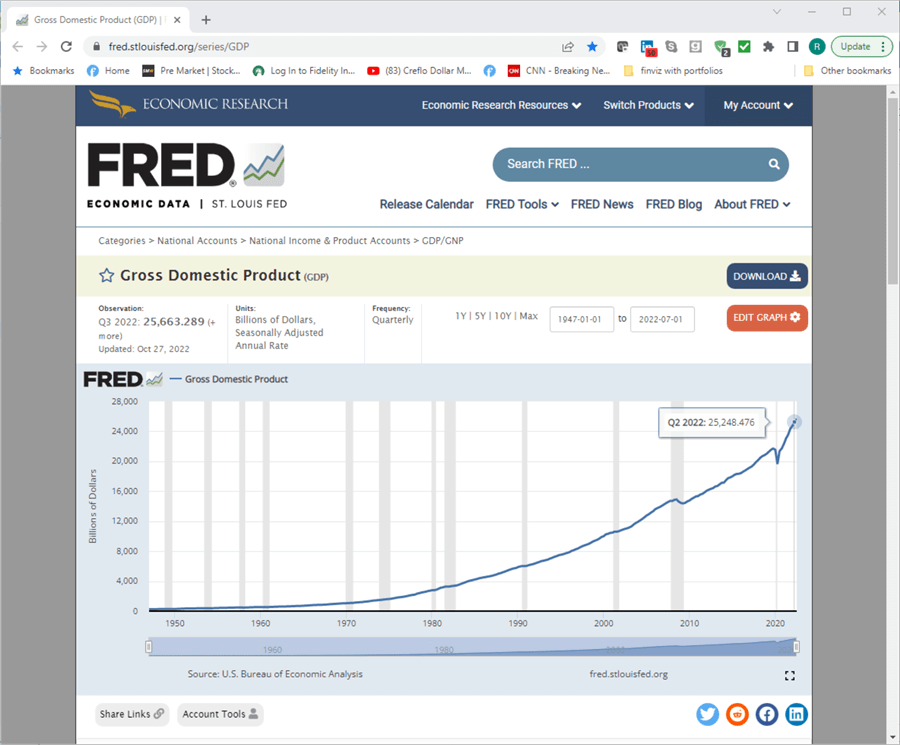
Data professionals do not have to compute nominal or real GDP. Data professionals need to understand the differences between the two types of GDP indicators and where to download each type of GDP. The St. Louis Federal Reserve (sometimes called the St. Louis Fed) is a widely recognized source for downloading each type of GDP.
This is a hyperlink for obtaining nominal GDP from the St. Louis Federal Reserve website. If you ctrl+click the hyperlink, you will see a web page like the following one that shows nominal GDP over time. The DOWNLOAD button towards the right edge of the web page permits you to download the underlying data to your computer in several different formats, including as a CSV file. Recall that this is the same format used to receive downloaded data from the Yahoo Finance site.
This is a hyperlink for obtaining real GDP from the St. Louis Federal Reserve website. If you ctrl+click the hyperlink, you will see a web page like the following one that shows real GDP over time. The DOWNLOAD button towards the right edge of the web page permits you to download the underlying data to your computer in several different formats, including as a CSV file. Notice that real GDP values are provided in chained 2012 dollars. The US Bureau of Economic Analysis introduced chained dollars in 1996 as a method for adjusting real dollars for the impact of inflation over time. Chained dollars require a base period, and 2012 is commonly used as a base year when reporting real GDP.

Code for Importing and Joining Two Types of GDP Indicators to a Business Indicator
The following script segment imports nominal GDP values from a CSV file. Before running the script, you need to download nominal GDP from the St. Louis Fed website to your computer as a CSV file. For the demonstration in this tip, a file named Nominal_GDP.csv was downloaded to the 'C:\DataScienceSamples\Correlating_index_etfs_with_econ_indicators path on the demonstration computer. Notice that a bulk insert statement transfers content from the downloaded file to a SQL Server table named date_nominal_gdp in the dbo schema of a database named Correlate_Index_ETFs_and_ECON_indices. The final statement in the script displays all rows from the date_nominal_gdp table.
use Correlate_index_ETFs_and_ECON_indices
go


-- This script segment is for Nominal GDP vs. the SPY ETF


-- GDP is the St Louis Fed name for the nominal GDP series
drop table if exists dbo.date_nominal_gdp

create table dbo.date_nominal_gdp(
   [DATE] [date] not NULL,
   [GDP] DECIMAL(19,4) not NULL
)
go

----------------------------------------------------------------------------------------

-- bulk insert raw download for nominal GDP from_st_louis_fed
bulk insert dbo.date_nominal_gdp
from 'C:\DataScienceSamples\Correlating_index_etfs_with_econ_indicators\Nominal_GDP.csv'
with
(
    firstrow = 2,
    fieldterminator = ',',  --CSV field delimiter
    rowterminator = '\n'
)

-- echo bulk insert
select * from dbo.date_nominal_gdp
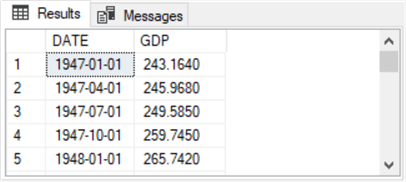
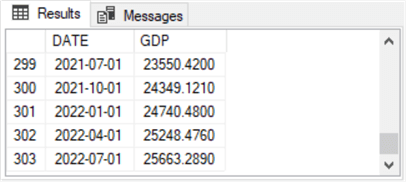
Here are the first and last five rows from the preceding script segment. The date_nominal_gdp table has two columns – one named date and the other named GDP. The results on each row are for a quarter within a year.
- The St. Louis Feb website denotes nominal GDP indicator values for the first date in a quarter for a year. Therefore, the date value of 1947-01-01 is for the first quarter of 1947. Consequently, the date value is slightly misleading because the row is not for a single day but for a whole quarter that begins on 1947-01-01 and ends on 1947-03-31.
- Similarly, the GDP value is the current dollar value in the first quarter of 1947. The value is in billions of current dollars for 1947.
- Contrastingly, the date for the last date column (2022-07-01) denotes the first date for the third quarter in 2022.
- Similarly, the GDP value for the last row is in billions of current dollars in 2022. Recall that a 2022 current dollar is worth a lot less than a 1947 current dollar because of inflation.
The second part of the script appears below. This part joins nominal GDP values to SPY close price values for quarters within successive years. Recall that these close prices are in the symbol_date table. The symbol_date table can have a different close value for each trading day within a quarter. One reasonable question is which trading day should be joined to the nominal GDP date for a quarter? Recall that the nominal GDP for a quarter reflects the GDP at the end of the quarter. Therefore, the SPY close price at the end of the quarter would be a good close value to join with the nominal GDP date for a quarter.
Another reasonable question is: what year and quarter should you start joining close prices and nominal GDP values? The downloaded nominal GDP values from the St. Louis Fed go back through the first quarter of 1947. However, SPY close values only started to become available on 1993-02-01. Therefore, the last close value for yearly quarters includes the first quarter of 1993, which ends on the last trading date in March 1993.
The script segment illustrates one approach for joining nominal GDP values to close prices by year and quarter. The joined values are used to populate the temp_for_max_date_year_quarter table. By using an inner join between two derived tables (symbol_date_year_quarter and date_nominal_gdp_year_quarter), a results set is formed that contains rows with matching year and quarter values. The final query in the following script segment extracts the largest date value for rows from the symbol_date_year_quarter and date_nominal_gdp_year_quarter derived tables. The results set from the final query has a single row for each matching year and quarter for values from the nominal GDP dataset and the SPY close value dataset. The single row for each year and quarter is the maximum date from each matching year and quarter.
-- input for last day in year, quarter for SPY Close versus Nominal GDP
drop table if exists temp_for_max_date_year_quarter

select
 symbol_date_year_quarter.symbol
,symbol_date_year_quarter.date
,symbol_date_year_quarter.quarter
,symbol_date_year_quarter.year
,date_nominal_gdp_year_quarter.[GDP]
,symbol_date_year_quarter.[Close]
into temp_for_max_date_year_quarter
from
(select
 *, year(date) year, DATEPART(QUARTER,date) quarter
from dbo.symbol_date where symbol = 'SPY') symbol_date_year_quarter

inner join

(select
 *, year(date) year, datepart(quarter, date) quarter
from [dbo].[date_nominal_gdp]) date_nominal_gdp_year_quarter

on symbol_date_year_quarter.year = date_nominal_gdp_year_quarter.year and
symbol_date_year_quarter.quarter = date_nominal_gdp_year_quarter.quarter

-- Nominal GDP and SPY close prices for
-- just last days in GDP report quarters
select
 *
from temp_for_max_date_year_quarter
where date in
(
-- last trading date in quarter
select max(date) last_date_in_year_quarter
from temp_for_max_date_year_quarter group by year, quarter
)
order by date
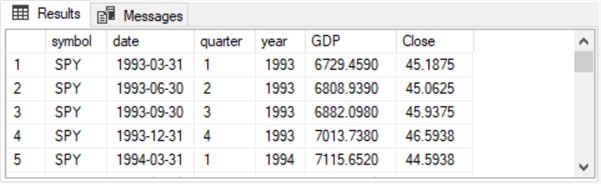
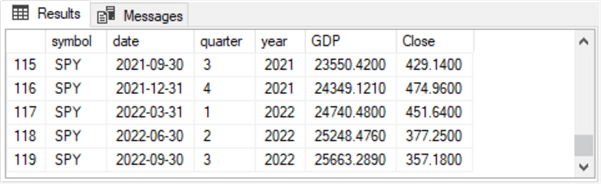
The following screenshots show the first and last five quarterly results from the final select statement in the preceding query. The last two columns in both screenshots display nominal GDP and SPY close values. The next section will examine the correlation between these two sets of column values with the help of Excel.
The following script shows an adaptation of the code in the preceding two script segments for nominal GDP and SPY close values to real GDP and SPY close values. The St. Louis Fed represents real GDP values with an economic indicator named GDPC1. Therefore, the script uses two tables to represent real GDP values. The first table (date_gdpc1) represents real GDP with its native name at the St. Louis Fed website. The second table transfers the bulk-inserted values from the date_gdpc1 table to a second table named date_real_gdp. The second table assigns the name [Real GDP] to the imported column of gdpc1 values from a CSV file downloaded from the St. Louis Feb website. After renaming the column of real GDP values, the code has the same structure as in the preceding script.
use Correlate_index_ETFs_and_ECON_indices
go


-- This script segment is for Real GDP vs. the SPY ETF

-- gdpc1 is the St Louis Fed name for the real GDP series
drop table if exists dbo.date_gdpc1

create table dbo.date_gdpc1(
   [DATE] [date] not NULL,
   [GDPC1] DECIMAL(19,4) not NULL
)
go

drop table if exists dbo.date_real_gdp

create table dbo.date_real_gdp(
   [DATE] [date] not NULL,
   [Real GDP] DECIMAL(19,4) not NULL
)
go

----------------------------------------------------------------------------------------

-- bulk insert raw download for real GDP from_st_louis_fed to dbo.date_real_gdp
bulk insert dbo.date_gdpc1
from 'C:\DataScienceSamples\Correlating_index_etfs_with_econ_indicators\Real_GDP.csv'
with
(
    firstrow = 2,
    fieldterminator = ',',  --CSV field delimiter
    rowterminator = '\n'
)

-- echo bulk insert
select *from dbo.date_gdpc1

-- insert dbo.date_gdpc1 into dbo.date_real_gdp
insert into dbo.date_real_gdp
select * from dbo.date_gdpc1

-- echo dbo.date_real_gdp
select * from dbo.date_real_gdp

----------------------------------------------------------------------------------------

-- input for last day in year, quarter for SPY Close versus Real GDP
drop table if exists temp_for_max_date_year_quarter

select
 symbol_date_year_quarter.symbol
,symbol_date_year_quarter.date
,symbol_date_year_quarter.quarter
,symbol_date_year_quarter.year
,date_real_gdp_year_quarter.[Real GDP]
,symbol_date_year_quarter.[Close]
into temp_for_max_date_year_quarter
from
(select
 *, year(date) year, DATEPART(QUARTER,date) quarter
from dbo.symbol_date where symbol = 'SPY') symbol_date_year_quarter

inner join

(select
 *, year(date) year, datepart(quarter, date) quarter
from [dbo].[date_real_gdp]) date_real_gdp_year_quarter

on symbol_date_year_quarter.year = date_real_gdp_year_quarter.year and
symbol_date_year_quarter.quarter = date_real_gdp_year_quarter.quarter


-- echo of temp_for_max_date_year_quarter
select * from temp_for_max_date_year_quarter


-- Real GDP and SPY close prices for
-- just last days in GDP report quarters
select *
from temp_for_max_date_year_quarter
where date in
(
-- last trading date in quarter
select max(date) last_date_in_year_quarter
from temp_for_max_date_year_quarter group by year, quarter
)
order by date
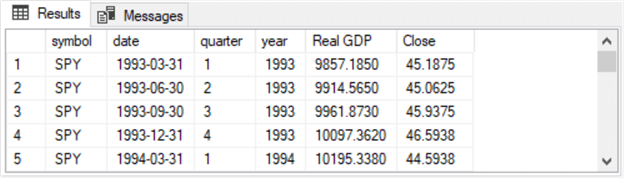
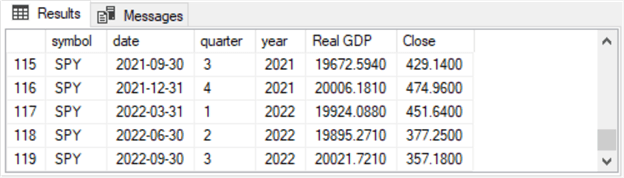
The following screenshots show the first and last five rows from the results set returned by the preceding script. Notice how the close column values from this script match those preceding. The business indicator values are the same in both scripts. On the other hand, the Real GDP values from this script are distinctly different from the nominal GDP values from the preceding script.
- For example, the first five real GDP values are all larger than their corresponding nominal GDP values.
- In contrast, the last five real GDP values are all smaller than their corresponding nominal GDP values.
Is Stock Performance Correlated to Either of Two GDP Types?
The preceding section displays excerpts from two datasets. One dataset is for Nominal GDP values by year and quarter versus SPY close prices by year and quarter. A second dataset is for Real GDP values by year and quarter versus SPY close prices by year and quarter. Both datasets extend over nearly 30 years (or more precisely 119 quarters) from 1993:1Q through 2022:3Q. This section presents top-line comparisons with evidence about the correlation of GDP values versus SPY close prices.
The following screenshot shows an excerpt from an Excel worksheet with Nominal GDP values versus SPY close values.
- The worksheet excerpt displays the beginning 48 quarters of data. The full worksheet contains all 119 quarters of data.
- The worksheet excerpt also displays three charts with SPY close values plotted against Nominal GDP values.
- The top chart is for the earliest half of the quarterly periods (from 1993:1Q through 2007:2Q), which is a duration of about 15 years
- The middle chart is for the most recent half of the quarterly periods (from 2007:3Q through 2022:3Q), which is also for a duration of about 15 years
- The bottom chart is for the full set of quarterly periods (1993:1Q through 2022:3Q), which is a duration of nearly 30 years
- Across all three charts, there is a clear tendency for SPY close values to increase along with nominal GDP values.
- However, the correlation seems to be greater for the most recent quarters than the earlier quarters.
- The coefficient of determination for the earlier quarters is .5924
- The coefficient of determination rises to .9187 for the most recent quarters
- The coefficient of determination for the full set of 119 quarters (.8057) is roughly midway between the earliest and most recent quarters.
- However, the correlation seems to be greater for the most recent quarters than the earlier quarters.

The following screenshot shows an excerpt from an Excel worksheet with real GDP values versus SPY close values. This worksheet is the same as the preceding worksheet, except that it shows plots of SPY close values versus real GDP values instead of nominal GDP values. The three charts on this worksheet also show a strong tendency for SPY close values to rise along with higher GDP values.
- There is no substantial difference in the correlation between SPY close values with real GDP values versus SPY close prices with nominal GDP values.
- However, the correlation is consistently larger for the most recent quarters than the earlier quarters.
- The coefficient of determination of SPY close values versus real GDP values is .9001 for the most recent quarters, and the coefficient of determination of SPY close values versus real GDP values is only .6633 for the earliest quarters
- This same pattern of results is evident when comparing coefficients of determination based on nominal GDP values versus SPY close values for the most recent quarters versus the earlier quarters

In conclusion, two main kinds of correlation results appear.
- Whether comparing nominal or real GDP values to SPY close values, SPY close values generally rise along with GDP values
- The correlation between GDP values and SPY close values is consistently stronger over the most recent 15 years versus the earlier 15 years. This pattern occurs whether the correlation is between either nominal or real GDP values and SPY close values
Next Steps
Hopefully, this tip will inspire you to build models of business indicators based on economic indicators.
One obvious next step is to see if you can duplicate the results reported in this tip. To help you achieve that objective, the download to this tip includes sample T-SQL scripts and CSV files with business indicators downloaded from Yahoo Finance as well as economic indicators downloaded from the St. Louis Fed website. An Excel workbook file in the download includes a couple of tabs that plot SPY close prices versus both nominal GDP and real GDP. The worksheets also display coefficients of determinations that assess the degree of correlation between SPY close prices and GDP values. Recall that you can also practice the computation and display steps for QQQ and DIA close prices.
If you have access to business indicators for your own company with both unit sales and revenue overall, by product category, and by product line, you can conduct correlations between business indicators for your own company and GDP indicators. These correlations may help you provide provocative insights to your managers about how to run their businesses in both good and poor economic times.

Rick Dobson is a SQL Server professional with decades of T-SQL experience that includes authoring books, running a national seminar practice, working for businesses on finance and healthcare development projects, and serving as a regular contributor to MSSQLTips.com. He has been a practicing Python developer for more than the past half decade – with a special emphasis for data visualization and ETL tasks with JSON and CSV files. His most recent professional passions include financial time series data and analyses, AI models, and statistics. If you are interested in growing your skills in any of these areas especially as they relate to financial securities, consider visiting his blog at https://securitytradinganalytics.blogspot.com/2023/12/.
- MSSQLTips Awards: Leadership (200+ tips) – 2025 | Author of the Year Contender – 2017-2024