Problem
Please demonstrate how to use T-SQL to estimate buy and sell date recommendations based on the three different technical indicators for stock price performance. Also, illustrate how to compare the calculated recommendations on various metrics, including number of recommended trades, close change percent for individual trades, and which stock symbols show the greatest close price percent change.
Solution
Previous tips in MSSQLTips.com demonstrated different approaches to calculating with T-SQL buy and sell recommendations for stocks with technical indicators for stocks. This kind of application illustrates artificial intelligence because a computer program (that can be written in T-SQL) rather than a human recommends when to buy and sell stocks. Each previous tip about buying and selling stocks focused on either introducing or improving the performance of a single technical indicator.
This tip goes beyond prior tips by demonstrating how to compare three different technical indicators for recommending buy and sell dates. You will be able to see commonalities across technical indicators of how to manipulate and calculate with T-SQL buy and sell recommendations. Prior tips on how to calculate and use the three technical indicators covered in this tip appear below.
- The MACD (Moving Average Convergence Divergence) indicators include three primary indicators (MACD line, signal line, and MACD histogram); some prior tips on these indicators are available ( here and here ). This tip contrasts the performance of the MACD line relative to its own centerline and signal line.
- The RSI (Relative Strength Index) relies on recent stock close prices to assess the relative strength of a stock. The RSI reflects relative stock price strength over a fixed window length. See prior coverage of this indicator from a T-SQL perspective here and here . This tip highlights a variation of the standard RSI approach with one that supplements the RSI with MACD-based indicators.
- Another technical indicator uses multiple moving averages to assess the direction and strength of a stock’s close prices. You can review T-SQL code for implementing this indicator here. The prior tip drilled down on predicting close prices from the strength of a trend in a direction. This tip switches the focus to how to use changes in the direction of a trend to estimate buy and sell date recommendations.
To keep the focus on the commonalities among techniques for generating buy and sell date recommendations and comparing outcomes, this tip assumes some familiarity with prior tips about programming technical indicators with T-SQL. Please see them when you feel the need for additional coverage beyond what is presented in this tip about the rationale for a technique or an elaboration of how to calculate recommendations. A follow-up tip to this one will focus on mixing and contrasting the recommendation strategies covered in this tip.
This tip relies on a previously developed database of NASDAQ historical price and volume data. To use the database with the scripts from this tip, you need to supplement the historical price and volume database with tables from selected other tips. The Next Steps section provides links and step-by-step instructions on how to download and recreate the data sources to run the code described in this tip.
Specifying a sample of ten stock symbols for comparing techniques
This section pulls an objective sample of ten stock symbols from the list of all NASDAQ stock symbols that were collected for the database of historical price and volume data used in this demonstration. All comparisons across techniques for calculating buy and sell date recommendations use the same set of ten symbols. The objective sample is based on the following rules for selecting stock symbols from the AllNasdaqTickerPricesfrom2014into2017 database.
- Each stock symbol must have a minimum number of daily traded shares of 100,000. This requirement is to ensure that stocks used for testing buy/sell recommendations are easily traded.
- Each stock was required to have data for a minimum of 900 trading days. This ensures that each stock symbol has plenty of data for which to compare buy and sell date recommendations derived from the different techniques.
- All stock symbols must have their most recent trading day on either November 7 or 8, 2017. The historical stock price data were collected from Yahoo Finance while updates for the current day of trading (November 8, 2017) were still in progress. So, the last trading day could be November 7 or 8, 2018. If a stock has historical data for neither of these two days, then it is not traded on a daily basis, and the stock is excluded from consideration for this tip.
- The minimum close price for a stock symbol must be at least $5. Institutional investors, which control the bulk of share transactions, tend to avoid stocks with a share price below $5.
Here’s the code for the objective list of stock symbols.
- There are originally 245 stock symbols that meet the investment grade stock criteria with a large sample in the AllNasdaqTickerPricesfrom2014into2017 database.
- A row_number function assigns a value (symbol_id) to each symbol to facilitate tracking and selection goals.
- However, this tip uses just the top ten even numbered symbol_id values ordered by difference between maximum and minimum close price from the first trade date in 2014 through the last trade date for which close prices were collected in 2017.
- If you want to verify the outcomes reported in this tip with a fresh set of stock symbols, you can run the code with the top ten odd number, instead of even number, symbol_id values ordered by difference between maximum and minimum close price.
-- put overall objective symbol list into ##symbol
begin try
drop table ##symbol
end try
begin catch
print '##symbol not available to drop'
end catch

select *
into ##symbol
from
(
-- set of symbols with
--minimum volume > 100000
--most recent date of '2017-11-07' or '2017-11-08'
--at least 900 time series rows of data
--minimum close price of $5
-- 245 symbols meet the criteria
-- row_number order is desc on max_close-min_close
select
row_number() over (order by max_close-min_close desc) row_number, *
from
(
-- 3266
select
 symbol
,min([close]) min_close
,max([close])  max_close
,min(volume)  min_volume
,min(date)    min_date
,max(date)    max_date
,count(*)     number_recs
FROM [AllNasdaqTickerPricesfrom2014into2017].[dbo].Results_with_extracted_casted_values
group by symbol
) for_outer_query
where
min_volume > 100000
and max_date >= '2017-11-07'
and number_recs > 900
and min_close > 5
) for_odd_even_row_number

-- copy overall objective symbol list into #temp
begin try
drop table #temp
end try
begin catch
print '#temp not available to drop'
end catch
go
select
 row_number symbol_id
,symbol
into #temp
from ##symbol order by row_number

-- filter overall objective sample list to
-- top ten symbols with odd symbol_id values
begin try
drop table ##symbol
end try
begin catch
print '##symbol not available to drop'
end catch
go
select *
into ##symbol
from #temp
where symbol_id % 2 = 0 and symbol_id <= 20
select * from ##symbol order by symbol_id
Here’s the result set from the last select statement in the preceding script.

Two models for buy/sell cycles based on macd indicators
It is common to define MACD buy/sell cycles based on crossovers of the MACD line relative to its centerline value. The MACD line value is defined as the difference for a relatively long-term moving average subtracted from a relatively short-term moving average. When processing end-of-day close prices as in this tip, the short-term moving average usually has a period length of 12 and the long-term moving average has a period length of 26. The centerline MACD line value is zero.
The buy and sell dates are normally defined by two transitions.
- When the MACD line crosses from below to above its centerline value, is a good time to buy a stock. This is because more recent close prices are increasing faster than less recent close prices.
- Just before the MACD line crosses from above to below its centerline value is a good time to sell a stock. This is because recent close prices are about to cease from increasing faster than less recent close prices.
A prior tip referenced in the Solution section examined the above rules for defining buy and sell dates. In that tip, it was discovered that close prices can decline considerably as the MACD line moves from above to below its centerline value of zero. This price decline can shrink the difference for the sell close price less the buy price. In fact, it is possible for small gains in close price change to become losses as the MACD line declines. The potential for a gain to convert to a loss is most noticeable for intermediate length as opposed to longer length buy/sell cycles.
One remedy for diminishing the impact of shrinking close price gains is to run a segmented model that uses one rule for intermediate length buy/sell cycles and another rule for longer length buy/sell cycles.
- It is sometimes possible to improve results by selling when the MACD line value declined below its signal line. Because the signal line is a moving average of the MACD line, the MACD line moves more rapidly than the signal line. Therefore, if the MACD line declines from above to below its signal line, you have an early warning that MACD line values are headed downward in the direction of the centerline value.
- The early warning signal is especially beneficial when the buy/sell cycle is of intermediate length as opposed to a longer length. Intermediate length buy/sell cycles typically have smaller price gains than buy/sell cycles with longer lengths. When the cycle is of intermediate length, selling a stock after its MACD line value falls below its signal line can help to capture previously achieved stock price gains before the close price diminishes further as the MACD line moves in the direction of the centerline value.
- For longer length buy/sell cycles, selling when the MACD line value initially falls below the signal line can lead to a truncated buy/sell cycle. This can happen because during lengthier cycles the MACD line can pass below, back above, and below again the signal line multiple times before a final drop on the way to the centerline. During successive passes above and below the centerline, close price can gain substantially. Therefore, selling on the initial drop of the MACD line below the signal line can result in missed price gains for longer length cycles.
Unfortunately, there is no well-known approach to predicting the length of a buy/sell cycle. As a result, the segmented model for intermediate length cycles versus longer length cycles is not of much use from a trading perspective. This tip confirms the relatively poorer performance of selling when the MACD line initially drops below the signal line versus just before when the MACD line falls below its centerline value. The poorer performance may be avoided if future data mining uncovers a valid technique for predicting the length of buy/sell cycle length.
The following script computes MACD buy dates and looks up associated close prices based on the date during which the MACD line value crosses from below zero to above zero. MACD sell dates are determined by either of two different rules.
- The first rule is to sell just before the MACD line value falls from above to below zero.
- The second rule is to sell on the first instance of two consecutive trading dates in which the MACD line value falls from above its signal line to below its signal line. By using two consecutive trading dates instead of just one date, this rule allows a stronger confirmation that the MACD line is, in fact, starting to fall in the direction of its centerline value.
As you can see, this script starts with a reference to the AllNasdaqTickerPricesfrom2014into2017 database. A succession of heavily commented code blocks generate key results for each rule. The following code summary identifies the blocks and provides a top line overview of how they operate.
- The first code block populates the ##sources_for_macd_cycles table.
- The source data for the code block is the macd_indicators table that contains daily historical close prices, MACD line values, and signal line values.
- Additionally, three fields are computed that are subsequently used for defining buy and sell dates along with their associated close prices. These three fields are derived from manipulations of the source data with associated leads and lags.
- The macd_gt_0_start field is one when the MACD line value for a symbol rises from below to above its centerline value.
- The macd_gt_0_end field is one just before the MACD line value for a symbol falls from above to below its centerline value.
- The macd_le_signal_2X field is one for the second of two consecutive trading dates after a buy date where the MACD line value is less than or equal to the signal line value.
- The second code block populates the ##macd_start_end_results table.
- This table contains key values for the implementation of the first rule for defining buy/sell dates.
- The source for the ##macd_start_end_results table is the ##sources_for_macd_cycles table.
- Each row in the ##macd_start_end_results table contains a symbol value along with column values for the start and end dates and corresponding close prices for a buy/sell cycle.
- Another key feature of the ##macd_start_end_results table is two columns defining, respectively, the change in close price amount and close price percent from the start of a cycle through to the end of a cycle.
- These results are calculated via a succession of nested queries.
- The third and fourth code blocks populate, respectively, the ##macd_start_end_early_results and ##macd_start_end_early_fixed_results tables.
- The ##macd_start_end_early_results table implements the second rule for defining sell dates for buy/sell cycles. Both the first and second rules use the same buy date for starting buy/sell cycles. This table can have null close change amount and close change percent column values when the MACD line value never falls below the signal line value for two consecutive days.
- For cases where the close change amount and close change percent column values for the second rule are null, the code for the ##macd_start_end_early_fixed_results table replaces the null values with close change amounts and close change percent values from the first rule. This fix eliminates null values for close change amount and close change percent columns.
- At the end of the preceding steps, the rows within the ##macd_start_end_early_fixed_results table contain close change amounts and close change percent values for both trading rules.
use AllNasdaqTickerPricesfrom2014into2017
go
-- sources for start and end of
-- macd cycles
-- the ##sources_for_macd_cycles table serves both
-- the macd_gt_0 cycles and macd_le_signal cycles
-- assigns values to macd_gt_0_start, macd_gt_0_end and
-- macd_le_signal_2X
-- source for the ##sources_for_macd_cycles table
-- is the macd_indicators table
begin try
drop table ##sources_for_macd_cycles
end try
begin catch
print '##sources_for_macd_cycles not available to drop'
end catch
-- add macd_le_signal_2X
select
 *
,
case
when
macd_lag_2 >  signal_lag_2
and macd_lag_1 <= signal_lag_1
and macd <= signal then 1
else null
end macd_le_signal_2X
into ##sources_for_macd_cycles
from
(
-- add macd_gt_0_start and macd_gt_0_end
select
 [symbol]
,date
,[close]
,macd
,macd_lag_1
,macd_lag_2
,signal
,signal_lag_1
,signal_lag_2
,case
when macd > 0 and macd_lag_1 <= 0 then 1
else null
end macd_gt_0_start
,
case
when macd > 0 and macd_lead_1  <= 0 then 1
else null
end macd_gt_0_end
from
(
-- result set with macd, macd_lead_1, macd_lag_1, macd_lag_2
-- signal, signal_lag_1, signal_lag_2
select [symbol]
      ,[date]
      ,[close]
      ,[macd]
  ,lag(macd,1) over (partition by symbol order by date) macd_lag_1
  ,lag(macd,2) over (partition by symbol order by date) macd_lag_2
  ,lead(macd,1) over (partition by symbol order by date) macd_lead_1
  ,lag(signal,1) over (partition by symbol order by date) signal_lag_1
  ,lag(signal,2) over (partition by symbol order by date) signal_lag_2
      ,[signal]
from [AllNasdaqTickerPricesfrom2014into2017].[dbo].[macd_indicators]
where
symbol in (select symbol from ##symbol)
) add_macd_gt_0_start_and_macd_gt_0_end
) add_macd_le_signal_2X
where signal_lag_1 is not null and signal_lag_2 is not null
order by symbol, date
-- for verifying layout and contents of ##sources_for_macd_cycles
-- select * from ##sources_for_macd_cycles

-------------------------------------------------------------------------------------------

-- populate ##macd_start_end_results, which is a single-row
-- result set with date and close price values for
-- start and end of macd_gt_0 cycles
-- code removes cycle starts with an end date, cycle ends
-- with a start date, and cycles with a duration of one day
-- source for ##macd_start_end_results is ##sources_for_macd_cycles
begin try
drop table ##macd_start_end_results
end try
begin catch
print '##macd_start_end_results not available to drop'
end catch
select
 row_number() over (order by symbol, rn_wi_symbol) cycle_number
,rn_wi_symbol
,symbol
,date_start
,date_end
,close_start_date
,close_end_date
,close_change_amt
,close_change_prcnt
into ##macd_start_end_results
from
(
-- new rn_wi_symbol column values identify
-- rows to keep on even rn_wi_symbol value
select
 symbol
,date_start
,lead(date_end,1) over (partition by symbol order by rn_wi_symbol) date_end
,[close] close_start_date
,lead([close],1) over (partition by symbol order by rn_wi_symbol) close_end_date
,lead([close],1) over (partition by symbol order by rn_wi_symbol) - [close] close_change_amt
,(lead([close],1) over (partition by symbol order by rn_wi_symbol) - [close])/[close]*100 close_change_prcnt
,row_number() over (partition by symbol order by symbol, date) rn_wi_symbol
from
(
-- retain only rows not marked for delete so that
-- each cycle starts with a start
-- and ends with an end
-- also assign date_start and date_end values
-- for macd cycles
select
*
,
case
when macd_gt_0_start = 1 then date
else null
end date_start
,
case
when macd_gt_0_end = 1 then date
else null
end date_end
from
(
-- add mark_for_delete field to identify rows with
-- ends as first row in a symbol and starts as last row in a symbol
select
case
when rn_wi_symbol = 1 and macd_gt_0_end = 1 then 'for_delete'
when rn_wi_symbol = max(rn_wi_symbol) over (partition by symbol order by symbol) and macd_gt_0_start = 1 then 'for_delete'
--when macd_gt_0_start = 1 and macd_gt_0_end = 1 then 'for_delete'
end mark_for_delete
,*
from
(
-- macd cycles, except one-day cycles, with rn_wi_symbol
select
 row_number() over (partition by symbol order by symbol, date) rn_wi_symbol
,*
from
(
-- starts and ends for all macd cycles
select
*
from ##sources_for_macd_cycles
where
(macd_gt_0_start = 1 or macd_gt_0_end = 1)
except
-- starts and ends for all one-day macd cycles
select
*
from ##sources_for_macd_cycles
where
macd_gt_0_start is not null and macd_gt_0_end is not null
) wo_one_day_macd_cycles
) for_mark_for_delete
) filter_based_on_mark_for_delete
--where mark_for_delete = 'for_delete'
where mark_for_delete is null
) for_date_start_and_date_end_on_one_row
) for_one_row_filter
where rn_wi_symbol % 2 = 1
-- for verifying layout and content of ##macd_start_end_results
-- select * from ##macd_start_end_results

-- ##macd_start_end_early_results is a table with intermediate
-- values for comparing trades based on both macd gt 0 and
-- macd gt signal (early trades)
-- the results are intermediate because early trades (macd_le_signal_2X)
-- sometimes have null amt and prcnt values when the macd does not cross
-- from above to below its signal satisfying the two contiguous row criterion
-- the source for ##macd_start_end_early_results is ##macd_start_end_results
begin try
drop table ##macd_start_end_early_results
end try
begin catch
print '##macd_start_end_early_results not available to drop'
end catch

create table ##macd_start_end_early_results
(
 cycle_number int not null
,rn_wi_symbol int not null
,symbol varchar(5) null
,date_start date null
,date_end date null
,close_start_date money null
,close_end_date money null
,close_change_amt money null
,close_change_prcnt money null
,date_early date null
,close_early_date money null
,close_change_amt_early money null
,close_change_prcnt_early money null
)
go
declare
@max_cycle_number int = (select max(cycle_number) from ##macd_start_end_results)
,@index int = 1

while @index <= @max_cycle_number
begin
insert into ##macd_start_end_early_results
select
*
,
(select
top 1 date
from ##sources_for_macd_cycles
where
date > date_start
and date < date_end
and macd_le_signal_2X = 1
and symbol = (select symbol from ##macd_start_end_results where cycle_number = @index)
) date_early
,
(select
top 1 [close]
from ##sources_for_macd_cycles
where
date > date_start
and date < date_end
and macd_le_signal_2X = 1
and symbol = (select symbol from ##macd_start_end_results where cycle_number = @index)
) close_early_date
,
(
(select
top 1 [close]
from ##sources_for_macd_cycles
where
date > date_start
and date < date_end
and macd_le_signal_2X = 1
and symbol = (select symbol from ##macd_start_end_results where cycle_number = @index)
)
-
close_start_date
) close_change_amt_early
,
(
(select
top 1 [close]
from ##sources_for_macd_cycles
where
date > date_start
and date < date_end
and macd_le_signal_2X = 1
and symbol = (select symbol from ##macd_start_end_results where cycle_number = @index)
)
-
close_start_date)
/close_start_date*100 close_change_prcnt_early
from ##macd_start_end_results
where cycle_number = @index

set @index = @index + 1
end

--------------------------------------------------------------------------------------
-- ##macd_start_end_early_fixed_results is derived
-- from ##macd_start_end_early_results
-- the fix is to add two new columns named
-- close_change_amt_early_fixed and close_change_prcnt_early_fixed
-- the new columns replace null early amt and prcnt values with
-- macd gt 0 amt and prcnt values

begin try
drop table ##macd_start_end_early_fixed_results
end try
begin catch
print '##macd_start_end_early_fixed_results not available to drop'
end catch

-- itemize macd gt 0 trades and macd gt signal trades
-- fix macd gt signal trades to revert to macd gt 0
-- trades when macd gt signal change amt and change prct
-- are null
select
 symbol
,date_start
,date_end
,close_start_date
,close_end_date
,close_change_amt
,close_change_prcnt
,date_early
,close_early_date
,close_change_amt_early
,close_change_prcnt_early
,
case
when close_change_amt_early is not null
then close_change_amt_early
else close_change_amt
end close_change_amt_early_fixed
,
case
when close_change_amt_early is not null
then close_change_prcnt_early
else close_change_prcnt
end close_change_prcnt_early_fixed
into ##macd_start_end_early_fixed_results
from ##macd_start_end_early_results

--*/
--------------------------------------------------------------------
-- REPORTING STARTS HERE
-- this block compares trade outcomes by trade within symbols,
-- by big winning trades (> 40%), and non-big winning trades
-- ordered by close_change_prcnt
-- for macd gt 0 trades followed by macd gt signal trades
-- source is: ##macd_start_end_early_fixed_results
-- macd gt 0 trades
select
 symbol
,date_start
,date_end
,close_start_date
,close_end_date
,close_change_amt
,close_change_prcnt
from ##macd_start_end_early_fixed_results


-- big winner (> 40%) to non-big-winner
-- for macd gt 0 trades
select
 symbol
,date_start
,date_end
,close_start_date
,close_end_date
,close_change_amt
,close_change_prcnt
from ##macd_start_end_early_fixed_results
where close_change_prcnt > 40
order by close_change_prcnt desc
select
 symbol
,date_start
,date_end
,close_start_date
,close_end_date
,close_change_amt
,close_change_prcnt
from ##macd_start_end_early_fixed_results
where close_change_prcnt <= 40
order by close_change_prcnt desc

-- macd cycles with macd gt 0 close ends close_change_prcnt by symbol
select
 symbol
,sum(close_start_date) close_start_date
,sum(close_change_amt) close_change_amt
,sum(close_change_amt)/sum(close_start_date)*100 close_change_prcnt
from ##macd_start_end_early_fixed_results
group by symbol

-- populate ##table_for_overall_median
-- from source_for_median query
-- assign name column_for_median to column
-- with values over which to compute median
begin try
drop table ##table_for_overall_median
end try
begin catch
print '##table_for_overall_median not available to drop'
end catch
select
close_change_prcnt column_for_median
into ##table_for_overall_median
from
(
-- macd cycles with macd gt 0 close ends close_change_prcnt by symbol
select
 symbol
,sum(close_start_date) close_start_date
,sum(close_change_amt) close_change_amt
,sum(close_change_amt)/sum(close_start_date)*100 close_change_prcnt
from ##macd_start_end_early_fixed_results
group by symbol
) source_for_median
go

-- invoke compute_overall_median stored procedure
-- display median as median_value from @tmpTable
declare @tmpTable TABLE (median_value real)
insert into @tmpTable
exec dbo.compute_overall_median
select * from @tmpTable
-- display input to unit test median value computation
select *
from ##table_for_overall_median
order by column_for_median desc


--------------------------------------------------------------------------------------

-- macd early trades
select
 symbol
,date_start
,date_end
,date_early
,close_start_date
,close_end_date
,close_early_date
,close_change_amt_early_fixed
,close_change_prcnt_early_fixed
from ##macd_start_end_early_fixed_results

-- big winner (> 40%) to non-big-winner
-- for macd gt 0 trades
select
 symbol
,date_start
,date_end
,date_early
,close_start_date
,close_end_date
,close_early_date
,close_change_amt_early_fixed
,close_change_prcnt_early_fixed
from ##macd_start_end_early_fixed_results
where close_change_prcnt_early_fixed > 40
order by close_change_prcnt_early_fixed desc

select
 symbol
,date_start
,date_end
,date_early
,close_start_date
,close_end_date
,close_change_amt_early_fixed
,close_change_prcnt_early_fixed
from ##macd_start_end_early_fixed_results
where close_change_prcnt_early_fixed <= 40
order by close_change_prcnt_early_fixed desc

---------------------------------------------------------------
-- macd cycles with early close ends close_change_prcnt by symbol
select
 symbol
,sum(close_start_date) close_start_date
,sum(close_change_amt_early_fixed) close_change_amt
,sum(close_change_amt_early_fixed)/sum(close_start_date)*100 close_change_prcnt
from ##macd_start_end_early_fixed_results
group by symbol

-- populate ##table_for_overall_median
-- from source_for_median query
-- assign name column_for_median to column
-- with values over which to compute median
begin try
drop table ##table_for_overall_median
end try
begin catch
print '##table_for_overall_median not available to drop'
end catch
select
close_change_prcnt column_for_median
into ##table_for_overall_median
from
(
-- macd cycles with early close ends close_change_prcnt by symbol
select
 symbol
,sum(close_start_date) close_start_date
,sum(close_change_amt_early_fixed) close_change_amt
,sum(close_change_amt_early_fixed)/sum(close_start_date)*100 close_change_prcnt
from ##macd_start_end_early_fixed_results
group by symbol
) source_for_median
go

-- invoke compute_overall_median stored procedure
-- display median as median_value from @tmpTable
declare @tmpTable TABLE (median_value real)
insert into @tmpTable
exec dbo.compute_overall_median
select * from @tmpTable
-- display input to unit test median value computation
select *
from ##table_for_overall_median
order by column_for_median desc
The remaining code blocks for MACD cycles in the preceding script switches the focus from developing close change amount and close change percent values to reporting top line results for each rule. This section starts with a comment containing “REPORTING STARTS HERE” in the macd_cycle_performance.sql file. This file is available for download with this tip. Four types of top line results are reported for each trading rule.
- At the most basic level, the code displays a list with the start date and end date for each buy/sell cycle implicitly ordered by symbol and trade start date. This basic data level also includes close price values at the start date and end dates as well as close change amount and close change percent values for each buy/sell cycle.
- Next, an excerpt is extracted from the full set of trading date results. The excerpt characterizes the performance of a rule by itemizing the symbols and dates for trading dates on which the close change percent is very large – namely, greater than forty percent.
- A third report set is for the remainder of the buy/sell ordered by close change percent.
- The fourth report set has two elements within it. These elements present summary information of the central tendency for close change percent values by the ten individual stock symbols and across all ten stock symbols in the sample of symbols for this tip.
- The first element is for the close change amounts and close change percent values aggregated by symbol.
- The second element is for the median of the close change percent values across symbols. The compute_overall_median stored procedure is used to compute median close change percent value across symbols. This stored procedure to compute a median value was previously described in a prior tip.
The following screen shot shows an excerpt of the full list of buy/sell cycle data for the first rule preceded by T-SQL code to generate the full result set. Recall that the first rule issues a buy recommendation when the MACD line value switches from a negative value to a positive value and a sell recommendation just before the MACD line value switches from a positive value to a non-positive value (zero or a negative value).
- The data source for the query’s result set is the ##macd_start_end_early_fixed_results table. This table stores outcomes for both the first and second rules for recommending sell dates.
- Over the course of nearly four years for ten stocks, there were 152 buy/sell cycles, which matches the count of total rows in the ##macd_start_end_early_fixed_results table. This overall number of rows in the table corresponds to nearly four trades per year per stock.
- The Results tab shows close change amount and percent values for the full set of twelve ALGN trades and the first two AMZN trades.
- The close change percent values vary substantially from one trade to the next even for the same symbol; for example
- the two most positive ALGN close change percent values are 39.94 followed by 12.93
- the two most negative ALGN close change percent values are -13.16 followed by -6.18

The next screen shot shows an excerpt of the full list of buy/sell cycle data for the second rule preceded by T-SQL code to generate the full result set. The second rule has the same buy date as the first rule. On the other hand, the recommended sell date within a cycle is the second trading date from the first of two consecutive trading days with the MACD line value below the signal line value after the prior recommended buy date. If there is no date that matches this criterion, the code uses the close price from the first rule without explicitly specifying a sell date.
- Although both the first and second rules share the same buy date recommendations and the same number of trades (152), the close change amount and close change percent values are usually based on different close values for the sell dates. You can confirm this for yourself by comparing the column values for close_change_prcnt in the preceding screen shot with close_change_prcnt_early_fixed in the next screen shot.
- The excerpted rows again are for the full set of twelve ALGN trades and the first two AMZN trades.
- While there is substantial variation in outcomes for the second rule just as for the first rule, the range of variation is less pronounced for the second rule; for example,
- the two most positive ALGN close percent change values are 9.72 and 0.48
- the two most negative ALGN close percent change values are -13.16 and -5.21

The next screen shot shows outcomes for big winning trades based on the first rule followed by an excerpt of the remaining trades for the first rule. Both result sets are ordered by close change percent value. The big winning trades are defined as those with a close change percent value of greater than forty percent. The second result set displays the top seven rows from the set of remaining trades. Across both result sets, the top thirteen trades are displayed.
- Several symbols, such as NFLX, AMZN, and TSLA, occur more than once in the top thirteen trades.
- However, it is also common for symbols to occur just once in the top thirteen trades. There is a total of six distinct symbols among the top thirteen trades (ICPT, SHPG, AVGO, ALGN, WYNN, ORLY) that occur just once.
- The top trade has a positive close change percent value of nearly sixty-one percent, and the thirteenth trade has a positive close change percent value of slightly more than twenty-five percent.

The next screen shot shows the corresponding two result sets for the second rule.
- The second rule does not result in any big winning trades with close change percent values of greater than forty percent. This outcome is confirmed by an empty top result pane.
- All 152 trades recommended by the second rule have close change percent values of less than or equal to forty percent. The top seven of these trades have close change percent values from 32.97 through to 15.93.
- There are five distinct stock symbols with trades among the top seven recommended trades.
- All five symbols among the top seven trades recommended by the second rule are also among the symbols in the top thirteen trades recommended by the first rule. However, there are two trades recommended by the second rule (TSLA starting on 2016-03-03 and AVGO starting on 2014-08-15) that are not among the top thirteen trades recommended by the first rule.

Here’s the code for close change percent values by stock symbol for trades from the first rule for recommending buy and sell dates.
- The close change percent values by symbol are derived by the first code block in the following script.
- After the symbol, the first two columns are close start prices and close change amount values from the buy date through the sell date.
- The close change percent value is merely the close change amount value divided by the close change start value (times one hundred to express the value as percentage points).
- The remaining code blocks in the script are to configure and transfer the close change percent values by symbol to the compute_overall_median stored procedure. The source code for the stored procedure is in a T-SQL starter statistics package.
-- macd cycles with macd gt 0 close ends close_change_prcnt by symbol
select
 symbol
,sum(close_start_date) close_start_date
,sum(close_change_amt) close_change_amt
,sum(close_change_amt)/sum(close_start_date)*100 close_change_prcnt
from ##macd_start_end_early_fixed_results
group by symbol
-- populate ##table_for_overall_median
-- from source_for_median query
-- assign name column_for_median to column
-- with values over which to compute median
begin try
drop table ##table_for_overall_median
end try
begin catch
print '##table_for_overall_median not available to drop'
end catch
select
close_change_prcnt column_for_median
into ##table_for_overall_median
from
(
-- macd cycles with macd gt 0 close ends close_change_prcnt by symbol
select
 symbol
,sum(close_start_date) close_start_date
,sum(close_change_amt) close_change_amt
,sum(close_change_amt)/sum(close_start_date)*100 close_change_prcnt
from ##macd_start_end_early_fixed_results
group by symbol
) source_for_median
go
-- invoke compute_overall_median stored procedure
-- display median as median_value from @tmpTable
declare @tmpTable TABLE (median_value real)
insert into @tmpTable
exec dbo.compute_overall_median
select * from @tmpTable
Here’s the output from the preceding code for the first rule for recommending MACD buy and sell dates.
- The top pane reports in the right-most column the aggregated close change percent value for the symbol in the left-most column.
- The bottom pane shows the median close change percent value derived from the close change percent values by symbol.
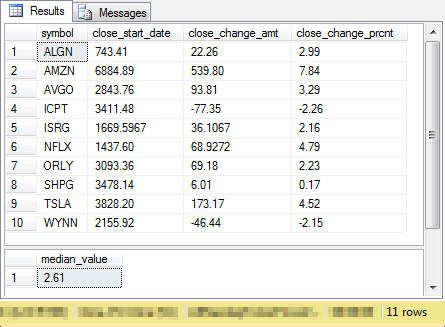
Here’s a comparable result set for the second rule with recommended sell dates based on the combination of MACD line values and their corresponding signal line values. The macd_cycle_performance.sql script file contains the code to generate the result displayed below.
- For this top line comparison, it may be most relevant to point out that the overall median close change percent value from the second rule is just .35 compared to 2.61 for the first rule. In other words, the first rule returns a greater median close change percent value across symbols. We previously discussed why this outcome is expected. Recall the discussion of buy/sell period length.
- The divergence in median values is also confirmed by the close change percent values for individual stock symbols. For example, the overall close change percent value for the AMZN symbol is 7.84 for the first rule, which is substantially more than the .08 value reported for the second rule.
- Another general observation is that the median close change percent values by symbol appear substantially smaller than the top close change percent values for individual trades. Therefore, if a trader can differentiate between best-performing trades and worst-performing trades early in a cycle, then the trader can keep the better performing trades to accumulate gains and dispose of the poorer performing trades to minimize exposure to trades that do not return top gains or even result in losses.

Two models for RSI buy/sell cycles
The goal of the Relative Strength Indicator (RSI) is to pinpoint stock price reversals. The RSI is based on a transformation of the relative strength of prices over a specified window of trading dates. The window length is typically the preceding fourteen trading dates when using end-of-day data as is the case for this tip. The computational logic does not define an RSI value until enough successive trading days have transpired to fill the first window. The computational logic and detailed T-SQL for computing RSI values are available in this link.
- The initial relative strength value is simply the average of the price gains divided by the average of the price drops.
- The transformation of relative strength to RSI results in values that range between zero and one hundred with a centerline value of fifty.
- Values of thirty and below are usually referred to as oversold values.
- Values of seventy and above are usually referred to as overbought values.
- Unfortunately, the path of RSI values over successive trading days does not necessarily move consistently from oversold to overbought and back to oversold. One typical path is for RSI values to move back and forth numerous times across the overbought boundary value after initially passing from above seventy to below seventy. During these successive moves across the overbought RSI boundary value, a stock’s closing price often increases substantially. Therefore, selling at the first drop below the overbought boundary can miss subsequent substantial price gains.
- A previous tip contrasted an MACD-based approach to the RSI-based standard approach for defining sell points in RSI cycles. Both types of sell dates were contrasted with one another for the same set of RSI-based buy dates. The goal was to assess if the MACD-based sell dates achieved higher close change percent values than RSI-based sell dates following an RSI-based buy dates. Data mining the outcomes confirmed that the MACD-based sell dates achieved higher close change percent values for two distinct sets of stock symbols.
- This tip presents a top line comparison of the two types of sell dates for RSI cycles with two other approaches to defining buy/sell cycles for historical stock price values.
- The preceding section illustrates one alternative approach. The preceding section used MACD indicator values to define buy and sell dates within MACD cycles.
- The next section presents a third approach. The strategy for the next section is to specify buy/sell cycles based on multiple moving averages with different period lengths.
- The code for computing buy/sell dates for RSI cycles is borrowed without modification from the prior tip.
- You can find the code for defining RSI cycles based on either RSI-based sell dates or MACD-based sell dates in the rsi_cycle_performance.sql file available for download with this tip.
- Because the prior tip fully describes and demonstrates the computational logic for computing buy/sell points with either RSI-based or MACD-based sell dates, the code is not described in this tip.
- Instead, this tip presents close change percent values derived from RSI-based sell dates and MACD-based sell dates within RSI cycles in a format for easy comparison with the other two approaches.
The screen shot below displays three result sets for the RSI cycles based on RSI-based sell dates.
- The top pane shows an excerpt from the full set of close change percent values for RSI cycles ended by an RSI-based sell date. The border for the screen shot reveals that there are just 28 cycles for the set of ten symbols over nearly four years. Recall that there is a total of 152 MACD cycles for the same set of symbols.
- The middle pane shows there is just one trade with a close change percent value of greater than 40 for RSI cycles terminated with an RSI-based sell date. This outcome is within the range of big winning trades from MACD cycles. Recall that there are
- six big winning trades for MACD cycles ending with a MACD line value just before zero
- zero big winning trades for MACD cycles ending with the second consecutive MACD line value below the signal line value
- The third pane shows the top seven trades after the sole big winning trade. When considering the trade with more than a forty close change percent value and the next seven largest trades,
- the RSI cycles ending with an RSI sell date roughly matched for the range of close change percent values for the corresponding MACD trades ending just before a negative MACD line value or with a MACD line value below the signal line for two consecutive periods
- there were also some differences between results for RSI cycles ending with RSI-based sell points and MACD cycles with either type of sell point. For example, the MACD cycles had higher value winning trades for four symbols that did not appear among higher value winning trades for the RSI cycles. These symbols include: SHPG, WYNN, TSLA, and ORLY

The next screen shot shows RSI cycle results for cycles ending with MACD-based sell indicators.
- You can see a marginal tendency for RSI cycles ending with MACD-based sell dates to have larger close change percent values than those ending with RSI-based sell dates. For example:
- the RSI cycles ending with MACD-based sell dates have three trades ending with close change percent values of more than forty, but just one trade ending with an RSI-based sell date has a close change percent value of more than forty
- all trades for the ALGN symbol ending with RSI-based sell date has a close change percent value of eighteen or less for trades, but one ALGN trade for cycles ending with a MACD-based sell date has a close change percent value of nearly fifty percent
- Also, the mix of symbols participating in the trades with the largest close change percent values either above or below forty percent are different for RSI cycles ending with MACD-based sell dates.
- The RSI cycles ending with MACD-based sell dates included two symbols (ORLY and TSLA) that were missing from those ending with RSI-based sell dates.
- On the other hand, there was one winning symbol (ICPT) from the trades with the largest gains for cycles ending with RSI-based sell dates that was not present among the corresponding RSI cycles with MACD-based sell dates.

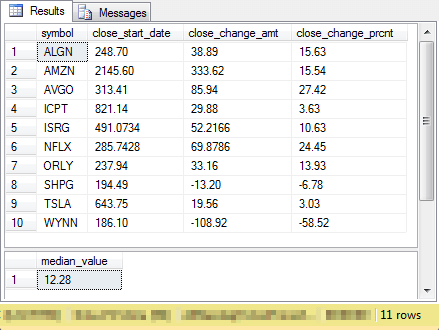
The next pair of screen shots present information about the close change percent values aggregated by symbol as well as the median close change percent value across symbols for RSI cycles ending with either an RSI-based sell date or a MACD-based sell date.
- The first screen shot is for RSI cycles with RSI-based sell dates.
- The second screen shot is for RSI cycles with MACD-based sell dates.
The most significantly different outcome by far is that the median close change percent values for RSI cycles are substantially greater than for MACD cycles.
- The two median close change percent values for RSI cycles are, respectively, around 12 and 13.
- The two close change percent values for MACD cycles with sell dates based on a centerline crossover or a signal line crossover are both below 3.
- There is clearly something about RSI cycles relative to MACD cycles that results in greater close change percent values across symbols.
Although the order of the aggregated close change percent values is not identical across symbols, there is substantial agreement both within and between MACD and RSI cycles.
- AMZN and AVGO is among the top three for all four sets of close change percent values by symbol.
- Additionally, all four sets of close change percent values include an aggregated negative value for the WYNN symbol.

The multiple moving average trend up model for buy/sell cycles
The multiple moving average trend up model is an adaptation of earlier work by Darryl Guppy on using multiple moving averages for estimating good dates for buying and selling stocks. An introduction to the multiple moving average trend up model appears in this prior tip along with T-SQL code for operationalizing many aspects of the model. That initial code is extended further in this tip – especially for defining trend up buy/sell cycles that are analogous to MACD buy/sell cycles and RSI buy/sell cycles. Additionally, this tip further extends the prior multiple moving average trend up model code by adding top line reporting code for comparing multiple moving average trend up cycle change close percent values to those for MACD and RSI cycles.
A multiple moving average trend up is defined over a set of exponential moving averages. The prior tip on implementing the multiple moving average trend up model used ten, thirty, fifty, and two-hundred period exponential moving averages. For a time series value to meet the criteria for inclusion in a trend up, the ten-period average must be greater than the thirty-period average, and the thirty-period average must be greater that the fifty-period average, and the fifty-period average must be greater than the two-hundred-period average. Furthermore, at least two contiguous time series must meet the set of criteria. There are a few other criteria, but these will be discussed as we review the code.
The first time series value in a contiguous trend up series is a start value, which is analogous to the buy date for MACD and RSI cycles. The last time series value in a contiguous trend up series is an end value, which is analogous to the sell date for MACD and RSI cycles. By computing the difference between the close prices for the end and start of a contiguous trend up series you can compute the close change amount value. Similarly, you can compute the close change percent value for a contiguous trend up series by multiplying the quotient by 100 for the difference between start and end close prices divided by the close price for the start of a contiguous trend up series.
This tip computes start and end dates for trend up cycles in one code block and close price change amount and close change percent values in a second code block.
The first code block appears below. This code block assumes you have run and are keeping open the script to populate the ##sample table from the “Specifying a sample of ten stock symbols for comparing techniques” section; recall the script defines a set of ten stock symbols based on objective criteria.
The code block below creates and populates a table named ##mma_trend_up_starts_and_ends. This table contains the start and end dates of each trend up cycle in the AllNasdaqTickerPricesfrom2014into2017 database for the ten symbols examined in this tip; the results are generated exclusively for the stocks in the ##sample table. The code uses a sequence of nested queries to extract the base data for trend up cycles and format the start and end dates for trend up cycles so that they appear in the rows of the ##mma_trend_up_starts_and_ends table along with the symbol to which the trend up cycles pertain.
The following code block starts with a reference to the AllNasdaqTickerPricesfrom2014into2017 database. The inner-most query draws on a table from this database.
- The inner-most query has the name for_start_end. This query is used once for defining start date rows and again for defining end date rows. A union operator concatenates the collection of start date rows and end date rows. This concatenated row set serves as the source data for the for_excluding_rows query.
- The for_start_end query extracts data from the ewma_10_30_50_200 table. This table was initially created and populated with a script from a prior tip covering exponential moving averages.
- The table contains ten, thirty, fifty, and two-hundred period exponential moving averages for the historical close prices of stocks listed on the NASDAQ exchange for trading days starting with the first date in 2014 through as late as November 8, 2017.
- The query extracts symbol, date, close price ([close]) and the four exponential moving averages from the ewma_10_30_50_200 table.
- Additionally, the query computes three fields named trend_10_200_up, trend_10_200_up_lag1, and trend_10_200_up_lead1.
- The trend_10_200_up computed field uses the built-in sign function to calculate a value which indicates if the moving averages for the current period meet the criterion for a trend up.
- The trend_10_200_up_lag1 computed field performs the same function for the period before the current period.
- The trend_10_200_up_lead1 computed field performs the same function for the period after the current period.
- The T-SQL built-in sign function returns a value of one in the expressions for the three computed fields when the difference specified as its argument is greater than zero.
- A where clause restricts the output to just those symbols in the ##symbol table.
- In order to assign the computed fields based on rows from the ewma_10_30_50_200 table, a group by clause groups rows by symbol, date, [close], ewma_10, ewma_30, ewma_50, ewma_200.
- The next query out has the name for_excluding_rows.
- The for_excluding_rows query operates on the concatenated set of start and end rows passed to it by the for_start_end query.
- The start date rows
- have a row_type field value of “start”
- have where clause criteria settings as follows
- trend_10_200_up equal to 3
- trend_10_200_up_lag1 not equal to 3
- trend_10_200_up_lead1 equal to 3
- The end date rows
- have a row_type field value of “end”
- have where clause criteria settings as follows
- trend_10_200_up equal to 3
- trend_10_200_up_lag1 equal to 3
- trend_10_200_up_lead1 not equal to 3
- The select statement for the for_excluding_rows query adds a computed field named marked_row_to_delete to the rows inherited from the for_start_end query.
- The field is assigned a value of “delete” when row_type equal “start” and the max function of the date field equals the current date field value.
- This assignment facilitates excluding trailing start rows without a matching end row. In other words, the exclusion is for single-period cycles.
- The for_excluding_rows query’s result set is the data source for the starts_and_ends query.
- This for_excluding_rows’s select statement encapsulates the value for the marked_row_to_delete field expression.
- This encapsulated value is processed by next outer query.
- The starts_and_ends_on_single_rows query accepts the for_excluding_rows query’s result set as its source data.
- One main role of the starts_and_ends_on_single_rows query is to place start and end dates for each trend up cycle within a symbol on the same row. A lead function facilitates the achievement of this objective.
- A second role is to filter its result set via a where clause so that rows with a marked_row_to_delete field value of “deleted” are excluded.
- The outermost query named for_single_row_result_set in combination with a where clause retains just one row for each trend up cycle.
- The retained rows have field names of symbol, date_start, and date_end. An order by clause arranges the rows of the outer query by symbol and start_date value.
- An into clause pumps the query’s result set into the ##mma_trend_up_starts_and_ends table.
use AllNasdaqTickerPricesfrom2014into2017
go
-- start and end rows for trend up
-- multiple moving average cycles
begin try
drop table ##mma_trend_up_starts_and_ends
end try
begin catch
print '##mma_trend_up_starts_and_ends not available to drop'
end catch
select
symbol
,date_start
,date_end
into ##mma_trend_up_starts_and_ends
from
(
-- for final single_row result set
select
symbol
,date date_start
,lead(date,1) over (partition by symbol order by date) date_end
,trend_10_200_up
,trend_10_200_up_lag1
,trend_10_200_up_lead1
,row_type
,marked_row_to_delete
from
(
-- get start dates with row_type
-- for deleting incomplete cycles
select
symbol
,date
,trend_10_200_up
,trend_10_200_up_lag1
,trend_10_200_up_lead1
,row_type
,marked_row_to_delete
from
(
select
symbol
,date
,trend_10_200_up
,trend_10_200_up_lag1
,trend_10_200_up_lead1
,row_type
,
-- catch start row_type for one row time series
case
when max(date) over (partition by symbol order by symbol) = date
and row_type = 'start' then 'delete'
end marked_row_to_delete
from
(
-- get start dates
select
symbol
,date
,trend_10_200_up
,trend_10_200_up_lag1
,trend_10_200_up_lead1
,'start' row_type
from
(
-- get history of trend_10_200_up for stocks in ##symbol
select
symbol, date, [close], ewma_10, ewma_30, ewma_50, ewma_200
,
(SIGN(ewma_10 - ewma_30)
+
SIGN(ewma_30 - ewma_50)
+
SIGN(ewma_50 - ewma_200)
) trend_10_200_up
,
case
when symbol = lag(symbol,1) over (partition by symbol order by symbol)
then
lag
(
(SIGN(ewma_10 - ewma_30)
+
SIGN(ewma_30 - ewma_50)
+
SIGN(ewma_50 - ewma_200)
)
,1
) over (partition by symbol order by date)
end trend_10_200_up_lag1
,
case
when symbol = lead(symbol,1) over (partition by symbol order by symbol)
then
lead
(
(SIGN(ewma_10 - ewma_30)
+
SIGN(ewma_30 - ewma_50)
+
SIGN(ewma_50 - ewma_200)
)
,1
) over (partition by symbol order by date)
end trend_10_200_up_lead1
from ewma_10_30_50_200
where symbol in (select symbol from ##symbol)
group by symbol, date, [close], ewma_10, ewma_30, ewma_50, ewma_200
) for_start_end
group by symbol, date, trend_10_200_up, trend_10_200_up_lag1, trend_10_200_up_lead1
having
trend_10_200_up = 3
and
trend_10_200_up_lag1 !=3
and
trend_10_200_up_lead1 =3
union
-- get end dates
select
symbol
,date
,trend_10_200_up
,trend_10_200_up_lag1
,trend_10_200_up_lead1
,'end' row_type
from
(
-- get history of trend_10_200_up for stocks in ##symbol
select
symbol, date, [close], ewma_10, ewma_30, ewma_50, ewma_200
,
(SIGN(ewma_10 - ewma_30)
+
SIGN(ewma_30 - ewma_50)
+
SIGN(ewma_50 - ewma_200)
) trend_10_200_up
,
case
when symbol = lag(symbol,1) over (partition by symbol order by symbol)
then
lag
(
(SIGN(ewma_10 - ewma_30)
+
SIGN(ewma_30 - ewma_50)
+
SIGN(ewma_50 - ewma_200)
)
,1
) over (partition by symbol order by date)
end trend_10_200_up_lag1
,
case
when symbol = lead(symbol,1) over (partition by symbol order by symbol)
then
lead
(
(SIGN(ewma_10 - ewma_30)
+
SIGN(ewma_30 - ewma_50)
+
SIGN(ewma_50 - ewma_200)
)
,1
) over (partition by symbol order by date)
end trend_10_200_up_lead1
from ewma_10_30_50_200
where symbol in (select symbol from ##symbol)
group by symbol, date, [close], ewma_10, ewma_30, ewma_50, ewma_200
) for_start_end
group by symbol, date, trend_10_200_up, trend_10_200_up_lag1, trend_10_200_up_lead1
having
trend_10_200_up = 3
and
trend_10_200_up_lag1 =3
and
trend_10_200_up_lead1 !=3
) for_excluding_rows
) starts_and_ends
where marked_row_to_delete is null
) starts_and_ends_on_single_rows
) for_single_row_result_set
where row_type = 'start'
order by symbol, date_start
-- returns trend up cycles with date_start and date_end
-- for each cycle
-- ignore trend_10_200_up column values
-- select * from ##mma_trend_up_starts_and_ends
A second code block, which appears below, adds close change amount and close change percent values to the start and end dates for trend up cycles in the ##mma_trend_up_starts_and_ends table. The design of this code block involves retrieving close prices for start dates and end dates from the ##mma_trend_up_starts_and_ends table based on joins to the Results_with_extracted_casted_values table in the AllNasdaqTickerPricesfrom2014into2017 database. The Results_with_extracted_casted_values table contains historical price and volume data, including close prices, by date within symbol.
The code uses separate joins to retrieve close prices for the start dates and end dates in the ##mma_trend_up_starts_and_ends table and the values in the close column from the Results_with_extracted_casted_values table. The data sources are matched by symbol and date for each join. Then, the retrieved joined close prices for start and end dates are joined to one another. Next, this joined result set of start and end dates with matching close prices are used as the data source for an outer query that computes close_change_amount and close_change_prcnt field values for each trend up close cycle. The final results are saved in the ##mma_trend_up_with_close_vals table.
begin try
drop table ##mma_trend_up_with_close_vals
end try
begin catch
print '##mma_trend_up_with_close_vals not available to drop'
end catch
go
-- close_change_amt and close_change_prcnt
-- for trend up trades at the trade level
-- saved as
select
 trend_up_start_closes.symbol_history symbol
,trend_up_start_closes.date_history date_start
,trend_up_end_closes.date_history date_end
,close_start_date
,close_end_date
,(close_end_date - close_start_date) close_change_amt
,(close_end_date - close_start_date)/close_start_date * 100 close_change_prcnt
into ##mma_trend_up_with_close_vals
from
(
-- get close_trend_up_start
select
--*
 symbol_history
,date_start
,date_end
,date_history
,close_start_date
from
(
-- returns trend up cycles for symbols
select
--*
 symbol symbol
,date_start date_start
,date_end date_end
from ##mma_trend_up_starts_and_ends
) trend_up_starts_and_ends
inner join
(
SELECT
   [date] date_history
      ,[symbol] symbol_history
      ,[close] close_start_date
FROM [AllNasdaqTickerPricesfrom2014into2017].[dbo].[Results_with_extracted_casted_values]
where symbol in (select symbol from ##symbol)
) price_history_for_symbols
on
(
trend_up_starts_and_ends.symbol = price_history_for_symbols.symbol_history
and trend_up_starts_and_ends.date_start = price_history_for_symbols.date_history
)
) trend_up_start_closes
inner join
(
-- get close_trend_up_end
select
 symbol
,date_start
,date_end
,symbol_history
,date_history
,close_end_date
from
(
-- returns trend up cycles for symbols
select
 symbol symbol
,date_start date_start
,date_end date_end
from ##mma_trend_up_starts_and_ends
) trend_up_starts_and_ends
inner join
(
SELECT
   [date] date_history
      ,[symbol] symbol_history
      ,[close] close_end_date
FROM [AllNasdaqTickerPricesfrom2014into2017].[dbo].[Results_with_extracted_casted_values]
where symbol in (select symbol from ##symbol)
) price_history_for_symbols
on
(
trend_up_starts_and_ends.symbol = price_history_for_symbols.symbol_history
and trend_up_starts_and_ends.date_end = price_history_for_symbols.date_history
)
) trend_up_end_closes
on trend_up_start_closes.symbol_history = trend_up_end_closes.symbol_history
and trend_up_start_closes.date_start = trend_up_end_closes.date_start
order by trend_up_start_closes.symbol_history, trend_up_start_closes.date_start
After compiling the ##mma_trend_up_with_close_vals table, it is possible to generate summary statistics that permit the comparison at a top line level of the trend up cycles with the MACD and RSI cycles. Before presenting the code, it is worth noting that the summary code for the trend up cycles is simpler because there is only one type of trend up cycle. Both the MACD and RSI cycles had two variations each, and code created top line comparison results for each variation.
The following script shows the code for generating top line summary results for trend up cycles. It calculates the same kind of summary results shown for the other cycles.
- The first select statement displays a summary for each trend up cycle showing close change amount and close change percent values ordered by symbol and start date.
- The next two select statements segment the cycles into those with a close change percent value of greater than forty percent versus those with a close change percent value of less than or equal to forty percent. Within each of the two select statements, rows are ordered by close change percent value.
- The fourth select statement presents close price percent values aggregated by symbol.
- The final output from the following script is a median close price percent value based on the aggregated results by symbol. This output is from a stored procedure that has its output saved in the @tmpTable table variable.
-- overview of trend up trades ordered by symbol
select
*
from ##mma_trend_up_with_close_vals
order by symbol, date_start

-- trend up can identify big winners (40%)
-- but it also identifies many non-big winners
select
*
from ##mma_trend_up_with_close_vals
where close_change_prcnt > 40
order by close_change_prcnt desc
select
*
from ##mma_trend_up_with_close_vals
where close_change_prcnt <= 40
order by close_change_prcnt desc

-- trend up close_change_prcnt by symbol
select
 symbol
,sum(close_start_date) close_start_date
,sum(close_change_amt) close_change_amt
,sum(close_change_amt)/sum(close_start_date)*100 close_change_prcnt
from ##mma_trend_up_with_close_vals
group by symbol

-- populate ##table_for_overall_median
-- from source_for_median query
-- assign name column_for_median to column
-- with values over which to compute median
begin try
drop table ##table_for_overall_median
end try
begin catch
print '##table_for_overall_median not available to drop'
end catch
select
close_change_prcnt column_for_median
into ##table_for_overall_median
from
(
-- trend up close_change_prcnt by symbol
select
 symbol
,sum(close_start_date) close_start_date
,sum(close_change_amt) close_change_amt
,sum(close_change_amt)/sum(close_start_date)*100 close_change_prcnt
from ##mma_trend_up_with_close_vals
group by symbol
) source_for_median
go

-- invoke compute_overall_median stored procedure
-- display median as median_value from @tmpTable
declare @tmpTable TABLE (median_value real)
insert into @tmpTable
exec dbo.compute_overall_median
select * from @tmpTable
The final screen shot for this tip appears below. It shows excerpted and full result sets from the preceding script.
- The first pane shows the first twelve rows from the first select statement. This pane shows results for all eleven trend up cycles for the ALGN symbol and the first trend up cycle for the AMZN symbol. There is a total of 107 trend up cycles across all symbols.
- The second pane shows the four trend up cycles with gains of more than forty percent. Each of these cycles is for a distinct symbol. Furthermore, each of these symbols appeared in at least one other list of trades having gains of more than forty percent from other two types of cycles. It is especially noteworthy that the trend up model discovered start and end dates for the ICPT symbol with a close change percent value of over 352 percentage points.
- The third pane shows an excerpt of all trades for trend up cycles with close change percent values of forty percent or less. The excerpt is for the top seven rows from the result set.
- The fourth pane shows the aggregated close change percent value by symbol. The AMZN symbol has the highest overall close percent change value and the WYNN symbol has the lowest overall close percent change value.
- The median close percent change value of 3.77 in the fifth pane indicates the trend up cycles generate slightly more favorable outcomes than the MACD cycles but substantially less favorable outcomes than the RSI cycles.

Next Steps
There are four steps necessary for trying out the scripts from this tip.
- First, you need to download the backup file for the AllNasdaqTickerPricesfrom2014into2017 database from this tip. The backup file from the tip includes NASDAQ historical price and volume data in its Results_with_extracted_casted_values table.
- Second, you need to download script files that can create the macd_indicators table, the rsi table , and the ewma_10_30_50_200 table in the AllNasdaqTickerPricesfrom2014into2017 database. Each of the script files processes the close prices from the Results_with_extracted_casted_values table to calculate a base table for the three technical indicators examined in this tip.
- Third, you need to download the script file from this tip on a T-SQL starter statistics package. The starter package includes code to create the compute_overall_median stored procedure in a database, such as the AllNasdaqTickerPricesfrom2014into2017 database.
- The fourth step is to download the files for this tip. Be sure to open and run the create_sample_for_three_technique_comparison.sql file before invoking any of the other scripts for this tip.
After you perform the preceding steps, you will have a database environment that enables you to duplicate all the metrics and statistics described in this tip. Additionally, you will be able to apply the models to other sets of data in the AllNasdaqTickerPricesfrom2014into2017 database.
Finally, I close by indicating that this tip is not recommending any particular stocks, including those for which results are reported in this tip nor is it recommending any specific trading rules. The stocks reported on in this tip were selected based on multiple objective business rules. At the time that I submitted this tip to MSSQLTips.com, I and my family members held positions in a subset of these stocks. I do occasionally use selected technical indicators, including the MACD, RSI, and multiple moving average indicators, in making decisions about which stocks to buy and when to sell stocks, but I do not routinely use the precise trading rules covered in this tip.

Rick Dobson is a SQL Server professional with decades of T-SQL experience that includes authoring books, running a national seminar practice, working for businesses on finance and healthcare development projects, and serving as a regular contributor to MSSQLTips.com. He has been a practicing Python developer for more than the past half decade – with a special emphasis for data visualization and ETL tasks with JSON and CSV files. His most recent professional passions include financial time series data and analyses, AI models, and statistics. If you are interested in growing your skills in any of these areas especially as they relate to financial securities, consider visiting his blog at https://securitytradinganalytics.blogspot.com/2023/12/.
- MSSQLTips Awards: Leadership (200+ tips) – 2025 | Author of the Year Contender – 2017-2024


