Problem
Please demonstrate how to estimate with T-SQL buy and sell date recommendations for stocks based on the RSI indicator. Also, generate MACD-based sell date recommendations for the RSI-based buy dates. Finally, implement a model for assessing on a statistically significant basis if percent change is more positive for sell recommendations based on MACD versus RSI technical indicators.
Solution
RSI and MACD are two complementary technical indicators that can be used to generate buy and sell recommendations for stocks and other kinds of securities. You can think of the programmatic generation of buy and sell date recommendations as an example of artificial intelligence. This tip additionally demonstrates how to statistically compare two different sets of measurements for the same set of entities. In this tip, the entities are RSI cycles designated by an RSI-based buy date recommendation followed by either an RSI-based or a MACD-based sell date recommendation. Because this tip illustrates how to implement artificial intelligence and statistical significance tests with T-SQL, this tip delivers value to those wanting to know how to do data science with T-SQL.
Some criticize technical analysis for not being objective. For example, a common complaint is that successful technical analysis demonstrations rely on hand-picked examples that cannot be replicated in a reliable manner to other sets of stocks. Also, there are three distinct MACD indicators, but many demonstrations treat just one or two of the three indicators.
Prior MSSQLTips.com tips demonstrated how to compute with T-SQL RSI and MACD technical indicators as well as examples of how to estimate buy and sell recommendations. This tip goes beyond the prior tips in three ways.
- First, you’ll learn how to generate exclusively with T-SQL buy and sell date recommendations based on RSI technical indicators. The prior MSSQLTips.com tips about RSI showed how to compute RSI indicator values with T-SQL, but both prior tips used an Excel workbook for deriving buy and sell recommendations.
- Second, you’ll see a demonstration with T-SQL of how to estimate sell dates based on MACD indicator values following buy dates based on RSI indicator values.
- Third, this tip shows how to use a stored procedure that computes a t statistic to assess if the close price change percent is more positive for MACD-based sell dates versus RSI-based sell dates. The assessment is implemented for two different samples of stock symbols to confirm the reliability of the finding. This assessment in two different samples is a simple example of cross validation.
To help you get the most out of this tip on a stand-alone basis, this tip starts with brief reviews of the RSI and MACD technical indicators as well as a T-SQL starter statistics package that includes a stored procedure for assessing if repeated measures for the same set of entities are different from a statistically significant perspective.
This tip uses a database of NASDAQ historical price and volume data. To use the database with the scripts from this tip, you need to supplement the historical price and volume database with tables from two other tips. The Next Steps section provides links and instructions on how to download and recreate the data sources to run the code described in this tip.
A brief review of the RSI indicator
The goal of the Relative Strength Indicator (RSI) is to pinpoint stock price reversals. A stock price reversal is when a stock price changes direction from going down to going up or vice versa. As widely used in stock price analysis with end-of-day data, the RSI aims to pinpoint trade dates when stock price is about to start rising after a fall or when stock price is about to start falling after a rise. The computational logic and detailed T-SQL for computing RSI values are available in this link.
The RSI is based on a transformation of the relative strength of prices over a specified window of trading dates. The window length is typically the preceding fourteen trading dates when using end-of-day data. The computational logic does not define an RSI value until enough successive trading days have transpired to fill the first window.
- The initial relative strength value is simply the average of the price gains divided by the average of the price drops.
- From the first period after the one filling a window, relative strength value is computed as a weighted average of the prior period’s relative strength and the current periods relative strength. The weights are based on the window length value.
- The transformation of relative strength to RSI results in values that range between zero and one hundred with a centerline value of fifty.
- Values of thirty and below are usually referred to as oversold values.
- Values of seventy and above are usually referred to as overbought values.
- Sequential RSI values for stock prices can swing from exiting oversold through to exiting overbought ranges of values.
- A buy date is often designated as an initial day that RSI rises from below thirty to above thirty. This is a day that the RSI transitions from an oversold value to one that is not oversold.
- The corresponding sell date is often designated as the first trading date after the buy date in which RSI falls below seventy from above seventy. This is a day that the RSI migrates from an overbought value to one that is not overbought.
- Unfortunately, the path of RSI values over successive trading days does not move directly from oversold to overbought and back to oversold in a consistent way. Two common deviations are as follows.
- After an initial drop from above seventy to below seventy, the RSI can move back and forth numerous times across the overbought boundary value. During these successive moves across the overbought RSI boundary value, a stock’s closing price often increases. Therefore, selling at the first drop below the overbought boundary can cause a recommended sell date to miss subsequent substantial price gains.
- RSI values can similarly move back and forth across the oversold boundary value of thirty after initially crossing from below to above the boundary. When this happens, stock prices typically decline, sometimes strongly, relative to the stock price at the initial move out of the oversold RSI region.
- This tip examines a remedy for the first kind of issue that bases sell dates on MACD indicators instead of the first RSI value crossing from the overbought region.
A brief review of the MACD indicators
The MACD indicators can be used for tracking trend and momentum for stock prices, such as end-of-day close price time series. You can find an introduction to the indicators along with instructions on how to compute MACD indicator values in this link.
An in-depth examination of the correspondence of MACD indicators and stock prices appears in this other tip. The in-depth examination highlights the MACD line indicator and the signal line indicator.
- You may know from the prior two tip references or other sources, the MACD line indicator reflects a short-term moving average of close prices relative to a long-term moving average. When using end-of-day stock price and volume data, the short-term moving average is usually a twelve-day exponential moving average of close prices and the long-term moving average is often a twenty-six-day exponential moving average of close prices. The centerline MACD line value is zero.
- The signal line indicator is a usually a nine-period moving average of the MACD line indicator. Because the signal line is an exponential moving average of the MACD line indicator, changes in the signal line trail changes in the MACD line indicator.
- A third indicator called the MACD histogram, is computed as the MACD line value less the signal line value. This indicator is called a MACD histogram because its values are typically plotted as histogram bars around the MACD line centerline value.
The relationship between the MACD line values and signal values are significantly correlated with changes in stock prices.
- When the MACD line value is below zero, this indicates declining stock price trend. This is because the short-term moving average of close prices is less than the long-term moving average of close prices. This tip designates the relationship of the MACD line relative to its centerline value as macd_gt_0.
- When the MACD line value is greater than zero, then the macd_gt_0 field is assigned a value of one.
- When the MACD line value is not greater than zero, the macd_gt_0 field is assigned a value of zero.
- As the MACD line value falls from above to below its signal line, upward stock price momentum declines. This is because the MACD line, which moves more quickly than the signal line, is declining in value relative to its signal line, which trails the MACD line. This tip designates the relationship of the MACD line relative to its signal line as macd_gt_signal.
- When the MACD line value is greater than the signal line value, then the macd_gt_signal field is assigned a value of one.
- When the MACD line value is not greater than its signal line, then the macd_gt_signal field is assigned a value of zero.
The macd_gt_0 and macd_gt_signal fields can be used to denote categories for when stocks should be owned, not owned, or something in between, such as consider owning or consider not owning.
- When macd_gt_0 equals zero and macd_gt_signal equals zero, then a stock should not be owned because the price is not trending up and there is no upward momentum for prices.
- When macd_gt_0 equals zero but macd_gt_signal equals one, then it may be time to consider owning a stock with the hope that the MACD line value will eventually rise above zero so the stock’s price is trending up with positive momentum.
- When macd_gt_0 equals one and macd_gt_signal equals one, then a stock should be owned because its price is trending up, and there is upward price momentum.
- When macd_gt_0 equals one and macd_gt_signal equals zero, then it may be time to consider selling the stock in order to preserve gains because its price is trending up but there is no longer upward price momentum (and this can be a precursor of declining prices).
Of the preceding four categories, the option with macd_gt_0 equals zero and macd_gt_signal equals zero is the least favorable to owning a stock.
- After visually inspecting the time series in the source database for this tip, it was decided to use the second of two successive trading day periods with macd_gt_0 and macd_gt_signal both equal to zero as a signal to sell a stock.
- This selection offers a MACD-based sell signal to contrast with the RSI-based sell signal issued when the RSI value falls from above to below seventy.
How to assess RSI-based versus MACD-based sell signals
A major objective of this tip is to verify if the MACD-based sell signal retains more profit on average than the RSI-based sell signal. The measure of profit (or loss) is the difference in close price from the RSI-based buy signal date through to the close price for the following sell signal. Each symbol can have zero or more RSI-based buy/sell cycles. The difference in close price from the start of the RSI cycle through to its end denotes the close price change, and the close price change divided by the close price at the start of the RSI cycle calculates the close price change percent. This tip contrasts the close price change percent associated with each RSI-based sell signal versus a corresponding MACD-based sell signal.
A paired comparison t test is the appropriate statistical test for determining the statistical level of significance of the difference between sets of close price change percent values based on RSI sell recommendations versus MACD sell recommendations. For example, by using a five percent probability with a one-tailed test, we can use the t statistic to assess if there is less than a five percent chance that the differences between the two types of sell recommendations occurred by chance. A prior MSSQLTips.com tip provides a stored procedure for implementing this kind of statistical test, and the stored procedure is re-used in this tip.
This tip computes the paired comparison t test for two different sets of symbols. One set of symbols includes six stock symbols used for initially introducing the RSI in MSSQLTips.com. A second set of 242 symbols are also used for verifying the reliability of the statistically significant result reported for the sample of six stock symbols.
Specifying the sample of six stock symbols for the first demonstration
The initial MSSQLTips.com article on RSI examined just six symbols. These symbols were selected based on my due diligence to identify stocks with good price performance. To compare results to the initial RSI tip, this tip starts by using the same six stock symbols. The following script shows the code used to populate the ##symbol global temporary table with the six symbols for the initial comparison of RSI sell recommendations to MACD sell recommendations. It is trivial to adapt this code for any other short set of symbols. Later in this tip, you see an adaptation that inserts a fresh copy of 242 stock symbols into ##symbol.
-- create ##symbol table with 6 symbols
-- MSFT, NVDA, SIVB, BZUN, MMSI, MU
begin try
drop table ##symbol
end try
begin catch
print '##symbol not available to drop'
end catch
select
*
into ##symbol
FROM
(
select 1 symbol_id, 'MSFT' symbol
UNION
select 2 symbol_id, 'NVDA' symbol
UNION
select 3 symbol_id, 'SIVB' symbol
UNION
select 4 symbol_id, 'BZUN' symbol
UNION
select 5 symbol_id, 'MMSI' symbol
UNION
select 6 symbol_id, 'MU' symbol
) for_##symbol
T-SQL code for finding RSI-based buy and sell recommendations
There are two primary resources for generating buy and sell date recommendations based on RSI oversold and overbought conditions from the AllNasdaqTickerPricesfrom2014into2017 database. These resources are the rsi and macd_indicators tables. The following screen shot shows Object Explorer views of these two tables from within the database. There are red borders around each of the two tables and their columns.
The rows of each table are unique by symbol and date column values. The macd_indicators table has the three core MACD indicators in the macd, signal, and macd_histogram columns. The rsi table has the two relative strength and rsi columns for the RSI indicator. Both tables have close columns which contain the close price for a symbol on a date.

There are four steps to creating a table with one row for the start and end of each RSI cycle. The start row is for the buy recommendation, and the end row is for the sell recommendation. There is a separate script segment for each step.
The first step initially creates and populates the ##for_los_lob_1st global temporary table, which is refined further in subsequent steps. This step’s script nests three queries within each other.
- The name of the inner-most subquery is for_rsi_state_change.
- This subquery specifies a data source based on a left join of the rsi table to the macd_indicators table with matching on symbol and date column values. The left join does not add rsi table values to values from the macd_indicators table unless the macd_indicators table row has symbol and date column values that match a rsi table row. A where clause restricts its result set to just those symbols in ##symbol.
- The subquery pulls selected columns from both key source tables and it uses a case statement to populate a column named rsi_state.
- The most vital role for this table is the designation of rsi_state column values of oversold and overbought based on rsi column values.
- Additionally, two other rsi_state names (lt_centerline and gt_centerline) are defined. These two additional rsi_state names are not used in this tip, but I am providing the code for them in case you care to do some data mining beyond what is reported in this tip.
- The middle level subquery named rsi_state_change inherits fields from the for_rsi_state_change subquery and defines several additional fields based on the inherited fields.
- The macd_gt_0 and macd_gt_signal fields are defined with case statements. These fields are not used in this section of the tip, but they will be used in a subsequent section on creating MACD-based sell dates. The macd_gt_0 and macd_gt_signal fields are defined here to facilitate coordinating RSI-based sell dates with MACD-based sell dates.
- A lag function pulls rsi_state values for the preceding trading day for a stock symbol.
- The value of 1 in the lag clause specifies a lag to get the preceding trading date.
- The partition by argument of symbol in the over clause restricts the operation of the lag function so that lagged values must match the symbol value of the current row. If the preceding row contains a rsi_state value for another symbol than the one for the current row, then lag function returns a null value.
- The order by argument of date indicates the lag is based on trading date.
- The outer-most subquery adds the los_lob_1st field to those inherited through either of the two nested subqueries. The newly added field can have one of three values.
- One of the possible field values has the string value of “los1st”. This assignment is for the start of an RSI cycle.
- Another possible field value has the string value of “lob1st”. This assignment is for the end of an RSI cycle.
- When the current row is neither the start nor end of an RSI cycle, then a null value is implicitly assigned to the los_lob_1st field. Null values denote intermediate rows between start and end rows for RSI cycles.
use AllNasdaqTickerPricesfrom2014into2017
go

-- ##for_los_lob_1st holds first leave oversold/overbought pairs for all symbols
-- need to filter to exclude null los_lob_1st values and
-- clean for starts with leaves overbought and ends with leaves oversold
begin try
drop table ##for_los_lob_1st
end try
begin catch
print '##for_los_lob_1st not available to drop'
end catch
select
 *
,
case
when rsi_state_change = 'leaves oversold'
    and lag(rsi_state_change,1)
over (partition by symbol order by date) is null
then 'los1st'
when rsi_state_change = 'leaves oversold'
and lag(rsi_state_change,1)
over (partition by symbol order by date) != 'leaves oversold'
then 'los1st'
when rsi_state_change = 'leaves overbought'
and lag(rsi_state_change,1)
over (partition by symbol order by date) is null
then 'lob1st'
when rsi_state_change = 'leaves overbought'
and lag(rsi_state_change,1)
over (partition by symbol order by date) != 'leaves overbought'
then 'lob1st'
end los_lob_1st
into ##for_los_lob_1st
from
(
-- symbol close prices with macd and rsi indicator values and descriptors
select
 symbol
,date
,[close]
,macd
,signal
,
case
when macd > 0 then 1
else 0
end macd_gt_0
,
case
when macd > signal then 1
else 0
end macd_gt_signal
,rsi
,rsi_state
,lag(rsi_state,1) over (partition by symbol order by date) rsi_state_lag1
,
case
when lag(rsi_state,1) over (partition by symbol order by date) = 'oversold'
and rsi_state != 'oversold'
then 'leaves oversold'
when lag(rsi_state,1) over (partition by symbol order by date) = 'overbought'
and rsi_state != 'overbought'
then 'leaves overbought'
end rsi_state_change
from
(
-- join of macd_indicators and rsi with rsi states
-- define rsi_state column
select
 macd_indicators.[symbol] symbol
,macd_indicators.[date] date
,macd_indicators.[close] [close]
,macd
,[signal]
,rsi
,
case
when rsi <= 30 then 'oversold'
when rsi < 50 then 'lt_centerline'
when rsi < 70 then 'gt_centerline'
when rsi >= 70 then 'overbought'
end rsi_state
FROM [AllNasdaqTickerPricesfrom2014into2017].[dbo].[macd_indicators]
left JOIN dbo.rsi
on rsi.symbol = macd_indicators.symbol
and rsi.date = macd_indicators.date
where macd_indicators.symbol in (select symbol from ##symbol)
) for_rsi_state_change
) rsi_state_change
where
rsi_state_change
in ('leaves oversold', 'leaves overbought')
order by symbol, date
 -- exclude ##for_los_lob_1st rows where los_lob_1st is null value -- store in
#temp begin try drop table #temp end try begin catch print '#temp not available
to drop' end catch select * into #temp from ##for_los_lob_1st where los_lob_1st
is not null order by symbol, date -- select * from #temp -- do cleaning for
symbol rows that start with leaves overbought -- or end with leaves oversold
begin try drop table ##los_lob_1st end try begin catch print '##los_lob_1st
not available to drop' end catch select * into ##los_lob_1st from #temp except
( --select * from #temp -- identify rows with symbol that start with leaves
overbought for exclusion select symbol ,date ,[close] ,macd ,signal ,macd_gt_0
,macd_gt_signal ,rsi ,rsi_state ,rsi_state_lag1 ,rsi_state_change ,los_lob_1st
from ( select row_number() over (partition by symbol order by date) rn_in_symbol
,* from #temp ) for_rn_in_symbol where rn_in_symbol = 1 and rsi_state_change
= 'leaves overbought' union -- identify rows with symbol that end with leaves
oversold for exclusion select symbol ,date ,[close] ,macd ,signal ,macd_gt_0
,macd_gt_signal ,rsi ,rsi_state ,rsi_state_lag1 ,rsi_state_change ,los_lob_1st
from ( select row_number() over (partition by symbol order by date desc) rn_in_symbol
,* from #temp ) for_rn_in_symbol where rn_in_symbol = 1 and rsi_state_change
= 'leaves oversold' ) --select * from ##los_lob_1st order by symbol, date
The script for the second step merely excludes selected rows from the ##for_los_lob_1st global temporary table and copies the reduced result set to the #temp local temporary table. The selected rows that are excluded are those with a null value for the los_lob_1st field. The #temp table will eventually be copied back to a fresh copy of the ##for_los_lob_1st table after additional processing.
-- exclude ##for_los_lob_1st rows where los_lob_1st is null value
-- store in #temp
begin try
drop table #temp
end try
begin catch
print '#temp not available to drop'
end catch
select
*
into #temp
from ##for_los_lob_1st
where los_lob_1st is not null
order by symbol, date
-- select * from #temp
The third section performs a role that is often required when creating buy/sell recommendation pairs. It excludes a leading row that is for the sell member of a buy/sell pair because the preceding buy member of the pair is outside the scope of the source data. Similarly, the third step excludes a trailing row that is for the buy member of a buy/sell pair. In this case, sell member for the trailing buy member is outside the scope of the source data. The cleaned set of rows is copied back into the ##los_lob_1st global temporary table.
-- do cleaning for symbol rows that start with leaves overbought
-- or end with leaves oversold
begin try
drop table ##los_lob_1st
end try
begin catch
print '##los_lob_1st not available to drop'
end catch
select *
into ##los_lob_1st
from #temp
except
(
--select * from #temp
-- identify rows with symbol that start with leaves overbought for exclusion
select
 symbol
,date
,[close]
,macd
,signal
,macd_gt_0
,macd_gt_signal
,rsi
,rsi_state
,rsi_state_lag1
,rsi_state_change
,los_lob_1st
from
(
select
 row_number() over (partition by symbol order by date) rn_in_symbol
,* from #temp
) for_rn_in_symbol
where rn_in_symbol = 1 and rsi_state_change = 'leaves overbought'
union
-- identify rows with symbol that end with leaves oversold for exclusion
select
 symbol
,date
,[close]
,macd
,signal
,macd_gt_0
,macd_gt_signal
,rsi
,rsi_state
,rsi_state_lag1
,rsi_state_change
,los_lob_1st
from
(
select
 row_number() over (partition by symbol order by date desc) rn_in_symbol
,* from #temp
) for_rn_in_symbol
where rn_in_symbol = 1 and rsi_state_change = 'leaves oversold'
)
--select * from ##los_lob_1st order by symbol, date
The fourth and final step adds a column named rn_index to the ##for_los_lob_1st global temporary table. This column consists of a sequence of integer values starting at 1 and adding 1 for each additional row in ##for_los_lob_1st. While not strictly necessary for this step in creating RSI-based buy and sell recommendations, the rn_index column will serve a useful role when creating a set of sell recommendations based on MACD-based indicator values (namely, macd_gt_0 and macd_gt_signal field values). The code for implementing the fourth step appears below.
- Initially, the ##los_lob_1st global temporary table created in the third step is copied to a fresh copy of the #temp local temporary table.
- Then, a result set is created that contains all the columns (*) in the #temp local temporary table with one preceding column named rn_index. The new column is the output from a row_number function defined over the set of date values within symbol values from the copied values in the #temp table.
- This new result set is inserted into a fresh version of the ##for_los_lob_1st global temporary table. Rows are inserted into the table in the order specified by the order by arguments for the row_number function assigning values to the rn_index field.
- Finally, a select statement displays the contents of the fresh version of the ##for_los_lob_1st global temporary table.
-- add rn_index column to ##los_lob_1st
-- and re-save as ##for_los_lob_1st
delete from #temp
insert into #temp
select *
from ##los_lob_1st
order by symbol, date
begin try
drop table ##for_los_lob_1st
end try
begin catch
print '##for_los_lob_1st not available to drop'
end catch
go
select
row_number() over (order by symbol, date) rn_index
,
*
into ##for_los_lob_1st
from #temp
select * from ##for_los_lob_1st
Excerpt from the RSI-based buy and sell recommendations table
The rows displayed by the preceding select statement contain two rows for each buy/sell recommendation set based exclusively on RSI values. The following screen shot shows an excerpt of the first twenty rows from the result set in the last version of the ##for_los_lob_1st global temporary table created in the preceding section.
- The column value in the row with an rn_index value of 1 is for the first buy recommendation row; the date column value for the first row is July 9, 2015. This row is for the BZUN symbol, and it is for the earliest buy recommendation row for BZUN buy/sell recommendation pairs.
- The earliest sell recommendation row for the BZUN symbol has an rn_index column value of 2; its date column value is November 3, 2015. The close price drops by four cents between the first buy and sell recommendations from 8.13 through to 8.09.
- The second and third pair of buy/sell recommendations for the BZUN symbol show, respectively, close price gains of 1.41 and 2.70.
- The last buy/sell recommendation pair in the screen shot below has rn_index values of 19 and 20 with a close price gain of 5.58, which results from the subtraction of 50.61 from 56.19. This outcome is for the MSFT symbol, which represents the Microsoft Corporation.
- You can tell from the border in the following screen shot that there is a total of forty-two rows in the last version of the ##for_los_lob_1st global temporary table created within the preceding section. This total row count indicates that there are twenty-one pair of buy/sell recommendation pairs based on RSI values.

Code and result sets for finding MACD-based sell recommendations
A two-step approach is used for finding and saving MACD-based sell recommendation rows that serve as alternate rows to the RSI-based sell recommendation rows in the ##for_los_lob_1st table. Only sell dates are found based on MACD indicators. This is because each RSI-based buy date can have both a corresponding RSI-based sell date and a corresponding MACD-based sell date. Recall that one major objective of this tip is to compare the two different types of sell dates to see which type leads to the most positive average close change percent.
The first step is to find and save date ranges in which to search for MACD-based sell dates. Recall that a MACD-based sell date is the second contiguous trading date with macd_gt_0 equal to zero and macd_gt_signal equal to zero after an RSI-based sell date. Therefore, the search for a MACD-based sell recommendation date starts immediately after a corresponding RSI-based sell date. This search can extend until just before the start of the next RSI-based buy date. If there is no subsequent RSI-based buy date because the code is examining the last RSI buy/sell cycle for a symbol, then the code searches until there are no more trading dates for a symbol in the source data.
The second step is to collect the MACD-based sell dates along with appropriate metrics in a format that matches the RSI-based sell recommendation rows. This step uses a while loop based on the rows of the ##for_los_lob_1st table. The MACD-based sell dates are matched to RSI-based buy dates in each RSI buy/sell cycle.
The following code shows the code for finding and saving the search date ranges for the MACD-based sell recommendations.
- These ranges are saved in a global temp table named ##macd_search_dates that is freshly created at the top of the script.
- The body of the script contains a set of nested queries to populate ##macd_search_dates with both start and end search dates for MACD-based sell dates for each of the original RSI cycles defined by RSI-based buy and sell dates.
- The start date of a search for each MACD-based sell date is always the trading date after original RSI-based sell date for a cycle.
- The end date of a search for each MACD-based sell date is always either one of two dates.
- The trading date just before start of the next RSI-based cycle if there is one; this date value is derived from the ##for_los_lob_1st table if there is a subsequent RSI cycle for the symbol.
- The first day on which there is no more source data for a symbol. For the symbols in the AllNasdaqTickerPricesfrom2014into2017 database used for this analysis, this date is always November 9, 2017. Code after the union keyword appends this date for each symbol to the set of other end search dates.
- By using > and < comparison operators, subsequent code delimits, respectively, start and end of search ranges. After finding start search and end search dates for the MACD-based sell date of each RSI cycle, the data are re-formatted so that start and end dates appear on a single row.
- In the outer-most query, a lead function extracts the end search date so that the start and end search dates both are on the current row (those with an odd row_id value).
- The final where clause excludes all rows with an even row_id value.
-- find start and end search dates for
-- macd indicators to end rsi cycles
-- from just after one rsi cycle end date to just
-- before next rsi cycle start date
-- put start and end search dates for each pair of
-- source rows on a single row
-- rn_for_search_dates is a unique identifier for each
-- pair of start and end search dates
-- row_id is a unique identifier for each row within
-- a symbol; row_id values start at 0

begin try
drop table ##macd_search_dates
end try
begin catch
print '##macd_search_dates not available to drop'
end catch

select
 row_number () over (order by symbol,row_id) rn_for_search_dates
,row_id
,date
,search_date_start
,search_date_end
,symbol
into ##macd_search_dates
from
(
-- clean to put both start and end search dates on same row
-- and exclude rows with only end search dates
select
 row_id
,date
,search_date search_date_start
,lead(search_date,1) over (order by symbol,row_id) search_date_end
,symbol
from
(
-- by using date to specify search_date, the code denotes original
-- end and start dates for each rsi cycle with new final end date
-- for end of source data
select
 row_id
,date
,date search_date
,symbol
from
(
-- inner subquery creates a result set with 2 rows for each
-- rsi cycle in a symbol having start and end date values in
-- each pair of rows
-- start row_id has row number for each row in symbol
-- starting with 0 for the first row
-- where clause removes first row for each symbol
select
 row_id
,date
,symbol
from
(
select
 row_number() over (partition by symbol order by date) - 1 row_id
,date
,symbol
from ##los_lob_1st
) after_end_to_no_more
where  row_id   !=0
union
-- assign same end date value for last row for each symbol
-- last row's end date value is 2017-11-09, which is the
-- day after for which close prices are available
-- unions with preceding set of rows for each symbol
select
 max( row_id) + 1  row_id
,'2017-11-09' date
,symbol
from
(
select *
from
(
select
row_number() over (partition by symbol order by date)-1 row_id
,symbol, date
from ##los_lob_1st
) after_end_to_no_more
where row_id !=0
) after_end_to_no_more_get_max
group by symbol
) for_date_adj
) for_search_dates
) search_dates
where row_id % 2 = 1
order by symbol, date

--select * from ##macd_search_dates
As you can note from the preceding script, the last select statement is commented so that it does not normally operate. However, it is useful for tutorial reasons to compare selected rows from the ##macd_search_dates table to rows for corresponding RSI cycles in the ##for_los_lob_1st table. The following excerpts present this comparison across two separate Results tab panes. The top pane shows the rows for the BZUN, MMSI, MSFT symbols from the ##for_los_lob_1st table. The bottom pane shows rows with comparable information for the same three symbols from the ##macd_search_dates table.
- Please note that the border indicates 63 total rows in the combined result sets for the ##for_los_lob_1st and ##macd_search_dates tables.
- The top pane shows an excerpt from the forty-two rows in the ##for_los_lob_1st table. The preceding two sections describe the construction and content of these rows.
- The bottom pane shows an excerpt from the twenty-one rows in the ##macd_search_dates table. Each of these rows contains the boundary dates for searching for MACD-based sell dates that can replace the RSI-based sell dates in the ##for_los_lob_1st table.
- Corresponding values are boxed in the top and bottom panes for comparison purposes.
- The date column values for rows with rn_index values of 2 and 3 in the top pane matches the search_date_start and search_date_end column values in the bottom pane row with a rn_for_search_dates value of 1.
- The boxed date value in the top pane on the row with a rn_index value of 2 is the sell date based on RSI values from the first RSI cycle for the BZUN symbol. This date matches the search_start_date column value for the row with rn_for_search_dates value of 1 in the bottom pane. Searching for the MACD-based sell date for the first BZUN RSI cycle commences on the first trading date after this date value.
- The boxed date value in the top pane on the row with a rn_index value of 3 is the buy date based on RSI values from the second RSI cycle for the BZUN symbol. This date matches the search_date_end column value for the row with rn_for_search_dates value of 1 in the bottom pane. Searching for the MACD-based sell date for the first BZUN RSI cycle ceases on the trading date before this date value.
- The date column value for the row with an rn_index value of 6 matches the search_date_start column value in the bottom pane row with an rn_for_search_dates value of 3. Searching for the MACD-based sell date commences on the trading date after this date value.
- There is no matching value in the top pane for the search_date_end column value in the bottom pane row with an rn_for_search_dates value 3; the search_date_end column value on this row is highlighted in yellow for your easy reference. Searching for the MACD-based sell date for the third BZUN RSI cycle ceases on the trading date before this date value.
- The next set of boxed and highlighted cells from the top and bottom panes of the screen shot identify the same kinds of dates for the MMSI symbol as are identified for the BZUN symbol in the preceding bullets.
- Start and end search dates for the first MACD-based sell dates for the MMSI symbol’s first RSI cycle are denoted in rows with rn_index values of 8 and 9 in the top pane for search_date_start and search_date_end column values for the row with an rn_for_search_dates column value of 4 in the bottom pane.
- The start search date for the last MMSI RSI cycle appears in the row with an rn_index column value of 14 in the top pane; this date appears in the search_date_start column of the row with an rn_for_search_dates column value of 7 in the bottom pane.
- The search _date_end column value for the last MMSI RSI cycle in the bottom pane does not appear in the top pane. This is because the cycle is for the last MMSI RSI cycle for the MMSI symbol, and the search _date_end column value should match the date after the last trading date for a symbol.
- The MSFT rows in the following screen shot are meant for you to apply the rules illustrated for the BZUN and MMSI symbols to another symbol that is not explicitly discussed in the text. I hope you find these data helpful for verifying your understanding of the process for populating the bottom pane based on values in the top pane and the last date for which data is available in the source data tables.

After the preceding script runs, another script operates to use the ##macd_search_dates table rows in combination with the rsi and macd_indicators tables to create and populate a fresh version of the ##los_macd_dont_own_2X table, which holds the MACD-based sell dates. The rn_index column values in the ##los_macd_dont_own_2X table match corresponding values in the ##for_los_lob_1st table, which facilitates comparing the two sets of sell dates.
- The script below starts by creating a fresh version of the ##los_macd_dont_own_2X table.
- This table has the same column names as does the ##for_los_lob_1st table.
- When the population of the ##los_macd_dont_own_2X table completes, it will have one row for each RSI cycle.
- Next, several local variables are declared and/or populated to assist with navigating through a while loop. There is a separate pass through the loop for each MACD-based sell date row in the ##for_los_lob_1st table. The code within the loop populates the ##los_macd_dont_own_2X table with values for MACD-based sell date rows. Two key elements of the code within the while loop are
- An insert statement for pushing rows into the ##los_macd_dont_own_2X table
- A select statement for populating the columns of successive rows that are pushed into the ##los_macd_dont_own_2X table
- The select statement fulfills its role through several nested queries.
- At the inner-most level is a left join of the rsi table to the macd_indicators table. The join is implemented by matches between date and symbol column values for the two tables. Additionally, the result set is filtered for the symbols in the ##symbol table.
- An intermediate level nested query named for_macd_end_to_rsi_cycle inherits the result set from the inner-most query to derive date limits for a MACD-based sell date for a symbol on the current pass through the while loop. Within this intermediate level, the macd_dont_own_2X field is assigned a value of 1 for the second row of two contiguous rows in which macd_gt_0 equals zero and macd_gt_signal equals zero. Otherwise, the macd_dont_own_2X field is null.
- The outer-most query level, removes all rows except those assigned a value of one for the macd_dont_own_2X column value. A top operator with an argument of one refines the selection to the earliest row satisfying the criterion. This is the final processing step that finishes the identification of the MACD-based sell date row for pushing into the ##los_macd_dont_own_2X table.
-- create and populate table (##los_macd_dont_own_2X)
-- for holding end dates based on macd indicator values
-- for each rsi cycle
-- rn_index indicates row numbers in original row set
-- to replace rsi cycle end dates with macd indicator
-- end dates
begin try
drop table ##los_macd_dont_own_2X
end try
begin catch
print '##los_macd_dont_own_2X not available to drop'
end catch

create table ##los_macd_dont_own_2X
(
 rn_index int not null
,symbol varchar(5) null
,date date null
,[close] money null
,macd money null
,signal money null
,macd_gt_0 int null
,macd_gt_signal int null
,rsi real null
,rsi_state varchar(50) null
,rsi_state_lag1 varchar(50) null
,rsi_state_change varchar(50) null
,los_lob_1st varchar(50) null
)
go

-- declared variables
declare
 @max_rn int = (select max(rn_for_search_dates) from ##macd_search_dates)
,@rn_index int = 1
,@start_date varchar
,@end_date varchar

-- loop through left join of rsi table to the macd_indicator tables by date
-- based on rows in select * from ##macd_search_dates
-- to successively populate rows in ##los_macd_dont_own_2X
-- based on top row of joined result set where search is for
-- two successive rows with macd_gt_signal = 0 and macd_gt_0 = 0

while @rn_index <= @max_rn
begin
insert into ##los_macd_dont_own_2X
select top 1
 @rn_index*2 rn_index
,symbol
,date
,[close] [close]
,macd
,signal
,macd_gt_0
,macd_gt_signal
,rsi
,rsi_state
,rsi_state_lag1
,NULL rsi_state_change
,NULL los_lob_1st
from
(
select *
,
case
when
macd_gt_signal = 0
and macd_gt_0 = 0
and lag(macd_gt_signal,1) over (order by date) = 0
and lag(macd_gt_0,1) over (order by date) = 0
then 1
else null
end macd_dont_own_2X
from
(
-- symbol close prices with macd and rsi indicator values and descriptors
select
 symbol
,date
,[close]
,macd
,signal
,
case
when macd > 0 then 1
else 0
end macd_gt_0
,
case
when macd > signal then 1
else 0
end macd_gt_signal
,rsi
,rsi_state
,lag(rsi_state,1) over (partition by symbol order by date) rsi_state_lag1
,
case
when lag(rsi_state,1) over (partition by symbol order by date)
= 'oversold' and rsi_state != 'oversold'
then 'leaves oversold'
when lag(rsi_state,1) over (partition by symbol order by date)
= 'overbought' and rsi_state != 'overbought'
then 'leaves overbought'
end rsi_state_change
from
(
-- join of macd_indicators and rsi with rsi states
-- define rsi_state column
select
 macd_indicators.[symbol] symbol
,macd_indicators.[date] date
,macd_indicators.[close] [close]
,macd
,[signal]
,rsi
,
case
when rsi <= 30 then 'oversold'
when rsi < 50 then 'lt_centerline'
when rsi < 70 then 'gt_centerline'
when rsi >= 70 then 'overbought'
end rsi_state
FROM [AllNasdaqTickerPricesfrom2014into2017].[dbo].[macd_indicators]
left JOIN dbo.rsi
on rsi.symbol = macd_indicators.symbol
and rsi.date = macd_indicators.date
where macd_indicators.symbol in (select symbol from ##symbol)
) for_rsi_state_change
) for_double_macd_double_0

where
date > (select search_date_start from ##macd_search_dates where rn_for_search_dates = @rn_index)
and
date < (select search_date_end from ##macd_search_dates where rn_for_search_dates = @rn_index)
and
symbol = (select symbol from ##macd_search_dates where rn_for_search_dates = @rn_index)
) for_macd_end_to_rsi_cycle
where macd_dont_own_2X is not null

set @rn_index = @rn_index + 1
end

select * from ##los_macd_dont_own_2X
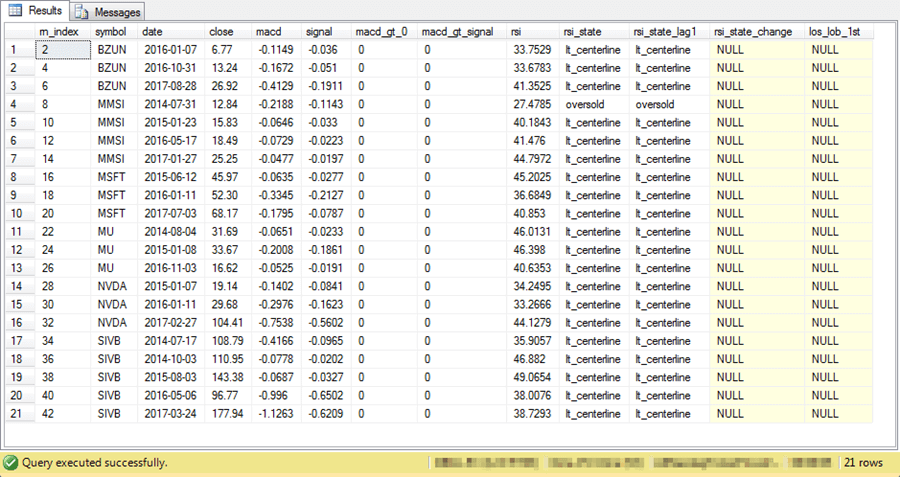
The next screen shot lists the MACD-based sell date rows inserted into the ##los_macd_dont_own_2X table. This screen shot is from the final select statement in the preceding script. Notice that there are twenty-one rows in the result set.
- The first ten rows in the following screen shot have rn_index values which match corresponding rows in the screen showing in the “Excerpt from the RSI-based buy and sell recommendations table” section. The remaining rows in the following screen shot are unmatched because the “Excerpt from the RSI-based buy and sell recommendations table” section shows results for only the first ten RSI cycles.
- The rows in the result set below are for sell dates just like those rows with an even number for their rn_index values showing in the “Excerpt from the RSI-based buy and sell recommendations table” section. The difference is that the rows below are for MACD-based sell dates, but the sell dates from the screen shot in the “Excerpt from the RSI-based buy and sell recommendations table” section are for RSI-based sell dates.
- Notice that all rows in the screen shot below have zero values in both their macd_gt_0 and macd_gt_signal columns. This is a requirement for a MACD-based sell date because the MACD-based sell rows must be the second of two contiguous rows with macd_gt_0 and macd_gt_signal column values equal to zero.
Which generates more positive percent change: RSI-based or MACD-based sell dates?
We now have the two sets of sell dates. One set based on RSI-based indicators and another set based on MACD-based indicators. To assess which set of sell dates is better, you need to decide on a metric for comparing the two sets of sell dates. Then, you can compare them via casual inspection or via a statistical test. This section demonstrates how to perform the comparison both ways.
The following script generates a result set with close change amount and close change percent between buy and sell dates for the RSI indicators. In this script, both the buy and sell dates are based on RSI indicators.
- The source data are from the ##for_los_lob_1st table. Recall that the layout of this table has two rows for each RSI cycle. Additionally, an rn_index value assigns a unique identifier to each row starting with a value of one for the first row.
- Buy date rows have an odd rn_index value.
- Sell date rows have an even rn_index value.
- The inner query named close_change_for_rsi_indicator_ends performs several critical functions.
- It pulls the close price from the sell date rows with the lead function into the rows with an odd rn_index number.
- Also, the original close price for odd rows is re-named close_start, and pulled closed price is assigned an alias of close_end.
- Additionally, the code computes the close change value and the close change percent between the buy and sell prices.
- The outer-most query retains the columns from the inner query, but it retains only rows from the inner query with an odd row number.
-- close change values and close change percent values
-- for rsi indicator ends
select *
from
(
select
 rn_index
,symbol
,date date_start
,lead(date,1) over (order by rn_index) date_end
,[close] close_start
,lead([close],1) over (order by rn_index) close_end
,
lead([close],1) over (order by rn_index)
-
[close] close_change
,
-- expression value has four places after decimal
-- for ratio of close change to close start
-- multiplying by 100 returns percentage value
-- with two places after the decimal
((
lead([close],1) over (order by rn_index)
-
[close]
)
/
[close])*100 close_change_percent
from ##for_los_lob_1st
) close_change_for_rsi_indicator_ends
where rn_index % 2 = 1
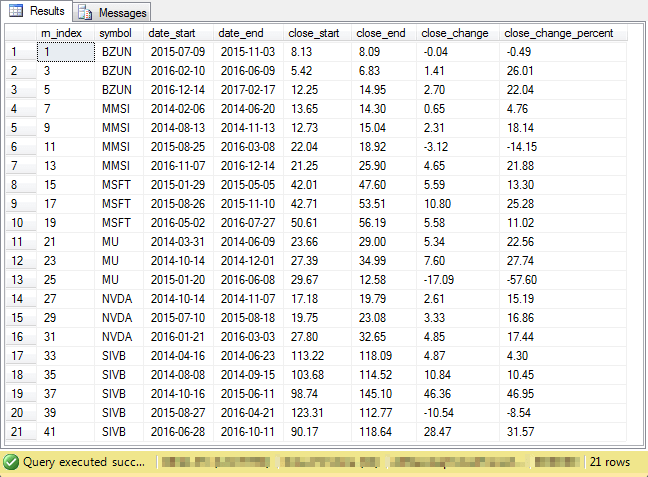
The following screen shot shows the result set from the preceding query. Notice that there are twenty-one rows in the result set. This is one row for each RSI cycled for the set of six symbols. Each row contains both the starting and ending close price for an RSI cycle. This result set contains close change percent for RSI cycles based on an RSI-based sell date.
The next script presents the same type of data, but this time the results are for MACD-based sell dates. The code is a bit more complicated, but it generates the same kind of output with one critical difference: that this output is for MACD-based sell dates as opposed to RSI-based sell dates. The reason the code is a bit more complicated is that the RSI cycle buy date rows are from one table (##for_los_lob_1st), but the sell date rows for this result set are from a different table (##los_macd_dont_own_2X).
-- close change values and close change percent values
-- for macd_indicator ends
select *
from
(
select
 rn_index
,symbol
,date date_start
,lead(date,1) over (order by rn_index) date_end
,[close] close_start
,lead([close],1) over (order by rn_index) close_end
,
lead([close],1) over (order by rn_index)
-
[close] close_change
,
-- expression value has four places after decimal
-- for ratio of close change to close start
-- multiplying by 100 returns percentage value
-- with two places after the decimal
((
lead([close],1) over (order by rn_index)
-
[close]
)
/
[close])*100 close_change_percent
from
(
select *
from
(
-- remove first leaves overbought from ##for_los_lob_1st
select
*
from ##for_los_lob_1st
where rn_index % 2 = 1
union
-- end dates from rsi cycles based on macd indicators
select * from ##los_macd_dont_own_2X
) unioned_rsi_starts_and_macd_ends
) for_close_change_for_macd_indicator_ends
) close_change_for_macd_indicator_ends
where rn_index % 2 = 1
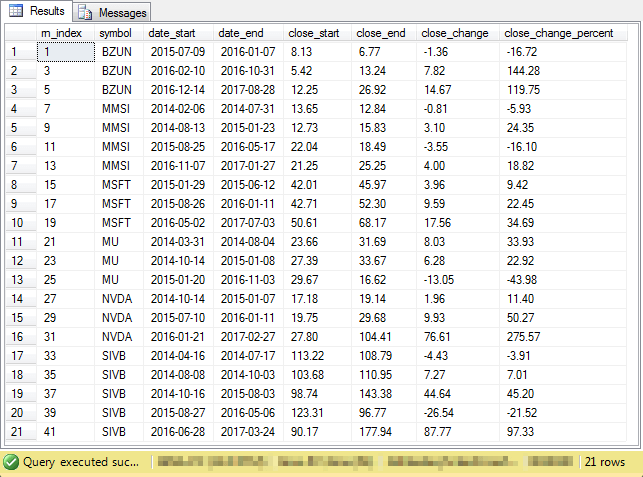
Here’s the screen shot showing close change and close change percent for RSI cycles ending based on MACD indicators. Notice that there are again twenty-one rows in the result set with the same column names as the preceding screen shot. If you manually compared the values in the close_change_percent columns from each screen shot, you would discover that the MACD-based sell dates result in more positive percent change values for 12 out of 21 cycles. However, it is reasonable to ask: are the results different at a statistically significant level?
A paired comparison t test can answer the question of whether a set of entities, such as RSI cycles, has a greater close _change_percent set of values when the close_change_percent values are computed with RSI-based sell dates versus MACD-based sell dates. The t test computes a t statistic value that can be compared to a critical t value in a published table of critical t values at several different probability levels for different degrees of freedom. More details on the test as well as a stored procedure for computing the t statistic is available in a prior tip offering a T-SQL starter statistics package. You will also find additional references in the prior tip if you care to learn more about t tests.
The stored procedure accepts its input from a global temporary table named ##temp_subject_id_results. The table has three columns:
- a subject_id column with a varchar(10) data type
- a column of float values with the first set of measurements
- another column of float values with the second set of measurements
The data for populating the ##temp_subject_id_results table for this tip comes from the results displayed in the preceding two screen shots.
- The subject_id values correspond to the rn_index values. These values are the same in both screen shots. The rn_index integer values are implicitly converted to string values when inserted into the ##temp_subject_id_results table.
- The first set of measurements are the close_change_percent column values computed for the RSI-based sell dates.
- The second set of measurements are the close_change_percent column values computed for the MACD-based sell dates.
The code for assigning of values to the ##temp_subject_id_results table is merely an adaptation of the prior two scripts to compute the close_change_percent for each RSI cycle based on either RSI-based sell dates or MACD-based sell dates. The T-SQL code for assigning the values is in the listings that you can download with the script files for this tip. Here’s a screen shot with the values in the ##temp_subject_id_results global temporary table. You can compare this screen shot to the prior two screen shots to confirm the operation of the code for populating the ##temp_subject_id_results.

After creating and populating the ##temp_subject_id_results table, you can invoke the stored procedure to compute the paired comparison t test value with the following script.
exec compute_paired_sample_t
The output below is from the compute_paired_sample_t stored procedure for the ##temp_subject_id_results table contents. Notice the computed t value is about -1.883. Because the absolute value of the computed t is greater than the critical value of the t statistic with twenty degrees of freedom at the five percent probability level (1.725), there are less than five chances in one hundred that the absolute value of the mean difference (about 26.4057) could occur by chance. The critical t value was derived from the NIST/SEMATECH published table of statistically significant t values, which includes instructions on how to use the table.

Specifying a sample of 242 stock symbols for the second demonstration
All the preceding code samples and their result sets are for a sample of six stock symbols used in an initial tip on how to compute and use the RSI technical indicator. One conclusion that the preceding section confirms is that using MACD-based sell dates lead to more positive close_change_percent values than RSI-based sell dates in RSI cycles. The initial six stock symbols were selected based on my due diligence for stocks performing well instead of an objective criteria screen of stock symbols from the set of all NASDAQ stock symbols.
This section derives an objective sample of 242 stock symbols that does not overlap with the initial six stock symbols. The objective sample is based on the following rules for selecting stock symbols from the AllNasdaqTickerPricesfrom2014into2017 database.
- Each stock symbol must have a minimum number of daily traded shares of 100,000. This requirement is to ensure that selected stocks are easily traded.
- Each stock was required to have data for a minimum of 900 trading days. This ensures that each stock symbol has plenty of data for which to calculate RSI and MACD indicator values.
- All stock symbols must have their most recent trading day on either November 7 or 8, 2017. The data were collected from Yahoo Finance while updates for the current day of trading (November 8, 2017) were still in progress. So, the last trading day could be November 7 or 8, 2018. If a stock has historical data for neither of these two days, then it is not traded on a daily basis, and the stock is excluded from consideration for this tip.
- The minimum close price for a stock symbol must be at least $5. Institutional investors, which control the bulk of share transactions, tend to avoid stocks with a share price below $5.
- The stock symbol cannot be in the set of six stock symbols used for demonstrating how to compute and use the RSI technical indicator.
Here’s the code for the objective list of stock symbols.
- There are originally 245 stock symbols that meet the investment grade stock criteria with a large sample in the AllNasdaqTickerPricesfrom2014into2017 database.
- However, the code filters this original list of 245 stock symbols to ensure none of the six due diligence stock symbols are included. Only three of the due diligence symbols are also in the set of 245 stock symbols. The remaining three due diligence symbols failed to meet one or more of the criteria for the objective list of stocks.
- Therefore, the final list of stocks for testing with a large sample of objectively selected stock symbols in this tip is 242.
-- put objective symbol list into ##symbol
begin try
drop table ##symbol
end try
begin catch
print '##symbol not available to drop'
end catch

select *
into ##symbol
from
(
-- set of symbols with
--minimum volume > 100000
--most recent date of '2017-11-07' or '2017-11-08'
--at least 900 time series rows of data
--minimum close price of $5
-- 245 symbols meet the criteria
-- row_number order is desc on max_close-min_close
select
row_number() over (order by max_close-min_close desc) row_number, *
from
(
-- 3266
select
 symbol
,min([close]) min_close
,max([close])  max_close
,min(volume)  min_volume
,min(date)    min_date
,max(date)    max_date
,count(*)     number_recs
FROM [AllNasdaqTickerPricesfrom2014into2017].[dbo].Results_with_extracted_casted_values
group by symbol
) for_outer_query
where
min_volume > 100000
and max_date >= '2017-11-07'
and number_recs > 900
and min_close > 5
) for_odd_even_row_number

-- copy objective symbol list into #temp
begin try
drop table #temp
end try
begin catch
print '#temp not available to drop'
end catch

select
 row_number symbol_id
,symbol
into #temp
from ##symbol order by row_number

-- copy objective symbol list less
-- six due diligence symbol list into
-- fresh copy of ##symbol
begin try
drop table ##symbol
end try
begin catch
print '##symbol not available to drop'
end catch
go
-- save 245-symbol objective sample less
-- 6-symbol sample
-- 3 due diligence symbols ('SIVB', 'BZUN', 'MMSI')
-- not in objective sample list
select *
into ##symbol
from #temp
where symbol not in
('MSFT', 'NVDA', 'SIVB', 'BZUN', 'MMSI', 'MU')
For the 242 set of symbols do RSI-based or MACD-based sell dates generate more positive percent change?
The script for computing and comparing sell date types does not require any changes for different samples of stock symbols. For your convenience in evaluating the code, three T-SQL script files are provided with this tip.
- The first file (create_sample_of_six_stock_symbols.sql) populates the ##symbol table with six due diligence stock symbols.
- The second file (process_and_compare_two_different_sell_date_types.sql) processes the RSI cycles for the two types of sell dates, including the computation of a t statistic value to assess whether MACD-based sell dates generate a more positive close_change_percent than RSI-based sell dates.
- The third file (create_sample_of_242_stock_symbols.sql) populates the ##symbol table with 242 stock symbols that are picked according to objective criteria and which do not overlap with the six due diligence stock symbols.
Therefore, to evaluate if close_change_percent values are more positive for the MACD-based sell dates than the RSI-based sell dates among the set of 242 stocks, you need to run two script files.
- First, invoke the create_sample_of_242_stock_symbols.sql file.
- Second, invoke the process_and_compare_two_different_sell_date_types.sql file. Within this file is a call to the compute_paired_sample_t stored procedure.
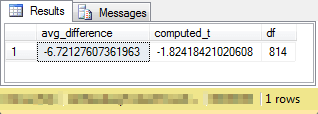
Here’s the final result set showing the output from the compute_paired_sample_t stored procedure for the sample of 242 stock symbols.
- As you can see, there are 814 degrees of freedom. This means that the total of 242 stock symbols had 815 RSI cycles overall.
- The number of degrees of freedom in most published t statistic critical value tables extends to 100 or a little beyond 100. The last row of the table is for infinite degrees of freedom, and the values for the last row match values for the cumulative normal distribution function (instead of the cumulative t distribution function). For a degrees of freedom of 814, the statistical significant t values essentially match the normal distribution, and you can use the row for an infinite degrees of freedom from a published table of critical values.
- By this rule, the critical t value for MACD-based sell dates resulting in higher positive close change percent values than RSI-based sell dates is 1.645 at the 5 percent probability level.
- Because the absolute value of the computed t is 1.824, the MACD-based sell dates generate higher average close_percent_change value at beyond the 5 percent level.
It may be worth noting that a visual inspection of the close_change_percent values with both types of sell dates shows many exceptions to the general rule supported by the statistically significant outcome. On the other hand, the overall reliability of the statistically significant difference in favor of the MACD-based sell dates is confirmed by statistical significance being confirmed for two non-overlapping sets of stock symbols. I interpret these results to mean that on average MACD-based sell dates perform better overall than RSI-based sell dates although there are many exceptions to the general rule.
I close by reminding you that the statistical test aspect of this tip design applies to any type of data domain. In other words, you can perform the same kind of analysis to assessing gasoline mileage for different grades of gas or microchip yield from two slightly different manufacturing processes.
Next Steps
There are four steps necessary for trying out the scripts from this tip.
First, you need to download the backup file for the AllNasdaqTickerPricesfrom2014into2017 database from this tip. The database includes NASDAQ historical price and volume data.
Second, you need to download a script files that can create the rsi table and the macd_indicators table in the database.
Third, you need to download the script file from this tip on a T-SQL starter statistics package. The statistics package includes code to create the compute_paired_sample_t stored procedure in a database.
The fourth step is to download the files for this tip on comparing RSI-based and MACD-based sell dates in RSI cycles from this link. After you perform the preceding steps, the link will enable you to duplicate all the metrics and statistics described in this tip.
Finally, I close by indicating that this tip is not recommending any particular stocks, including those for which results are reported in this tip nor is it recommending any specific trading rules. The stocks reported on in this tip were selected based on multiple business rules and the goals of the tip. At the time that I submitted this tip to MSSQLTips.com, I and my family members held positions in a subset of these stocks. I do occasionally use selected technical indicators, including the RSI and MACD indicators, in making decisions about which stocks to buy and when to sell stocks, but I do not routinely use the precise trading rules covered in this tip.

Rick Dobson is a SQL Server professional with decades of T-SQL experience that includes authoring books, running a national seminar practice, working for businesses on finance and healthcare development projects, and serving as a regular contributor to MSSQLTips.com. He has been a practicing Python developer for more than the past half decade – with a special emphasis for data visualization and ETL tasks with JSON and CSV files. His most recent professional passions include financial time series data and analyses, AI models, and statistics. If you are interested in growing your skills in any of these areas especially as they relate to financial securities, consider visiting his blog at https://securitytradinganalytics.blogspot.com/2023/12/.
- MSSQLTips Awards: Leadership (200+ tips) – 2025 | Author of the Year Contender – 2017-2024