Problem
I am a SQL support professional at a stock advisory service. A growing number of our advisors want to take advantage of leveraged exchange-traded funds (ETFs) for major market indexes. Please provide SQL code that helps me support our advisors serving our clients. Include SQL code to download historical price and volume data from Yahoo Finance to SQL Server and compute daily price performance metrics for the downloaded data. Finally, show how to compute summary results from the computed price performance metrics that evaluate alternative trading strategies, such as trading leveraged ETFs versus unleveraged ETFs over long timeframes.
Solution
This tip utilizes SQL to load data into SQL Server from a well-known financial website and perform computations with the downloaded data.
The download portion of this tip illustrates a robust approach for importing stock market data from a website to a computer. Then, a SQL script is used to create and configure SQL Server tables and to save the downloaded data into one of the SQL Server tables.
After the remote data is filtered and saved in a SQL Server table, three different daily price performance metrics are computed for each of the six ETFs.
Another SQL script processes the daily performance metrics to help assess if there is a difference in the performance of unleveraged ETFs versus leveraged ETFs based on market indexes.
Introduction to Index ETFs and Leveraged vs. Unleveraged ETFs
Both leveraged ETFs and unleveraged ETFs can generate returns based on an underlying index. For example, the SPY ticker designates an unleveraged ETF that aims to provide returns that are proportional to the daily return value of the S&P 500 index. If the index goes up by 1 percent in a trading day, then the SPY aims to have its price grow by 1 percent on the same day. In contrast, if the index goes down by 1 percent in a trading day, then the SPY aims to have its price decline by 1 percent on that date. Holding a SPY security can be profitable so long as it goes up on more trading days than it goes down over the time that it is held.
SPXL is the ticker symbol for a leveraged ETF. This security is also based on the S&P 500 index. However, the SPXL aims to return daily 3 times the change of its underlying index. Therefore, if the S&P 500 goes down by 1 percent on a trading day, the SPXL aims to go down by 3 percent on that trading day. Also, the SPXL is designed to rise by 3 percent on trading days when the S&P 500 index goes up by 1 percent.
Because a trade based on an incorrect assumption about the price change direction can have a 300 percent downward impact on the worth of a leveraged ETF stock position, some market technical analysts have asserted that leveraged ETFs are not suitable for long-term holdings (Leveraged ETFs: What They Are & How They Work | 3 Triple-Leveraged ETFs, and Why You Shouldn't Buy Any of Them | Volatility decay: don’t hold leveraged ETFs long-term). Their analyses consider hypothetical examples about gains and losses. This tip differs from the three cited sources because it empirically computes and evaluates returns from three pairs of ETF securities where each pair is based on actual gains and losses for the index series (namely, the S&P 500 index, the NASDAQ 100 index, and the Dow Jones Industrial Average index). Furthermore, the indexes are tracked over a timeframe of more than a decade.
The securities within an index change over time because of rebalancing, which involves dropping and adding securities to an index. The S&P 500 and the Dow Jones Industrial Average indexes are rebalanced quarterly, and the NASDAQ 100 index is rebalanced annually. A detailed discussion of the criteria for rebalancing is beyond the scope of this tip, but one major reason for rebalancing is to improve an index’s price performance going forward. In other words, securities with poor price performance are dropped from an index and replaced by other securities with better price performance.
Creating a Source Table for this Tip
The following script provides an overview of this tip’s initial source data table. The source data includes historical price and volume data for six ETFs. The six ETFs are comprised of three pairs. One member of each pair is for an unleveraged ETF, and the other member of each pair is for a leveraged ETF. Both members of each pair are for one of three indexes. The symbol_date table in the DataScience database contains the initial source data for this tip. The data was derived from Yahoo Finance.
use DataScience
go

-- identify to which of two category types six ETFs belong and
-- report earliest, most recent, and number of trading days for
-- each ETF
select
 symbol
,
 case
   when symbol in ('DIA', 'UDOW') then 'DOW JONES Industrial Average'
   when symbol in ('QQQ', 'TQQQ') then 'NASDAQ 100'
   WHEN symbol in ('SPY', 'SPXL') THEN 'S&P 500'
 end [index]
,
 case
   when symbol in ('DIA', 'QQQ', 'SPY') then 'unleveraged'
   when symbol in ('UDOW', 'TQQQ', 'SPXL') then 'leveraged'
 end leveraged_or_unleveraged
,min(date) [earliest trading date]
,max(date) [most recent trading date]
,count(*) [number of trading days]
from symbol_date
group by symbol
order by
 case
   when symbol in ('DIA', 'UDOW') then 'DOW jONES Industrial Average'
   when symbol in ('QQQ', 'TQQQ') then 'NASDAQ 100'
   WHEN symbol in ('SPY', 'SPXL') THEN 'S&P 500'
 end
,case
 when symbol in ('DIA', 'QQQ', 'SPY') then 'unleveraged'
 when symbol in ('UDOW', 'TQQQ', 'SPXL') then 'leveraged'
 end desc
,symbol
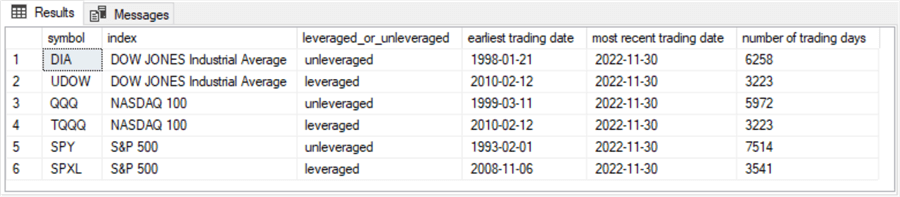
Here is the results set from the preceding script. This output orders the ticker symbols for the six ETFs analyzed in this tip by the name of its underlying index and whether the ETF is unleveraged or leveraged. The output provides the earliest trading date, the most recent trading date through 2022-11-30, and the number of trading days from the earliest trading date through the most recent trading date.
You can download historical data from the Yahoo Finance website for one ticker symbol at a time. Here’s a reference from Yahoo Finance on how to do this: Download historical data in Yahoo Finance. You can open the Yahoo Finance website to extract SPY ticker data. Suppose you request data from before the earliest possible date. In that case, Yahoo Finance will automatically prompt you to revise your request to the earliest date for which data is available for a ticker.
For this tip, data were downloaded for six tickers to the default downloads folder for a Windows user account. Then, the downloaded CSV files were copied to the C:\DataScienceSamples\ETF_Comps\ folder. This folder is used in the following script, but you can migrate the data to any other folder of your choice. Be sure to update the following script for the new path. Also, the script references with a use statement a default database named DataScience, but you can update the default database to one of your choice. The script will automatically store the downloaded data in the dbo schema of whatever database you designate in the use statement.
The following script has four main parts.
- It creates and configures two tables. One table (dbo.from_yahoo) holds the raw downloaded data. The other table (dbo.symbol_date) holds a subset of the full set of downloaded data that is appropriate for this tip.
- The script uses a decimal (19,4) data type for stock prices, such as close prices.
- The primary key constraint added to the symbol_date table stores the historical data by trading date within the symbol.
- The script uses the bulk insert statement to copy the SPY data from a file to the database.
- Notice that the bulk insert statement has its row_terminator parameter set to '0x0a'. Yahoo Finance downloads its data by default in a Unix-style of CSV file. If you open the downloaded CSV file in Excel and then save it from Excel, you can replace the ‘0x0a’ setting with the more familiar '\n' row_terminator parameter value.
- This step also subsets the full set of columns from the downloaded data to a smaller set saved in the symbol_date table. The example starts with the SPY ticker.
- The script truncates the from_yahoo table after loading and saving the SPY ticker data. Then, this step repopulates the from_yahoo table with the data from another symbol (QQQ in the sample script within this tip). Next, a subset of the current version of the from_yahoo table is inserted into the symbol_date table. At the end of this step, the symbol_date table has data for the SPY and QQQ tickers.
- This step is a repeat of the third step for a succession of additional ticker symbols – namely, DIA, SPXL, TQQQ, and UDOW. At the end of this step, the symbol_date table stores historical data for all six ETF tickers listed in the preceding screenshot.
use DataScience
go

drop table if exists dbo.from_yahoo

create table dbo.from_yahoo(
   [Date] [date] NULL,
   [Open] DECIMAL(19,4) NULL,
   [High] DECIMAL(19,4) NULL,
   [Low] DECIMAL(19,4) NULL,
   [Close] DECIMAL(19,4) NULL,
   [ADJ Close] DECIMAL(19,4) NULL,
   [Volume] float NULL
)
go

drop table if exists dbo.symbol_date

create table dbo.symbol_date(
   [Symbol] nvarchar(10) not NULL,
   [Date] [date] not NULL,
   [Open] DECIMAL(19,4) NULL,
   [High] DECIMAL(19,4) NULL,
   [Low] DECIMAL(19,4) NULL,
   [Close] DECIMAL(19,4) NULL,
   [Volume] float NULL
)
go

alter table symbol_date
add constraint pk_symbol_date primary key (symbol,date);

----------------------------------------------------------------------------------------------------------

-- bulk insert raw download for SPY into dbo.from_yahoo
bulk insert dbo.from_yahoo
from 'C:\DataScienceSamples\ETF_Comps\SPY_from_yahoo_on_11_30_2022.csv'
with
(
    firstrow = 2,
    fieldterminator = ',',  --CSV field delimiter
    rowterminator = '0x0a'  -- for lines ending with a lf and no cr
)

-- optionally echo bulk insert output
-- select * from dbo.from_yahoo

-- populate symbol_date with contents for SPY
insert into symbol_date
select
 'SPY' symbol
,cast([date] as date)
,[open]
,[high]
,[low]
,[close]
,[volume]
from dbo.from_yahoo

-- echo transferred data from dbo.from_yahoo
select * from symbol_date

----------------------------------------------------------------------------------------------------------

truncate table dbo.from_yahoo

-- bulk insert raw download for QQQ into dbo.from_yahoo
bulk insert dbo.from_yahoo
from 'C:\DataScienceSamples\ETF_Comps\QQQ_from_yahoo_on_11_30_2022.csv'
with
(
    firstrow = 2,
    fieldterminator = ',',  --CSV field delimiter
    rowterminator = '0x0a'  -- for lines ending with a lf and no cr
)

-- optionally echo bulk insert output
-- select * from dbo.from_yahoo

-- populate symbol_date with contents for SPY
insert into symbol_date
select
 'QQQ' symbol
,cast([date] as date)
,[open]
,[high]
,[low]
,[close]
,[volume]
from dbo.from_yahoo

-- echo transferred data from dbo.from_yahoo
select * from symbol_date

----------------------------------------------------------------------------------------------------------

truncate table dbo.from_yahoo

-- bulk insert raw download for DIA into dbo.from_yahoo
bulk insert dbo.from_yahoo
from 'C:\DataScienceSamples\ETF_Comps\DIA_from_yahoo_on_11_30_2022.csv'
with
(
    firstrow = 2,
    fieldterminator = ',',  --CSV field delimiter
    rowterminator = '0x0a'  -- for lines ending with a lf and no cr
)

-- optionally echo bulk insert output
-- select * from dbo.from_yahoo

-- populate symbol_date with contents for SPY
insert into symbol_date
select
 'DIA' symbol
,cast([date] as date)
,[open]
,[high]
,[low]
,[close]
,[volume]
from dbo.from_yahoo

-- echo transferred data from dbo.symbol_date
select * from symbol_date

----------------------------------------------------------------------------------------------------------

truncate table dbo.from_yahoo

-- bulk insert raw download for SPXL into dbo.from_yahoo
bulk insert dbo.from_yahoo
from 'C:\DataScienceSamples\ETF_Comps\SPXL_from_yahoo_on_11_30_2022.csv'
with
(
    firstrow = 2,
    fieldterminator = ',',  --CSV field delimiter
    rowterminator = '0x0a'  -- for lines ending with a lf and no cr
)

-- optionally echo bulk insert output
-- select * from dbo.from_yahoo

-- populate symbol_date with contents for SPY
insert into symbol_date
select
 'SPXL' symbol
,cast([date] as date)
,[open]
,[high]
,[low]
,[close]
,[volume]
from dbo.from_yahoo

-- echo transferred data from dbo.from_yahoo
select * from symbol_date

----------------------------------------------------------------------------------------------------------

truncate table dbo.from_yahoo

-- bulk insert raw download for TQQQ into dbo.from_yahoo
bulk insert dbo.from_yahoo
from 'C:\DataScienceSamples\ETF_Comps\TQQQ_from_yahoo_on_11_30_2022.csv'
with
(
    firstrow = 2,
    fieldterminator = ',',  --CSV field delimiter
    rowterminator = '0x0a'  -- for lines ending with a lf and no cr
)

-- optionally echo bulk insert output
-- select * from dbo.from_yahoo

-- populate symbol_date with contents for SPY
insert into symbol_date
select
 'TQQQ' symbol
,cast([date] as date)
,[open]
,[high]
,[low]
,[close]
,[volume]
from dbo.from_yahoo

-- echo transferred data from dbo.from_yahoo
select * from symbol_date

----------------------------------------------------------------------------------------------------------

truncate table dbo.from_yahoo

-- bulk insert raw download for UDOW into dbo.from_yahoo
bulk insert dbo.from_yahoo
from 'C:\DataScienceSamples\ETF_Comps\UDOW_from_yahoo_on_11_30_2022.csv'
with
(
    firstrow = 2,
    fieldterminator = ',',  --CSV field delimiter
    rowterminator = '0x0a'  -- for lines ending with a lf and no cr
)

-- optionally echo bulk insert output
-- select * from dbo.from_yahoo

-- populate symbol_date with contents for SPY
insert into symbol_date
select
 'UDOW' symbol
,cast([date] as date)
,[open]
,[high]
,[low]
,[close]
,[volume]
from dbo.from_yahoo

-- echo transferred data from dbo.from_yahoo
select * from symbol_date

----------------------------------------------------------------------------------------------------------
The following two screenshots depict the first and last eight rows from the symbol_date table for the SPY ticker symbol. The symbol and date columns are necessary because these two columns comprise the primary key for the table. At least one of the price columns is also necessary when examining price performance. This tip uses the close column values to assess price performance because the closing price represents the price of a security, such as the SPY, at the end of a regular day of trading.
- Notice that the date for the first row in the first set of eight rows is 1993-02-01. The SPY ETF is among the earliest listed ETF securities. No other ticker in this tip has an initial trading date as early as the one for the SPY ticker.
- The last row in the second set of eight rows has a date of 2022-11-30. All six tickers in this tip have a final trading date of 2022-11-30.


Computing Inputs for Price Performance Metrics on a Pair of ETF Tickers
There are two more parts of the code for this tip.
- First, the script in this section computes the daily performance metrics for a pair of ticker symbols. The two ticker symbols should be based on the same underlying index. For example, the SPY and SPXL ETFs are based on the S&P 500 index. This script computes three price performance metrics.
- The first performance metric is the percentage change in close price from the preceding trading date. This metric reflects the change in price for the current trading day to the price on the preceding trading day.
- The second performance metric is the ratio of the current close price divided by the close price for the earliest trading date for both ETFs in a pair. This metric denotes the cumulative gain from the earliest trading date through the current trading date.
- The third performance metric is the compound annual growth rate (CAGR). This metric is not computed in this section’s script. However, key inputs for the computation of the CAGR are saved by this section’s script. The script uses these saved results in the next section to compute the CAGR. The CAGR represents the average annual percentage change from the earliest trading date through the most recent trading date in a series.
- The last part of the code for this tip is the subject of the next section. The code in the next section summarizes and evaluates the significance of the performance metrics computed in this section and the next one.
The following script implements the objectives of this section.
- A declare statement designates two sets of local variables
- The @unleveraged_ticker and @leveraged_ticker local variables store scalar values with the ticker symbol for each member of a pair of tickers. The tickers should be for unleveraged and leveraged ETFs based on the same index
- The @unleveraged_first_close and @leveraged_first_close local variables are for storing the initial close value for the tickers on which the script operates
- The code works for one pair of ETFs at a time
- The following script shows the set statements with ticker value assignments of SPY and SPXL to the @unleveraged_ticker and @leveraged_ticker local variables
- With each pass through the script file in this section and the next section, the ##ticker_set global temp table stores the @unleveraged_ticker and @leveraged_ticker local variable values in its unleveraged_ticker and leveraged_ticker columns
- Next, two set statements assign values to the @unleveraged_first_close and @leveraged_first_close local variables
- The next select statement in the script populates the ##computed_metrics_by_trading_date global temp table. This table stores the price performance metrics and other critical values. The source data for the global temp table is a join between two derived tables
- The first derived table has the name unleveraged_closes, and the second derived table has the name leveraged_closes. Each of the derived tables is based on the symbol_date table with different where clause criteria
- The join is based on the date column from each of the derived tables
- The join not only matches rows by date between the two derived tables but also filters out rows that are not in both tables. Because all three ETF pairs have more rows in their unleveraged table than their leveraged table, this filtering role is critical
- The script ends with an alter table statement for the ##computed_metrics_by_trading_date table. The alter table statement adds a primary key constraint based on the date column
use DataScience
go

-- store leveraged and unleveraged ETF close values and performance metrics
-- by trading date in ##computed_metrics_by_trading_date

-- declare local variables
declare
 @unleveraged_ticker nvarchar(10)
,@leveraged_ticker nvarchar(10)
,@unleveraged_first_close dec(19,4)
,@leveraged_first_close dec(19,4)

-- store unleveraged and leveraged ticker values
-- in local variables and fresh version of ##ticker_set
set @unleveraged_ticker = 'SPY';
set @leveraged_ticker = 'SPXL';

drop table if exists ##ticker_set

create table ##ticker_set(
 unleveraged_ticker nvarchar(10)
,leveraged_ticker nvarchar(10)
)

insert into ##ticker_set
values (@unleveraged_ticker, @leveraged_ticker)

-- extract unleveraged and leveraged first close values
-- the unleveraged_first_close date is the same as the
-- leveraged_first_close date so that the two price series
-- cam span the same range of dates
set @unleveraged_first_close = (select [close] unleveraged_close
from symbol_date
where
 symbol = @unleveraged_ticker and
 date = (select min(date)
 from symbol_date where symbol = @leveraged_ticker))

set @leveraged_first_close = (select [close] leveraged_close
from symbol_date
where
 symbol = @leveraged_ticker and
 date = (select min(date)
 from symbol_date where symbol = @leveraged_ticker))

-- compute values for unleveraged and leveraged datasets
-- and save in fresh ##computed_metrics_by_trading_date table

drop table if exists ##computed_metrics_by_trading_date

select
 unleveraged_closes.date

,unleveraged_closes.unleveraged_close
,lag(unleveraged_closes.unleveraged_close,1) over (order by unleveraged_closes.date) [prior unleveraged_close]

,leveraged_closes.leveraged_close
,lag(leveraged_closes.leveraged_close,1) over (order by unleveraged_closes.date) [prior leveraged_close]

,cast((unleveraged_closes.unleveraged_close
  - (lag(unleveraged_closes.unleveraged_close,1) over (order by unleveraged_closes.date))) as dec(19,4)) [unleveraged_change]

,cast((leveraged_closes.leveraged_close
  - (lag(leveraged_closes.leveraged_close,1) over (order by leveraged_closes.date))) as dec(19,4)) [leveraged_change]

,cast(((unleveraged_closes.unleveraged_close
  - (lag(unleveraged_closes.unleveraged_close,1) over (order by unleveraged_closes.date))))
  /(lag(unleveraged_closes.unleveraged_close,1) over (order by unleveraged_closes.date))*100 as dec(19,4)) [unleveraged_change_percent]

,cast(((leveraged_closes.leveraged_close
  - (lag(leveraged_closes.leveraged_close,1) over (order by leveraged_closes.date))))
  /(lag(leveraged_closes.leveraged_close,1) over (order by leveraged_closes.date))*100 as dec(19,4)) [leveraged_change_percent]

,
 cast(case
  when isnumeric(lag(unleveraged_closes.unleveraged_close,1) over (order by unleveraged_closes.date)) = 0 then NULL
  else unleveraged_closes.unleveraged_close/@unleveraged_first_close
 end as dec(19,2)) [unleveraged_performance]

,
 cast(case
  when isnumeric(lag(unleveraged_closes.unleveraged_close,1) over (order by unleveraged_closes.date)) = 0 then NULL
  else leveraged_closes.leveraged_close/@leveraged_first_close
 end as dec(19,2)) [leveraged_performance]

into ##computed_metrics_by_trading_date
from
(
select symbol, date, [close] unleveraged_close
from symbol_date
where symbol = @unleveraged_ticker
) unleveraged_closes

join

(
-- leveraged close values
select symbol, date, [close] leveraged_close
from symbol_date
where symbol = @leveraged_ticker
) leveraged_closes

on unleveraged_closes.date = leveraged_closes.date


alter table ##computed_metrics_by_trading_date
add constraint pk_##computed_metrics_by_trading_date primary key (date);
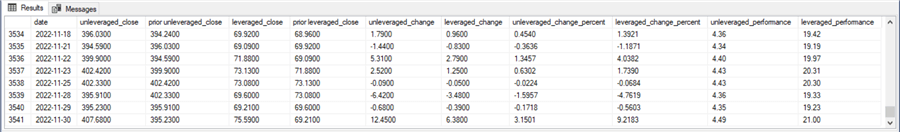
For your easy reference and to help you follow the code, the following two screenshots show the first and last eight rows from the ##computed_metrics_by_trading_date global temp table based on the preceding script:
- Notice from the second screenshot that there are 3541 rows in the ##computed_metrics_by_trading_date table. This is the exact same number of dates for the SPXL ticker in the symbol_date table. Although there are thousands of more rows for the SPY ticker, the unmatched SPY dates are filtered out of the ##computed_metrics_by_trading_date table by the join between the two underlying derived source tables.
- The first screenshot shows NULL values in many columns on its first row. All the columns with NULL values for the first date depend directly or indirectly on the prior row derived with a lag function. Because the first row, by definition, does not have a prior row, these column values in the first row are NULL.

Summarizing and Evaluating Price Performance Metrics
The script in this section, along with the commentary on the results sets across the three pairs of ETFs, measures performance for each member of a pair of unleveraged and leveraged ETFs. The source data for the script are the contents of the ##computed_metrics_by_trading_date global table created and populated by the script in the previous section. By changing the settings for the @unleveraged_ticker and @leveraged_ticker local variable values and running the script in the prior section, you can compute, summarize, and display performance metrics in this section’s script for a fresh pair of ticker symbols.
Three different performance metrics are reported in this section.
- The average change percent between pairs of contiguous trading days gives an overview of daily changes for an ETF. The dates are those from the date column in the ##computed_metrics_by_trading_date table. For each of the three pairs of tickers in this tip, the average percent change for the leveraged ETF ticker should be 3 times as large as for the ticker of the unleveraged ETF. This result reflects the mathematics for deriving the leveraged ETF compared to the unleveraged ETF.
- The unleveraged and leveraged performance is merely the ratio of the most recent close price for an ETF divided by the earliest price for an ETF. This metric reflects the overall growth from the first trading date through the last trading date for an ETF.
- If the ratio is 1, then there is no growth in price from the first relative to the last trading date.
- If the ratio is greater than 1, then the price for the last trading date has grown by the performance ratio relative to the earliest trading date. The larger the ratio, the greater the gain
- If the ratio is less than 1, then there is a percentage loss from the first price relative to the last price. The smaller the ratio, the greater the loss
- The CAGR is the average annual percentage change from the beginning close price through the ending close price in a series.
- This metric depends on the beginning close price, the ending close price, and the number of years, including fractional parts, between the beginning and ending dates.
- The number of years, including fractional parts, equals the total trading days from the beginning to the ending trading date divided by 252. This is because there are approximately 252 trading days in a calendar year.
The following script evaluates the preceding three performance metrics for each pair of ETF tickers referenced in this tip (SPY vs. SPXL, QQQ vs. TQQQ, and DIA vs. UDOW).
- The script below starts with commented code unnecessary for the demonstration. However, some readers may find this code and its comments helpful in understanding the application for this demonstration as well as understanding how to learn about temporary tables
- Next, there is some set-up code for reporting the performance metrics
- For example, a declare statement names 11 local variables and assigns data types to them
- Next, the code extracts the unleveraged and leveraged ETF tickers from the ##ticker_set table. These values reflect the settings for the @unleveraged_ticker and @leveraged_ticker local variables from the last time the script in the prior section was run. The extracted values are referenced in code that assigns a title to the results sets from the following script
- The next local variable assignments are for the beginning and ending dates from the ##computed_metrics_by_trading_date table
- The next select statement is for the first performance metric
- The second next select statement is for the second performance metric
- The remainder of the script is for computing the CAGR for the unleveraged and leveraged ETFs. This code assigns values for the items in the CAGR expression. Then, the item values are plugged into the CAGR expression. The expression for a CAGR is as follows
(Ending close price/Beginning close price)(1/n) -1)*100
where n is the number of whole and fractional years from the beginning date through the ending date
The CAGR values are computed separately for the unleveraged ETF and the leveraged ETF.
use DataScience
go

/*
-- optionally display data types for columns in ##computed_metrics_by_trading_date
-- exec tempdb..sp_help ##computed_metrics_by_trading_date

-- optionally display source comparison data for unleveraged versus tickers
select
 date
,unleveraged_close
,[prior unleveraged_close]
,leveraged_close
,[prior leveraged_close]
,unleveraged_change
,leveraged_change
,unleveraged_change_percent
,leveraged_change_percent
,unleveraged_performance
,leveraged_performance
from ##computed_metrics_by_trading_date

*/
-----------------------------------------------------------------------------------
go
declare
 @unleveraged_ticker nvarchar(10)
,@leveraged_ticker nvarchar(10)
,@beginning_date date
,@ending_date date
,@number_of_years dec(19,2)
,@beginning_unleveraged_close dec(19,4)
,@ending_unleveraged_close dec(19,4)
,@beginning_leveraged_close dec(19,4)
,@ending_leveraged_close dec(19,4)
,@unleveraged_cagr dec(19,2)
,@leveraged_cagr dec(19,2)


-- set and display unleveraged and leveraged ticker values
set @unleveraged_ticker = (select unleveraged_ticker from ##ticker_set)
set @leveraged_ticker = (select leveraged_ticker from ##ticker_set)

select 'Results for unleveraged ticker (' + @unleveraged_ticker + ')'
 + ' and leveraged ticker (' + @leveraged_ticker + ')' [Header for Results]

-- extract and set @beginning_date and @ending_date values
-- from ##computed_metrics_by_trading_date
select
 @beginning_date = (select min(date) from ##computed_metrics_by_trading_date)
,@ending_date =  (select max(date) from ##computed_metrics_by_trading_date)
from ##computed_metrics_by_trading_date


-- compute average unleveraged_change_percent and average leveraged_change_percent
-- displayed to two places after the decimal
-- notice the leveraged change percent is about 3 times larger than
-- the unleveraged change percent
select
 cast(avg(unleveraged_change_percent)*100 as dec(19,2)) [average unleveraged_change_percent]
,cast(avg(leveraged_change_percent)*100 as dec(19,2)) [average leveraged_change_percent]
from ##computed_metrics_by_trading_date

-- compare the final leveraged performance to the final unleveraged performance
-- notice the leveraged ticker grows its initial balance amount by
-- more than 2 times the growth amount for the unleveraged ticker
select date, unleveraged_performance, leveraged_performance
from ##computed_metrics_by_trading_date
where date = @ending_date


-------------------------------------------------------------------------------------------


select @beginning_unleveraged_close = unleveraged_close
from ##computed_metrics_by_trading_date
where date = @beginning_date

select @ending_unleveraged_close = unleveraged_close
from ##computed_metrics_by_trading_date
where date = @ending_date

select  @number_of_years = cast(cast(count(*) as dec(19,2))/252 as dec(19,2))
from ##computed_metrics_by_trading_date

select @unleveraged_cagr =
   (power(( @ending_unleveraged_close/@beginning_unleveraged_close),(1.0/@number_of_years))-1)*100

select
 @beginning_unleveraged_close [@beginning_unleveraged_close]
,@ending_unleveraged_close [@ending_unleveraged_close]
,@number_of_years [@number_of_years]
,@unleveraged_cagr [@unleveraged_cagr]


select @beginning_leveraged_close = leveraged_close
from ##computed_metrics_by_trading_date
where date = @beginning_date

select @ending_leveraged_close = leveraged_close
from ##computed_metrics_by_trading_date
where date = @ending_date

select  @number_of_years = cast(cast(count(*) as dec(19,2))/252 as dec(19,2))
from ##computed_metrics_by_trading_date

select @leveraged_cagr =
   (power(( @ending_leveraged_close/@beginning_leveraged_close),(1.0/@number_of_years))-1)*100

select
 @beginning_leveraged_close [@beginning_leveraged_close]
,@ending_leveraged_close [@ending_leveraged_close]
,@number_of_years [@number_of_years]
,@leveraged_cagr [@leveraged_cagr]
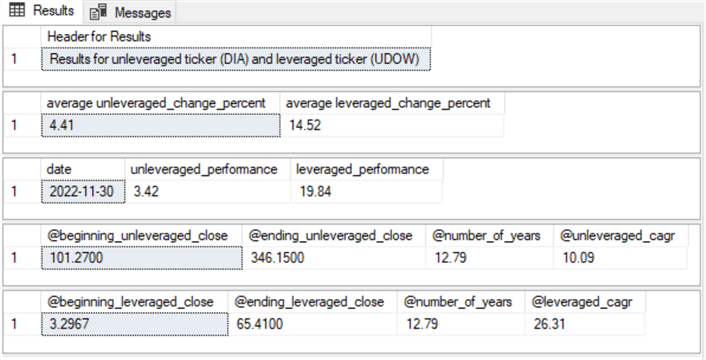
Here is a screenshot showing the results sets from the preceding script. These results sets appear as a series of vertically stacked panes – one for each of the select statements in the preceding script:
- The first pane indicates that the unleveraged ticker is for the SPY ticker, and the leveraged ticker is for the SPXL ticker.
- The second pane shows the average daily unleveraged percent change versus the average daily leveraged percent change. The average leveraged percent change is about three times larger than the average unleveraged percent change. This outcome follows from the definition of the SPY and SPXL ETFs.
- The third pane is the ratio of the last close price to the earliest close price for the unleveraged and leveraged ETFs, respectively
- The unleveraged ETF returns a performance ratio of 4.49, which means that if you invested $1000 at the close price on the first trading date, that investment would have grown to $4,490 by the close of the last trading date.
- On the other hand, the leveraged ETF returns a performance ratio of 21. Therefore, an investment of $1000 at the initial close price would have grown to $21,000 by the close of the last trading date.
- The fourth and fifth panes show the CAGR for the unleveraged ETF and the leveraged ETF. Recall that this metric shows the average annual return from the beginning date through the ending date. A value of between 8 and 12 percent is a good return. A value from the mid-teens on up indicates an exceptional return. By these standards,
- the unleveraged EFT returns good results
- while the leveraged EFT returns exceptional results

The following two screenshots show similarly computed results set panes for the QQQ versus the TQQQ ETFs and the DIA versus the UDOW ETFs. Two types of findings stand out.
- The QQQ and TQQQ tickers have superior performance metrics than either of the other two pairs of ETFs
- Across all three pairs of ETFs, the leveraged ETFs consistently generated larger returns than their corresponding unleveraged ETFs. Therefore, contrary to the assertions in some prior articles, leveraged ETFs can substantially outperform unleveraged ETFs for long-term holdings over a 12-14 year timeframe

Next Steps
The major thrust of this tip is to assess if leveraged ETFs or unleveraged ETFs are better at growing wealth for long-term investments. Some prior published assessments judged that leveraged ETFs were inferior to unleveraged ETFs for growing an initial investment into a long-term investment. This tip is different in its approach to the issue in that it empirically assesses which type of ETF is better for capital growth. The empirical results from this tip do not support the judgments from some prior articles. In fact, the leveraged ETFs demonstrated their superior ability to grow capital over long-term timeframes of 12 years and 14 years.
When working in a business environment with beliefs about the performance of some business entities, whether they be factories, regional sales offices, or ETFs, you can use an evaluation framework adapted from the one in this tip to test the validity of beliefs about the business entities.
Before you adopt the approach demonstrated in this tip to your specific business issue, it may be helpful to replicate the framework exactly as it is presented in this tip. To that end, this tip’s download includes several SQL scripts along with CSV files for replicating the results in this tip. You are also reminded that the tip includes a link to a web page with instructions on downloading the CSV files from Yahoo Finance.
- The CSV files are in a Unix style instead of a Microsoft style. The file names start with the ticker symbol for the content in the file:
- DIA_from_yahoo_on_11_30_2022.csv
- QQQ_from_yahoo_on_11_30_2022.csv
- SPXL_from_yahoo_on_11_30_2022.csv
- SPY_from_yahoo_on_11_30_2022.csv
- TQQQ_from_yahoo_on_11_30_2022.csv
- UDOW_from_yahoo_on_11_30_2022.csv
- There are four SQL files:
- Populate_symbol_date_in_DataScience_reg_vs_levered.sql performs bulk insert commands on the six CSV files to facilitate transferring their contents to a single symbol_date SQL Server table
- “Categorize ticker symbols for tip.sql” reads the symbol_date table and extracts information to validate the correct operation of the load
- Compute_leveraged_vs_unleveraged_ETF_index_performance_metrics.sql computes selected performance metrics for two ticker symbols from the symbol_date table; this script file returns two global temporary tables that are read as input by the last SQL script file
- Summarize_evaluate_leveraged_vs_unleveraged_performance_metrics.sql computes three performance metrics for each member of a pair of leveraged and unleveraged ETFs based on the same underlying index

Rick Dobson is a SQL Server professional with decades of T-SQL experience that includes authoring books, running a national seminar practice, working for businesses on finance and healthcare development projects, and serving as a regular contributor to MSSQLTips.com. He has been a practicing Python developer for more than the past half decade – with a special emphasis for data visualization and ETL tasks with JSON and CSV files. His most recent professional passions include financial time series data and analyses, AI models, and statistics. If you are interested in growing your skills in any of these areas especially as they relate to financial securities, consider visiting his blog at https://securitytradinganalytics.blogspot.com/2023/12/.
- MSSQLTips Awards: Leadership (200+ tips) – 2025 | Author of the Year Contender – 2017-2024


