Problem
As the modern data platform continues evolving towards greater usability for more citizen developers, data engineering and analysis capabilities have been steering towards low code, no code, and natural language-based artificial intelligence (AI)-infused platform support. With robust GUI-based interfaces and AI assistants available on several major cloud platforms, data engineers and analysts can benefit from these tools to help with complex, time-consuming code generation and debugging efforts.
Solution
Databricks Assistant, a context-aware native AI assistant, and Bamboolib, a no-code data analysis and transformation framework, are examples of easily accessible tools within Spark-based Engineering and Analysis platforms that can immensely enhance code quality and delivery time. With a few simple clicks, various personas can build and debug complex code. A capabilities exploration of Databricks Assistant and Bamboolib is highly desired by both citizen and expert data engineers and analysts.
Getting Started with Databricks Assistant
If you have used ChatGPT or other LLM-based applications, you most likely have some experience with Prompt Engineering, the process of providing context to a Generative AI model to obtain a favorable response. Databricks Assistant is very similar and can be accessed within the Databricks Workspace by clicking the icon shown in Step#2 in the figure below. If it is not enabled, you’ll need to navigate to the Azure Databricks account site to enable this feature.
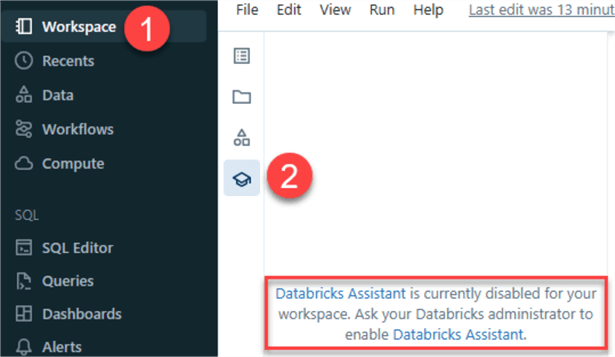
Once on the Databricks account site, click Settings and Feature enablement to view a list of features that can be enabled. Scroll down and ‘Enable third party services for AI assistive features.’ Enabling this feature would allow the Assistant to leverage the Unity Catalog metadata to understand your tables, columns, and data to provide personalized responses. While Databricks has strong programs to manage risks to their environment, you’ll need to check if you are permitted to use this Assistant at your organization.

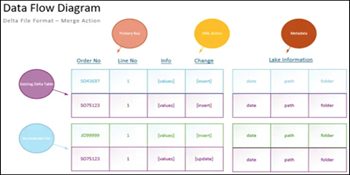
Once enabled, you can interact with the Assistant within your workspace. For example, I asked the Assistant to write Python code to create a metadata-driven Lakehouse architecture. Within seconds, it returned a Python framework to use as a starting point. It is important to note that the AI model may generate hallucinations within the code.
A hallucination is a confident response that is incorrect, which is why the code should be thoroughly reviewed, rewritten (as needed), and tested. Also, the generated code is only as good as the context it can derive from the prompt provided to the Assistant. A comprehensive and well-put-together prompt can possibly yield a completely different code. Exploration and creativity with prompts are key to getting close to a desired framework within your code. While this may take time, and the code might not be perfect from the start, this Assistant provides developers with decent code frameworks that can be leveraged and built upon. Furthermore, as this Assistant continues its evolution with fine tuning and re-training, it will get better and more accurate over time. This Assistant continues its growth to LakehouseIQ, which is built and governed by the Unity Catalog and promotes specialized and accurate enterprise models.

import yaml
import glob
import os
from delta.tables import *
from pyspark.sql import SparkSession
from pyspark.sql.functions import *

# define the Spark session
spark = SparkSession.builder.appName("MedallionLakehouse").getOrCreate()

# read the YAML-based configuration file for the table schema
with open('table_schema.yaml', 'r') as yamlfile:
    schema = yaml.load(yamlfile, Loader=yaml.FullLoader)

# specify the paths to the Bronze, Silver, and Gold directories
bronze_path = "/mnt/bronze/"
silver_path = "/mnt/silver/"
gold_path = "/mnt/gold/"

# loop through all Bronze tables and create the Silver and Gold tables
for table_name in schema:
    # construct the path to the Parquet file for this table
    table_path = os.path.join(bronze_path, f"{table_name}.parquet")

    # read the data into a Spark DataFrame
    bronze_df = spark.read.format("parquet").load(table_path)

    # apply bronze-level transformations to the DataFrame based on the schema defined in table_schema.yaml
    silver_df = bronze_df.selectExpr([f"{t['expression']} as {t['column_name']}" for t in schema[table_name]['silver_level']])
    gold_df = silver_df.selectExpr([f"{t['expression']} as {t['column_name']}" for t in schema[table_name]['gold_level']])

    # add event-time watermarks for each Bronze and Silver table
    bronze_df = bronze_df.withWatermark("timestamp", "1 minutes")
    silver_df = silver_df.withWatermark("timestamp", "1 minutes")

    # write the Delta table for each level
    bronze_delta_path = os.path.join(silver_path, f"bronze_{table_name}")
    silver_delta_path = os.path.join(silver_path, f"silver_{table_name}")
    gold_delta_path = os.path.join(gold_path, f"gold_{table_name}")
    bronze_df.write.format("delta").mode("append").save(bronze_delta_path)
    DeltaTable.forPath(spark, bronze_delta_path).toDF().createOrReplaceTempView(f"bronze_{table_name}")
    silver_df.write.format("delta").mode("append").save(silver_delta_path)
    DeltaTable.forPath(spark, silver_delta_path).toDF().createOrReplaceTempView(f"silver_{table_name}")
    gold_df.write.format("delta").mode("append").save(gold_delta_path)
    DeltaTable.forPath(spark, gold_delta_path).toDF().createOrReplaceTempView(f"gold_{table_name}")

  # create a global ephemeral view that unions Bronze, Silver and Gold tables
  spark.sql(f"SELECT * FROM bronze_{table_name} UNION SELECT * FROM silver_{table_name} UNION SELECT * FROM gold_{table_name}").createGlobalTempView(f"{table_name}_view")
Getting Started with Bamboolib
Bamboolib is an interesting support tool with a robust no-code UI for data analysis, wrangling, exploration, transformation, and visualization in our Databricks notebook. It generates sharable Python code automatically based on your UI selections. Bamboolib uses ipywidgets, an interactive HTML widget framework for running within an IPython kernel.
To start, ensure that you are running Databricks Runtime 11.0 or above, and run the following code to install the package:
%pip install bamboolib

Also, run the following code to import the library needed for bamboolib to function:
import bamboolib as bam
Upon successful installation, run ‘bam’ in a new notebook cell to access the UI and notice the available options for loading data.

Several dummy datasets could also be useful for exploring this tool’s capabilities. Let’s pick the Sales dataset to perform some analysis and engineering.

You’ll then have the option to name the dataframe and execute the code.
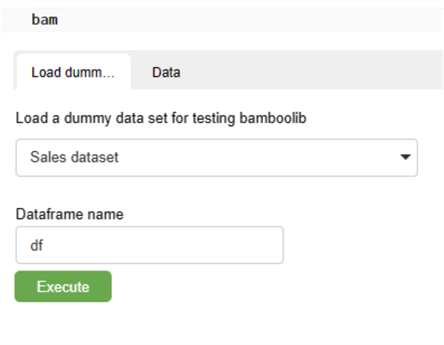
Notice that the dataset and source code have been provided without needing to type a single line of code.

There is also an option to ‘Create plot,’ which we will explore further.

Several plot types and other options can be customized to a particular use case. Code will continue to be generated for each customized selection. For example, the following bar chart plots the total revenue by region:

Data quality checks can also be easily performed granularly by selecting a glimpse of the data, predictor patterns, and Correlation Matrix.

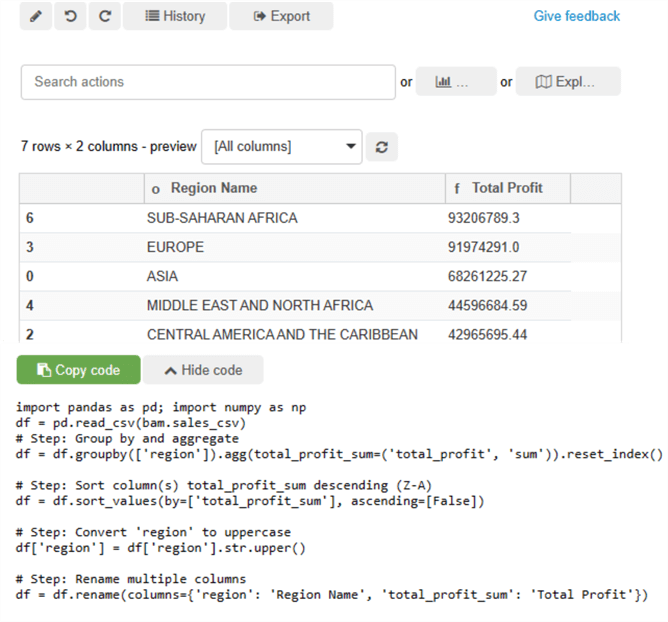
The UI also supports appending multiple transformations as steps that will be aggregated within the same code block. In this example, I used the UI to group the total profit by region name. The total profits by region were then sorted in descending order. The third step performed a conversion of all Region names to upper case. Finally, in step four, the column names were renamed. This process can be completed and customized to any use case and dataset. The framework will generate complex Python code, as shown below.
import pandas as pd; import numpy as npdf = pd.read_csv(bam.sales_csv)
# Step: Group by and aggregate
df = df.groupby(['region']).agg(total_profit_sum=('total_profit', 'sum')).reset_index()

# Step: Sort column(s) total_profit_sum descending (Z-A)
df = df.sort_values(by=['total_profit_sum'], ascending=[False])

# Step: Convert 'region' to uppercase
df['region'] = df['region'].str.upper()

# Step: Rename multiple columns
df = df.rename(columns={'region': 'Region Name', 'total_profit_sum': 'Total Profit'})
From the Transformations History tab, you can see a consolidated list of all the steps performed on the dataset, giving you the option to edit or recover steps.

Let’s take the code and display it in a notebook cell. I’ll intentionally use the wrong line of code to display the results. As expected, we’ve received an ‘AttributeError’ and a visible button underneath the error to ‘Diagnose error.’
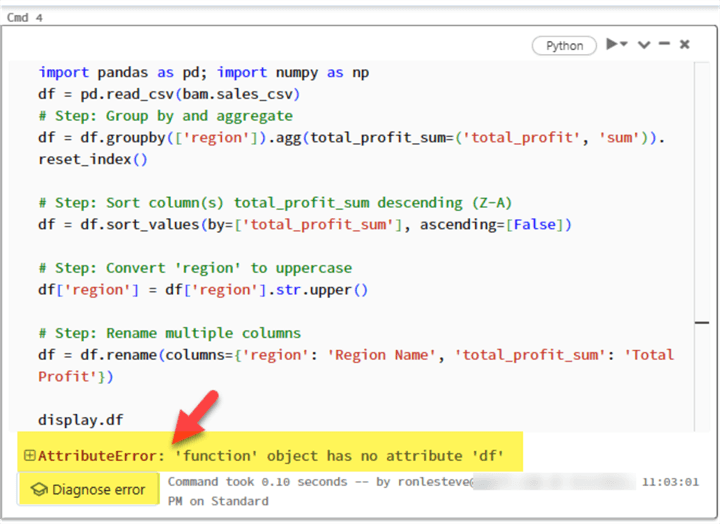
By clicking the ‘Diagnose error’ button, we can see that the Assistant has automatically generated a prompt asking itself ‘How do I fix my code?’ on my behalf. It also rewrote the code and explained what was changed, which resolved the issue. While this is a simple example, it is important to remember that as the use cases get more complex, hallucinations may be part of the process, so it is always critical to double- and triple-check your code manually.

import pandas as pdimport numpy as np

df = pd.read_csv(bam.sales_csv)

# Step: Group by and aggregate
df = df.groupby(['region']).agg(total_profit_sum=('total_profit', 'sum')).reset_index()

# Step: Sort column(s) total_profit_sum descending (Z-A)
df = df.sort_values(by=['total_profit_sum'], ascending=[False])

# Step: Convert 'region' to uppercase
df['region'] = df['region'].str.upper()

# Step: Rename multiple columns
df = df.rename(columns={'region': 'Region Name', 'total_profit_sum': 'Total Profit'})

# Display the resulting DataFrame
display(df)
Next Steps
- Please read more about Databricks Assistant FAQ – Azure Databricks | Microsoft Learn
- For a complete list of capabilities, reference bamboolib – Azure Databricks | Microsoft Learn
- Explore Introducing Databricks Assistant, a context-aware AI assistant | Databricks Blog
- Read Introducing LakehouseIQ: The AI-Powered Engine that Uniquely Understands Your Business | Databricks Blog

Ron C. L’Esteve is a Data and AI Leader and professional Author residing in Chicago, IL, USA. He is well-known for his impactful books and article publications on Azure Data & AI Architecture, Engineering, and Leadership. Ron holds a Master of Business Administration (M.B.A.) and Master of Science in Corporate Finance (M.S.F.) from Loyola University Chicago. Ron possesses deep technical skills and experience in designing, implementing, leading, and delivering modern Azure Data & AI projects for numerous clients around the world. He is a Motorola Certified Six Sigma Green Belt, a Microsoft Global Challenger, and also holds numerous additional Microsoft, Snowflake, and Databricks professional certifications in Big Data Engineering, Artificial Intelligence, Apache Spark and Data Platform Architecture.
- MSSQLTips Awards: Champion (100+ tips) – 2023 | Author of the Year – 2020-2021 | Rookie of the Year – 2019