Problem
Companies generate a huge amount of data on a daily basis from such things as sales transactions, inventory changes, and customer interactions. This data originates from different data sources and is stored in operational databases called OLTP (Online Transaction Processing) systems that primary focuses on transactions like data inserts, updates or deletes. Maintaining the transactional data in an OLTP database is important. However, if you need to analyze or report on the data, storing the data in a centralized repository in well-structured schema is necessary.
Solution
The best solution analyzing and reporting on vast amounts of data is creating a Data Warehouse. A Data Warehouse acts as a centralized repository, is subject oriented, time variant and non-volatile repository. It is designed for data analytics and reporting. Data Warehousing will provide insights into business operations and will help grow the business in many ways. A Data Warehouse is considered an OLAP (Online Analytical Processing) platform. It is optimized for data aggregation and read heavy queries run on large volume of data.
Table of Contents
OLTP – Online Transaction Processing
OLTP systems are transactional databases focusing on running inserts and updates as efficiently as possible. An example includes banking systems which have real time data processing. OLTP platforms are designed for high-speed data access and processing. OLTP systems are designed to handle a large number of concurrent users ensuring data reliability and data accuracy due to its ACID property.
OLAP – Online Analytical Processing
OLAP systems are data warehouses, which are designed for running analytical queries and reporting. An OLAP platform acts as a centralized repository holding data from multiple OLTP systems in a well-structured manner. The OLAP systems have a denormalized schema design, to improve performance for running analytical queries or perform historic data analysis.
Facts and Dimensions
There are two types of tables in a Data Warehouse: Facts and Dimensions. Let’s review each.
Fact Tables
A Facts Table is designed with:
- The primary key column
- Foreign Keys which reference the Dimensions
- Measures are calculations such as: profit, amount, quantity, etc.
Facts are large table and grows over time. Sample Fact Tables are sales, orders, web site clicks, etc.
Types of Fact Tables
There are five types of fact tables which are explained below.
Additive Facts
Additive Fact tables can have measures aggregated across all the dimensions. For example, sales amount, total quantity sold, revenue calculation, etc. This is the most common type of fact that is used in data warehouse and we can aggregate the data as per our requirements by day, week, month, quarter and/or year. Data can be aggregated to the minute or second level depending on your date and time dimension attributes.
Semi Additive Facts
Semi Additive Fact tables are those which are aggregated across some dimensions, but not across all dimensions. There are some scenarios in which aggregating does not make any business logic. For example, you want to aggregate product sales it can be summed across month or date, but it does not make any sense summing up across region due to product usage.
Non-Additive Facts
Non-Additive Fact Tables are those which cannot be summed up across any of the dimensions. These facts include percentage, ratios, averages, standard deviation, etc. which cannot be aggregated or do not have any business logic.
Factless Facts
Factless Fact tables are those which do not include any measures. This type of fact table is used to track events for example maintaining attendance of employees or students. This fact table help you in counting occurrences.
Derived Facts
Derived Facts do not store aggregates in Fact table directly, but the aggregates can be calculated using other fact tables for example calculating the profit by subtracting sales amount from the production cost amount.
Dimension Tables
Dimensions contains the descriptive attribute which provides context to the fact table. These tables include details for the Fact table. For example, Date, Time, Region, Sales Person, Product Name, Category, etc. Dimensions are usually smaller in size than a Fact table and the data in these tables does not change frequently.
Slowly Changing Dimensions
Slowly changing dimensions (SCD) are a data warehousing process in which changes in dimension tables are managed. It helps in maintaining the history as it preserves and stores the historic value. This enables accurate time-based analysis. For example, if you want to find out that the value of the field for previous year or on a specific date, you will be able to get this information by implementing the SCDs.
Commonly used SCD Types
There are three types of SCDs that are commonly used:
SCD Type 1
SCD Type 1 is used when maintaining history is not important and you only keep the latest or current value. It overwrites the old value with the new value, so no history is maintained.

As shown in the example above, the old value is updated with the new value and no historical data is maintained.
SCD Type 2
Type 2 Slowly Changing Dimension (SCD) helps to maintain history for the dimension table and retains a full historical data set the with start and end date.
The following example explains the implementation:
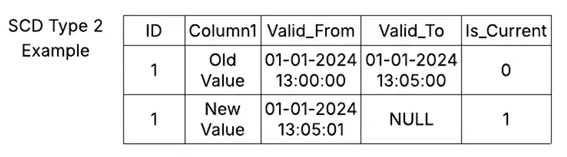
We use start date i.e. Valid_From and end date i.e. Valid_To and Is_Current columns in order to implement type 2 and to maintain changes. Valid_From and Valid_To column represents when the value was active in the data warehouse between these two date time ranges. The Is_current column with the value = 1 is the latest value for that particular row. Is_current column can be removed, but it is recommended to keep it as it will help you in your analytical queries. For example, if you want to filter only the latest records you just need to add Is_Current=1 into your SELECT statement. This will return the latest records with an optimized approach.
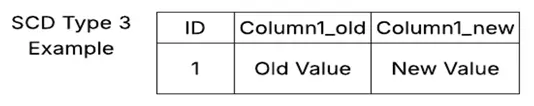
SCD Type 3
Type 3 SCD will help maintain limited history and it will only keep the previous value of that particular record as shown in the example below:
Data Warehouse Schema Types
Data Warehouses have a few different types of database schemas. Each of these database designs has pros and cons. Let’s review each.
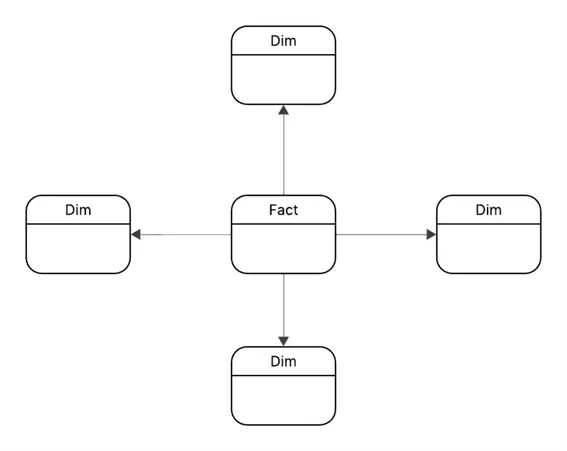
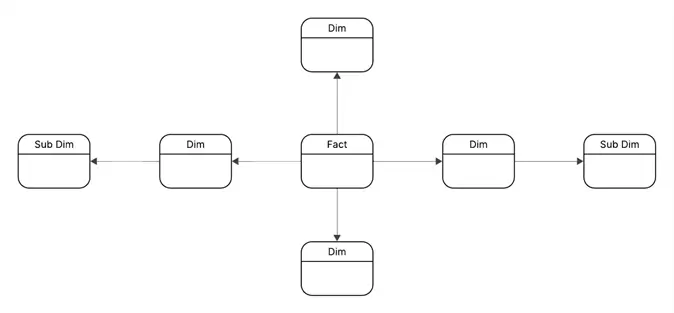
Star Schema
The Star Schema is most commonly used in data warehousing. With this design, the Fact table is connected to each dimension table. The dimension table in the star schema is denormalized as all the attributes are in single table for that dimension. As the structure is simple that means fewer join operations are required to retrieve the data which results in faster query execution.
Snowflake Schema
The Snowflake Schema is similar to star schema, but the dimension tables are further divided into sub dimensions. The dimension tables are normalized and help in reducing data redundancy. Data integrity is improved in this schema, but it becomes complex as join operation increases while retrieving data from dimension and sub dimensions. The Snowflake schema is primarily used in large data warehouses when storage optimization and data integrity are focus points.
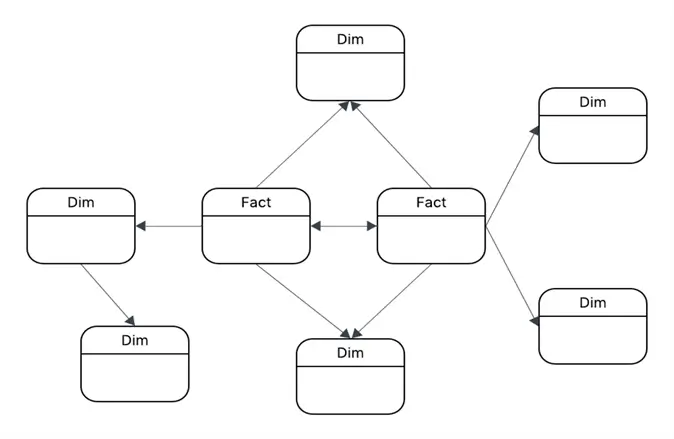
Galaxy Schema
The Galaxy Schema contains multiple fact tables that shares Dimensions. This is also known as the constellation schema. The Galaxy Schema is a complex design, but it is best when you are designing an enterprise data warehouse covering numerous subject areas and domains.
Building Star Schema in SQL Server
We are going to implement data warehouse for retail sales. The data warehouse schema is as follow:
- Fact_Sales: Central fact table storing sales transactions
- Dim_Customer: Customer details
- Dim_Product: Product details
- Dim_Date: Calendar dimension to help aggregating data or drilling down into the data at a date level
Sample Dataset Generation
--MSSQLTips.com (T-SQL)

Create database [MSSQLTipsDB];

use [MSSQLTipsDB];

-- Drop Table Statements
drop table if exists [dbo].[Fact_Sales];
drop table if exists [dbo].[Dim_Customer];
drop table if exists [dbo].[Dim_Date];
drop table if exists [dbo].[Dim_Product];

--Date Dimension
CREATE TABLE dbo.Dim_Date (
    Date_Key INT PRIMARY KEY,
    Full_Date DATE NOT NULL,
    Day INT,
    Month INT,
    MonthName VARCHAR(20),
    Quarter INT,
    Year INT
);

--Customer Dimension
CREATE TABLE dbo.Dim_Customer (
    Cust_Key INT IDENTITY(1,1) PRIMARY KEY,
    Cust_Name VARCHAR(100),
    City VARCHAR(50),
    State VARCHAR(50),
    Country VARCHAR(50),
    Cust_Type VARCHAR(20)
);

--Product Dimension
CREATE TABLE dbo.Dim_Product (
    Prod_Key INT IDENTITY(1,1) PRIMARY KEY,
    Prod_Name VARCHAR(100),
    Category VARCHAR(50),
    Sub_Category VARCHAR(50),
    Price_In_Dollar DECIMAL(10,2)
);

--Sales Fact
CREATE TABLE dbo.Fact_Sales (
    Sales_Key BIGINT IDENTITY(1,1) PRIMARY KEY,
    Date_Key INT NOT NULL FOREIGN KEY REFERENCES Dim_Date(Date_Key),
    Cust_Key INT NOT NULL FOREIGN KEY REFERENCES Dim_Customer(Cust_Key),
    Prod_Key INT NOT NULL FOREIGN KEY REFERENCES Dim_Product(Prod_Key),
    Quantity INT,
    Sales_Amount_In_Dollar DECIMAL(18,2)
);

--Data Insertion
INSERT INTO dbo.Dim_Date (Date_Key, Full_Date, Day, Month, MonthName, Quarter, Year)
VALUES
(20250101, '2025-01-01', 1, 1, 'January', 1, 2025),
(20250102, '2025-01-02', 2, 1, 'January', 1, 2025),
(20250201, '2025-02-01', 1, 2, 'February', 1, 2025),
(20250202, '2025-02-02', 2, 2, 'February', 1, 2025),
(20250301, '2025-03-01', 1, 3, 'March', 1, 2025),
(20250302, '2025-03-02', 2, 3, 'March', 1, 2025),
(20250401, '2025-04-01', 1, 4, 'April', 2, 2025),
(20250402, '2025-04-02', 2, 4, 'April', 2, 2025);

--Insert customers data
INSERT INTO dbo.Dim_Customer (Cust_Name, City, State, Country, Cust_Type)
VALUES
('Muhammad Hassan Arshad', 'Toronto', 'Ontario', 'Canada', 'Retail'),
('John', 'Sydney', 'New South Wales', 'Australia', 'Wholesale');

--Insert products data
INSERT INTO dbo.Dim_Product (Prod_Name, Category, Sub_Category, Price_In_Dollar)
VALUES
('iPhone 17', 'Electronics', 'Mobile', 1000.00),
('Apple Watch', 'Electronics', 'Appliance', 300.00);

--Insert sales data
INSERT INTO dbo.Fact_Sales (Date_Key, Cust_Key, Prod_Key, Quantity, Sales_Amount_In_Dollar)
VALUES
(20250101, 1, 1, 3, 2300.00),
(20250102, 2, 2, 4, 700.00),
(20250201, 1, 1, 3, 2200.00),
(20250202, 2, 2, 4, 600.00),
(20250301, 1, 1, 3, 2100.00),
(20250302, 2, 2, 4, 500.00),
(20250401, 1, 1, 3, 2000.00),
(20250402, 2, 2, 4, 400.00);
Performing Data Analytics on SQL Server Data Warehouse
With our sample Data Warehouse ready, we are going to run some queries which will help us in answering common business questions.
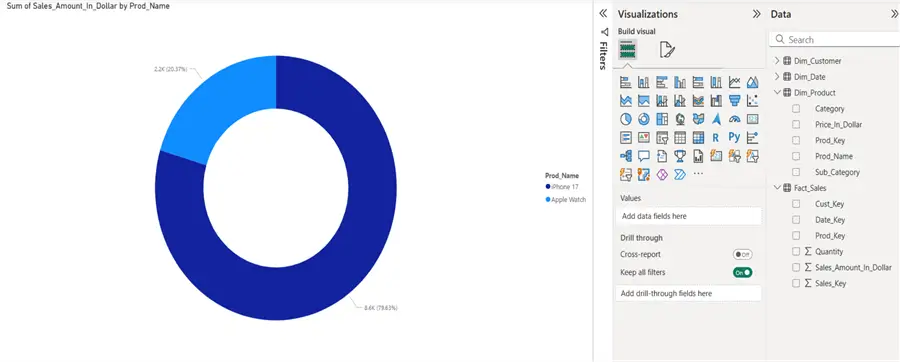
Calculating Total Sales for each product
--MSSQLTips.com (T-SQL)
SELECT P.Prod_name, SUM(F.Sales_Amount_In_Dollar) AS TotalSales
FROM dbo.Fact_Sales F
JOIN dbo.Dim_Product P ON F.Prod_Key = P.Prod_Key
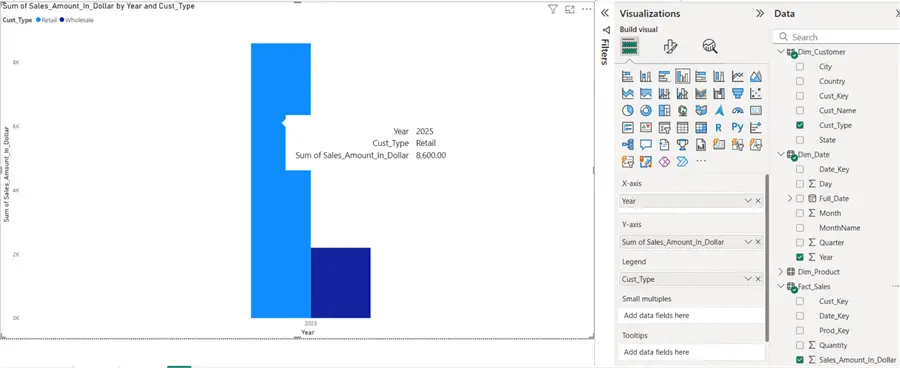
GROUP BY P.Prod_Name; Calculating Total Sales by Year and Customer Type
--MSSQLTips.com (T-SQL)

SELECT D.Year, C.Cust_Type, SUM(F.Sales_Amount_In_Dollar) AS TotalSales
FROM dbo.Fact_Sales F
JOIN dbo.Dim_Date D ON F.Date_Key = D.Date_Key
JOIN dbo.Dim_Customer C ON F.Cust_Key = C.Cust_Key
GROUP BY D.Year, C.Cust_Type;
Power BI and Data Warehouse Integration
Now we will connect Power BI to our Data Warehouse. In our Power BI report, let’s plot the above two analytical queries into a meaningful chart that will help us visualize the data. To learn how to build these reports review the following tips:
- Power BI – Download, Install and Create Your First Report
- Build Sunburst Charts in Power BI Desktop
- Clustered Column Chart and Clustered Bar Chart in Power BI Desktop
- Power BI Stacked Column and Bar Chart Step-by-Step Examples
Sunburst Graph – Total Sales by Each Product
Bar Chart – Sales by Year and Customer Type
Key Takeaways
- Companies generate vast amounts of data daily, stored in OLTP systems that focus on transactions.
- For analysis and reporting, creating a data warehouse is essential; it serves as a centralized repository optimized for analytics.
- Data warehouses consist of Fact and Dimension tables, where Fact tables contain quantitative data and Dimension tables provide context.
- Different types of fact tables include Additive, Semi-Additive, Non-Additive, Factless, and Derived Facts, each serving unique purposes.
- Star, Snowflake, and Galaxy schemas represent different design strategies for structuring a data warehouse, each with specific advantages.
Next Steps
- Create your own data warehouse and build data model in SQL Server using star schema as shown in article.
- Try running different data analytical queries, try GROUP BY, JOIN and roll up queries.
- Connect SQL Server with Power BI and import data, create meaningful charts.
- Explore and learn advance data warehousing concepts.
- Implement Galaxy and Snowflake schema.
- Explore different types of dimensions.
- Try to implement slowly changing dimensions and build logic that how we can efficiently implement SCD Type 2 when we have large volume of data and large number of columns.
- Design ETL pipeline pushing data from multiple sources to Data warehouse.

Muhammad Hassan Arshad currently works as a Principal Data Engineer at Strategic Systems International. He is a data engineering professional with over 7 years of experience in data engineering, data warehousing, and database development. He has a strong track record of building scalable data pipelines, optimizing data workflows, and developing robust database solutions to support analytics and business intelligence. Hassan holds Microsoft certifications and has worked extensively with SQL Server and modern cloud data platforms, bringing deep technical expertise and a results-driven approach to every project.