By: Fikrat Azizov | Comments (5) | Related: 1 | 2 | 3 | > Monitoring
Problem
Collecting performance data for SQL Server is critical to ensure your systems are running properly. There are several ways and tools you can use to collect and analyze the data, but in this tip series I demonstrated a home grown approach that uses several features of SQL Server to build your own performance warehouse. In these series of tips we have demonstrated the ways to build centralized, integrated and flexible data collection and analysis system. In Part 1 I demonstrated the usage of PowerShell scripts to collect performance metrics from multiple servers into central repository database and in Part 2 we built ETL packages to process this data and upload it into data warehouse. In this tip, let's checkout how to build a cube and analyze the data.
Solution
Overview
In this tip I’ll demonstrate how to build an OLAP cube based on the PerfDWH database, create jobs to process the cube and use a PivotTable report and PivotChart features of Excel to analyze the performance data. This solution was built on SSAS 2008 and could easily be upgraded to higher versions. You can download deployment package from here.
SQL Server Performance Analysis Cube Deployment
We'll use XMLA scripts to deploy the cube into an Analysis Services instance. Alternatively, it could be deployed using a SSAS project, which is included in the deployment package. Deployment steps are as follows:
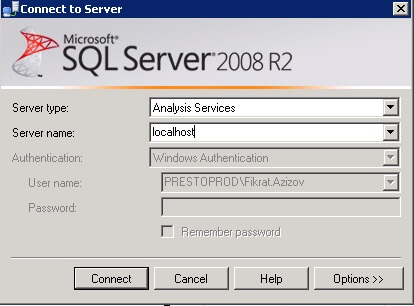
1. Start SSMS, connect to the Analysis Services instance which will host this cube:
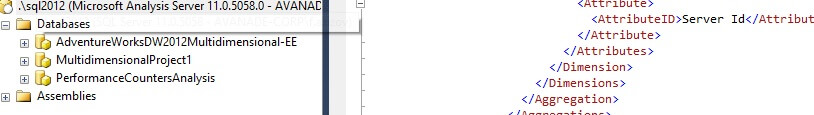
2. Click on the Analysis Services instance name, open and execute the script PerformanceCountersAnalysis_Script.xmla to create the PerformanceCountersAnalysis cube:
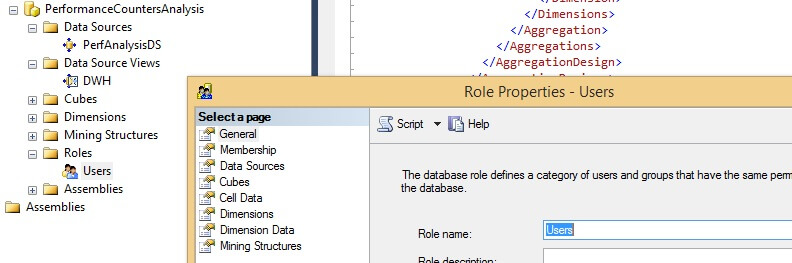
3. In Object Explorer, expand the 'Roles' nodes under 'PerformanceCountersAnalysis' and double click on 'Users':
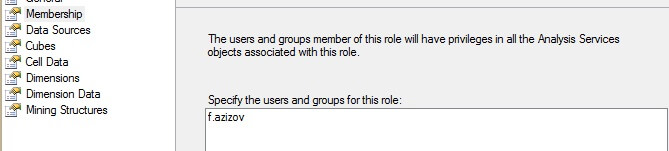
4. Open the 'Membership' tab, remove any existing orphan SID's and add users or groups that need full access to this cube. Please note that the user account which will be used for processing this cube will also need to be added to this role. If you want to grant limited access to this cube for some users, you can create another custom role with specific permissions and add those users to that role.
5. Expand the 'Data Sources' node on the object explorer and double click 'PerfAnalysisDS' to configure the data source.
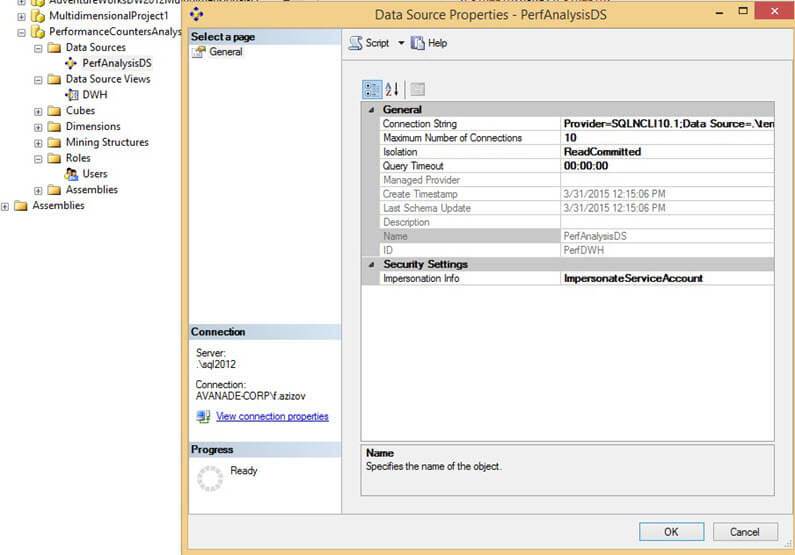
6. Select the Provider, server name and database name pointing to your PerfDWH database as shown below:
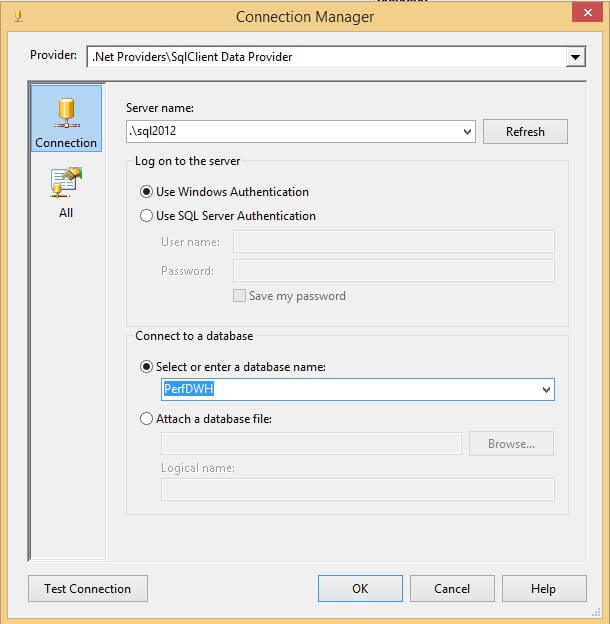
7. Test the connection and click 'OK' to confirm your selections.
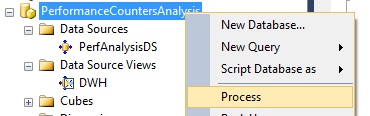
8. To test cube processing right click on the SSAS database name (PerformanceCountersAnalysis) and select 'Process':
9. On the 'Process Database-PerformanceCountersAnalysis' window click OK to start processing:
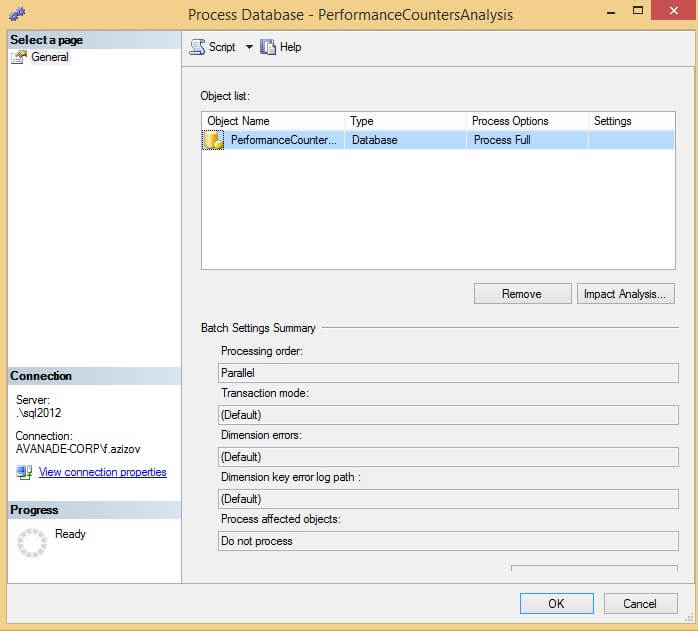
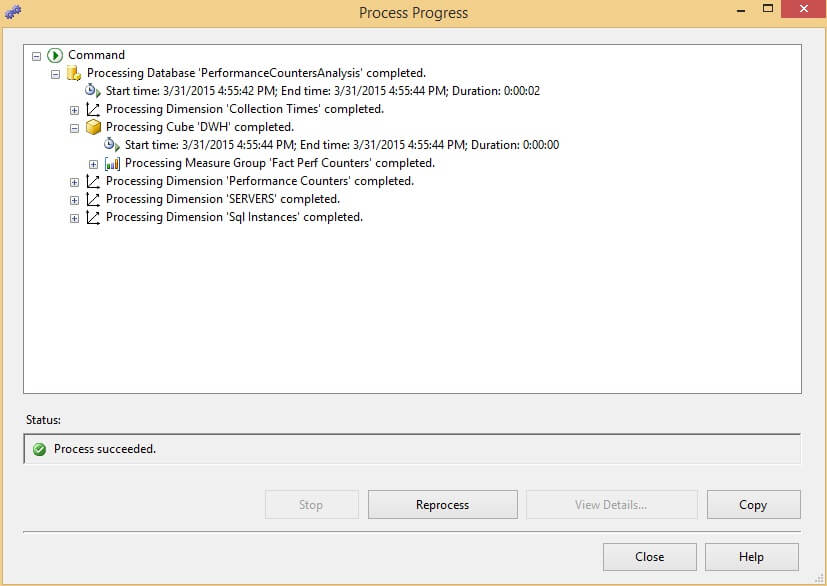
10. Make sure the cube processing finishes successfully and close the dialog window:
11. Open the CreateSecurityObjectsSSAS.sql script, specify domain name, username and password to create a credential which will be used by the cube processing jobs and execute it to create the credential and proxy accounts for SQL Server Agent. The user account will need to be member of the db_datareader role in PerfDWH database to be able to read from the data warehouse. This account will also need to be added to the cube role with full permissions (see step #6) to be able to process the cube.
12. Open
the
CreatePerfCubeProcessJobs.sql script, specify the processing frequency value for
local variable @ProcessFrequency_Min and execute it to create
the daily incremental
cube
processing jobs. The script will also create a weekly full cube processing job.
Cube internals
PerformanceCountersAnalysis cube contains a single fact table connected to 4 dimensions in a star-like schema:
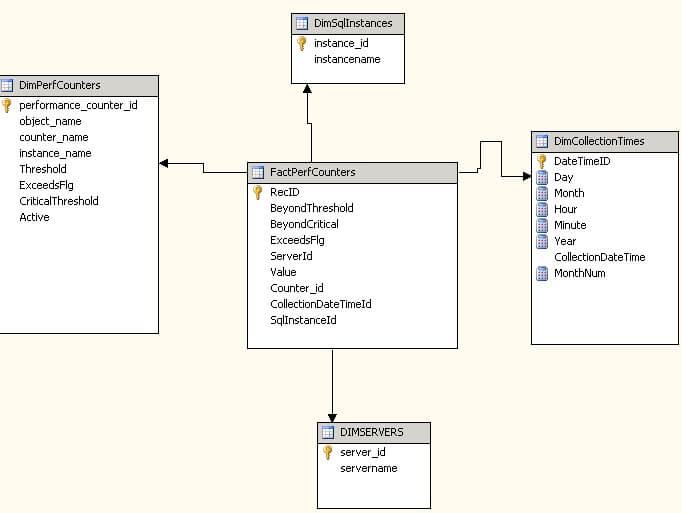
Here are short descriptions of the dimensions:
- SQL Instances – Dimension for the SQL Server instances.
- Performance Counters – Dimension for the performance counters and counter instances.
- Servers - Server names dimension.
- Collection Times - Time dimension.
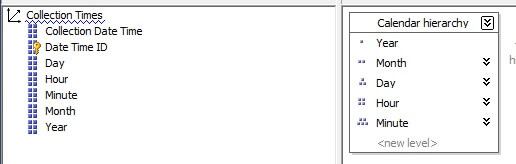
I've built a time hierarchy allowing you to slice the cube by year, month, day, hour and minute:
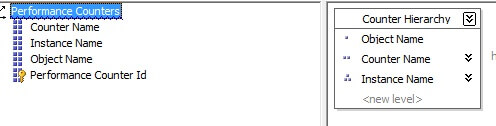
Another hierarchy has been created on the 'Performance counters' dimension,
allowing you to analyze cube on object name, counter name and instance name:
Custom cube calculations
As I mentioned in Part 1 and Part 2, the PerfCollections/PerfCounter_Groups table contains the 'Threshold' and 'Critical threshold' fields and for those metrics with non-empty values in these fields, classification would be done to see if a counter's value falls into 'normal', 'exceeding threshold' or 'exceeding critical threshold' categories. For simplicity, we'll call it 'bad' performance when performance data is between a metric's threshold and critical threshold values and we'll call it 'critical' performance when a counter value exceeds the metric's critical threshold.
Using MDX calculations I've created some additional measures, which could be useful in analyzing performance data over extended time periods, please see the list below:
- Average (by time period)
- Average for previous time period
- Average increase (change from last time period)
- Rolling average (for last 3 months)
- Increase from last 3 months (change rate compared to rolling average)
- Beyond threshold duration rate (percentage of 'bad' performance data within total time duration)
- Beyond critical duration rate (percentage of 'critical' performance data within total time duration)
Most of the cube measures have conditional formatting on fore and back color, depending on relative percentage of bad or critical performance during the analysis period, as described below:
- Fore color would be red, when critical performance lasted more than 20% of overall time period (month, day or hour)
- Fore color would be orange, when bad performance lasted more than 20% of overall time period (month, day or hour)
- Back color would be aqua, when critical performance lasted more than 70% of overall time period (month, day or hour)
- Back color would be light aqua, when bad performance lasted more than 70% of overall time period (month, day or hour)
Here are the color expressions used:
for fore color:
CASE WHEN [Beyond critical duration rate]>=0.20
 THEN 255 /*Red*/
WHEN [Beyond threshold duration rate]>=0.20
 THEN 33023 /*Orange*/
ELSE 0 /*Black*/
END
for back color:
CASE WHEN [Beyond critical duration rate]>=0.70
 THEN 16776960 /*Aqua*/
WHEN [Beyond threshold duration rate]>=0.70
 THEN 16777175 /*Light Aqua*/
ELSE 16777215 /*White*/
END
Configuring reports
The deployment package includes an Excel template file for analysis. Here are the configuration steps:
1. Copy the spreadsheet to a computer with direct access to the PerformanceCountersAnalysis cube and open it
2. Go to the Data tab and click 'Connections'
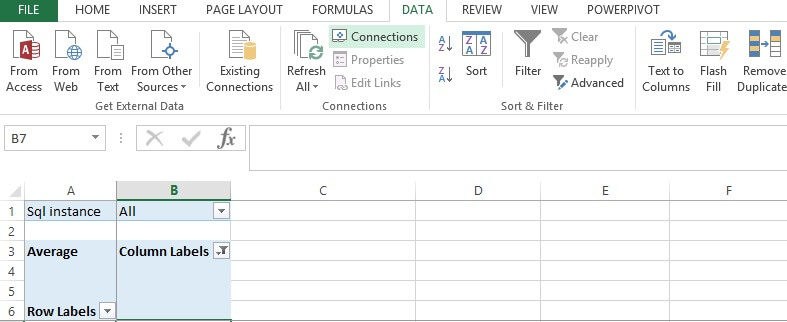
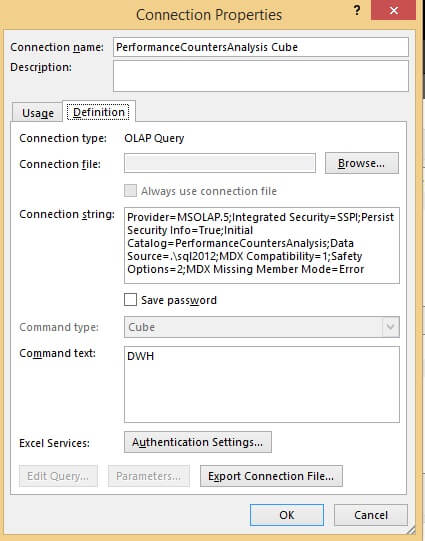
3. You'll see two connection objects in the 'Workbook Connections' window: PerformanceCountersAnalysis cube and PerfCollectionErrors:
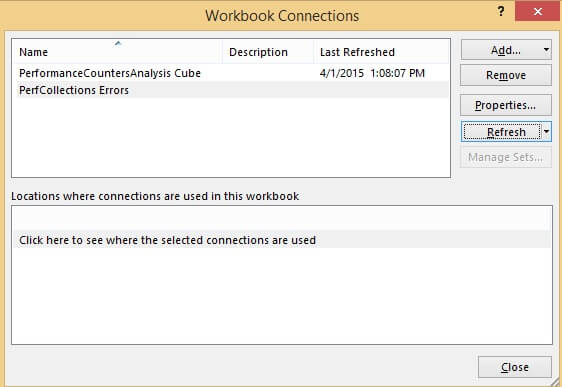
4. For each selected connection click 'Properties', then open the 'Definition' tab and enter the correct SSAS or SQL instance names accordingly:
Future development
I've included a few report templates in this spreadsheet, using a PivotTable report and PivotChart features. You can easily change configuration (filtering, rows, columns, measures, etc.) of existing sheets, as well as add new sheets to analyze the performance data from different angles. You may also find helpful the articles I've included in the 'Next Steps' section below to get familiar with Power Pivot/Power Chart features.
Another useful development would be adding alert functionality. Alerts could be sent during the performance data collection of the ETL stage, when each counter is validated against pre-configured thresholds. You could also benefit from advanced BI features if you publish these reports on SharePoint, allowing team members to see near real-time performance reports.
A few notes regarding this reporting system's performance, this cube includes a single partition and basic aggregation built on top of that. I've used this solution with two months worth of data from 5 to 6 SQL Servers and it was performing well, however with a greater number of servers and longer analysis period, users may experience slowness. This could be improved by creating new partitions on the cube based on monthly or yearly ranges, as well as creating custom aggregations.
Next Steps
- Read these tips to get familiar with Power Pivot and Power Chart features: https://www.mssqltips.com/sql-server-tip-category/114/microsoft-excel-integration/.
- Check out all of the SQL Server performance tips: Performance Tuning and Monitoring.
- Check out all of the Business Intelligence tips.


About the author
 Fikrat Azizov has been working with SQL Server since 2002 and has earned two MCSE certifications. He’s currently working as a Solutions Architect at Slalom Canada.
This author pledges the content of this article is based on professional experience and not AI generated.
View all my tips
