By: Nat Sundar | Comments (1) | Related: > Python
Problem
What is data cleansing in a Data Science project and how can this be achieved using Python?
Solution
Data Cleansing
Data cleansing is the process of identifying and correcting inaccurate records from a record set, table, or database. Data cleansing is a valuable process that helps to increase the quality of the data. As the key business decisions will be made based on the data, it is essential to have a strong data cleansing procedure is in place to deliver a good quality data.
Why Python
Python has a rich set of Pandas libraries for data analysis and manipulation that can also be used for data cleansing. In this tip, we will make use of Pandas libraries in Python for a sample data cleansing project.
Sample Dataset
The Museum of Modern Art (MoMA) is an art museum located in New York City. It is one of the largest and most influential museums of modern art in the world. The MoMA has published information about the artists here. We will make use of the Artists dataset for this tip and explore the data cleansing process. The sample Artists.csv has been downloaded and stored locally for analysis.
Pandas Data Frames
Pandas is a high-level data manipulation package in Python. It is built on the Numpy package and with a key data structure as "DataFrame". A DataFrame will allow you to store and manipulate dataset in rows and columns.
We can use Pandas read_csv() to read the data in a CSV file to a DataFrame. This DataFrame object can be used to explore and analyze data.
In the below image, I have created a new Jupyter Python notebook and keyed in the below code to read the CSV file into "dataFile" DataFrame object.
import pandas as pd
dataFile = pd.read_csv('C:\WorkAreaVM\Data Cleansing With Python\Artists.csv')
print(dataFile.shape)

After executing the script, it has been confirmed that it has created a DataFrame object with 15,501 rows and 9 columns.
Quick Preview
Let's have a quick sneak preview of the dataset using the head() function in Pandas.
dataFile.head()

It displays the first 5 records with all columns values with column names.
Displaying Top N records in Python
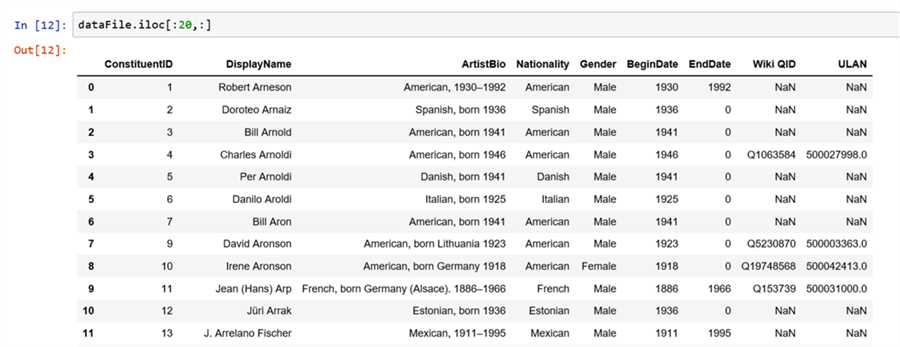
In T-SQL, we have the top n clause to get some sample records. The “Iloc” function in Pandas can be used to return top n records from a Data Frame object. It accepts the number of records and the column names as parameters.
The below expression will return the top 20 records with all columns from the Data Frame object.
The iloc[] works based on the positions of the index in the Data Frame. This means that if you give in iloc[:20,:], you look for the values of your DataFrame with the index between 0 and 20 with all columns.
dataFile.iloc[:20,:]

Deduplication
In T-SQL, there are various methods to perform deduplication. In Pandas there is a special function drop_duplicates() to remove duplicate records from a Data Frame. The below image represents the usage of this function in the sample dataset.
dataFile.drop_duplicates()

Unique Values for a Column
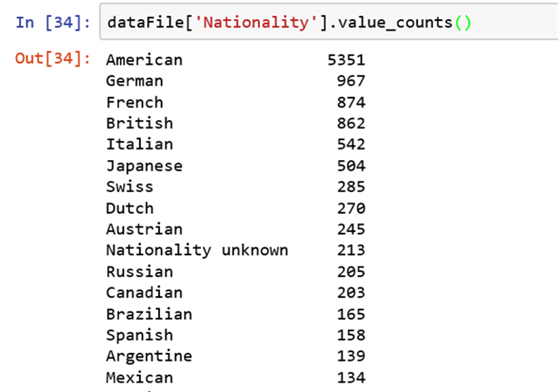
In T-SQL, unique values of a column and the count can be found using the "Distinct”, “Count" and "Group By" clauses. The same can be achieved using the Value_Counts function. The below expression will help us to list out the unique values of a column in a data frame.
dataFile['Nationality'].value_counts()

Let’s see the unique values of the column "Gender" using the below expression.
dataFile['Gender'].value_counts()

It is observed that there are records with "Male" and "male" gender. There are 9,939 records with "Male" gender and 13 records with "male" gender. Hence, to standardize the values across the data frame, the records with "male" gender can be updated to "Male".
The below expression can be used to search records with the gender "male" and in those records the column values for gender will be updated as "Male". If we get the value_counts() after the update, then we get only "Female" and "Male" gender across the data frame.
dataFile.loc[dataFile['Gender']=='male','Gender']='Male'

dataFile['Gender'].value_counts()

Displaying records with null values
In T-SQL we can use “IsNull()” to validate whether a column has null values. In Pandas we can use the IsNull() function to validate for nullable value.
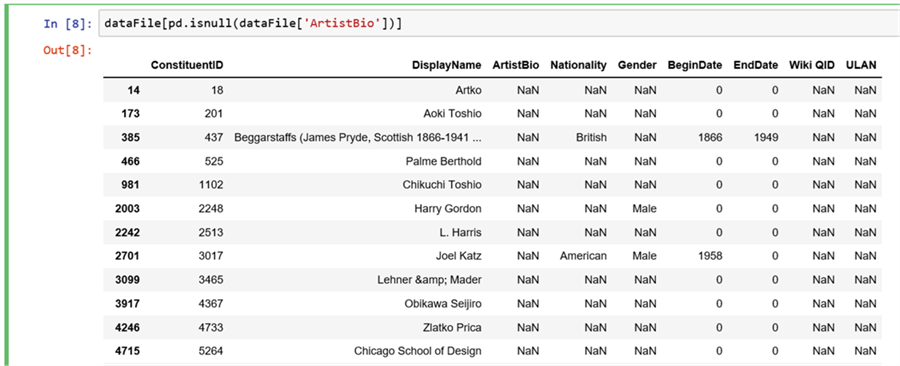
In Python a T-SQL equivalent of "NULL" is "NaN". The below mentioned expression can be used to list all the records with a null value for the "ArtistBio" column.
dataFile[pd.isnull(dataFile['ArtistBio'])]

Summary
In this tip, we are able to load a sample CSV file and analyze the data. In addition, we have also corrected some records based on simple validation checks. In the future tips, we will learn more advanced data cleansing methods using Python.
Next Steps
- Stay tuned to read the next tip on Data Science on MSSQLTips.com.
- Read and understand the different Data Science and other BI jargon here.
- Learn more about the data cleansing process here.
About the author
 Nat Sundar is working as an independent SQL BI consultant in the UK with a Bachelors Degree in Engineering.
This author pledges the content of this article is based on professional experience and not AI generated.
View all my tips


