By: Aaron Bertrand | Comments (3) | Related: > Partitioning
Problem
A problem I’ve seen crop up from time to time is a variation on pagination – the user wants a way to split up a table (for querying or copying) into a pre-defined number of buckets (or a particular bucket size). So assuming a million distinct CustomerIDs, they want 16 roughly equal buckets, containing about 62,500 CustomerIDs each. It’s not always clear what they will do then; perhaps they have 16 threads, and they want to manually feed these buckets of 62,500 CustomerIDs to each thread. In this we'll look at how we can quickly split up the data into relatively equal size buckets.
Solution
On the surface, this sounds like a textbook use case for NTILE. NTILE is used to distribute rows as evenly as possible across a defined number of groups.
Partition SQL Server Data Using NTILE
Starting with a simple example, if I wanted to distribute the following data into four groups:
CREATE TABLE dbo.Pets(PetID int IDENTITY(1,1) PRIMARY KEY, Name sysname);

INSERT dbo.Pets(Name)
  VALUES(N'Rocky'),(N'Sam'),(N'Bo'),(N'Ida'),(N'Casper'),(N'Kirby'),(N'Terry'),(N'Lucy'),(N'Charlie');
I can use the following query with NTILE(4):
SELECT PetID, Name, Thread = NTILE(4) OVER (ORDER BY PetID)
  FROM dbo.Pets;
The results look like this, with each Thread representing a different group:
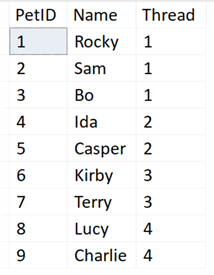
So in this case thread 1 would handle pets 1, 2, and 3; and the other three threads would handle two pets each. (Again, with a number of rows that can’t be divided evenly by the number of buckets, the distribution can’t be perfect.)
Partition SQL Server Data for a Large Table Using NTILE
Above seems like a decent solution; the problem comes when applying this to a larger table.
Let’s say we have this:
CREATE TABLE dbo.Columns
(
                                                                  ColumnID int IDENTITY(1,1),
  Name sysname,
  CONSTRAINT PK_Columns PRIMARY KEY (ColumnID)
);

INSERT dbo.Columns(Name)
SELECT c.name FROM sys.all_columns AS c CROSS JOIN sys.all_objects;
On my system, this generated a table with 23 million rows and took about a minute.
And this query below, predictably, I had to cancel after several minutes, with only a portion of the resultset having been returned:
SELECT ColumnID, Name, NTILE(20) OVER (ORDER BY ColumnID)
  FROM dbo.Columns;
Of course, we don’t need all the rows right now; we’re just trying to find the boundary points (where does thread 1 start and end, where does thread 2 start and end, and so on). But even the query below, which only returns 20 rows, takes over a minute, and this can be much longer if the table is larger, can’t fit in memory, resides on slow disk, or any combination:
;WITH x AS
(
  SELECT ColumnID, Name, Thread = NTILE(20) OVER (ORDER BY ColumnID)
    FROM dbo.Columns
)
SELECT Thread, ThreadStart = MIN(ColumnID), ThreadEnd = MAX(ColumnID)
  FROM x
  GROUP BY Thread
    ORDER BY Thread;
Faster Way to Partition SQL Server Data for a Large Table
How else can we get this data? From the histogram.
Starting with SQL Server 2016 SP1 CU2, there is a dynamic management function called sys.dm_db_stats_histogram, which returns the boundaries for the steps in a histogram. These boundaries could be used to distribute the rows across threads in much the same way NTILE() can.
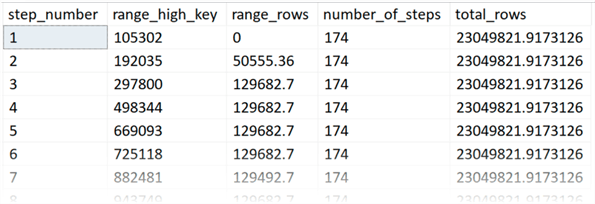
First, let’s look at abbreviated output of sys.dm_db_stats_histogram:
SELECT
  step_number,
  range_high_key,
  range_rows,
  number_of_steps = COUNT(*) OVER(),
  total_rows = SUM(range_rows) OVER()
INTO #dbcc
FROM sys.dm_db_stats_histogram(OBJECT_ID(N'dbo.Columns'),1);
Results (again, yours may vary, I had 174 steps in my histogram):
If you are on an older version of SQL Server, you can revert to DBCC SHOW_STATISTICS, but it is a bit more cumbersome (and note that the results may vary slightly):
CREATE TABLE #dbcc
(
  range_high_key      bigint,
  range_rows          decimal(18,2),
  equal_rows          bigint,
  distinct_range_rows bigint,
  avg_range_rows      decimal(18,9)
);
INSERT #dbcc
  EXEC sys.sp_executesql N'DBCC SHOW_STATISTICS(N''dbo.Columns'', N''PK_Columns'')
                           WITH HISTOGRAM, NO_INFOMSGS;';
SELECT
  step_number = ROW_NUMBER() OVER (ORDER BY range_high_key),
  range_high_key,
  range_rows,
  number_of_steps = COUNT(*) OVER(),
  total_rows = SUM(range_rows) OVER()
FROM #dbcc;
In either case, once #dbcc is populated, you could use that data to get an idea of your distribution. We can start by dividing it into 16 threads:
SELECT *, Thread = NTILE(16) OVER (ORDER BY range_high_key) FROM #dbcc;
Results:
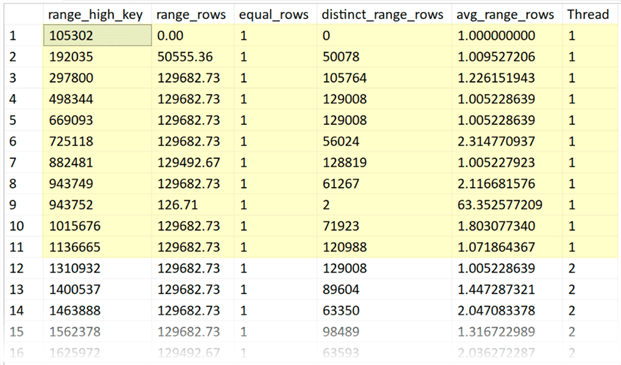
Here we can see that thread 1 above got 11 rows, but not all threads did, for example, thread 16 has 10:
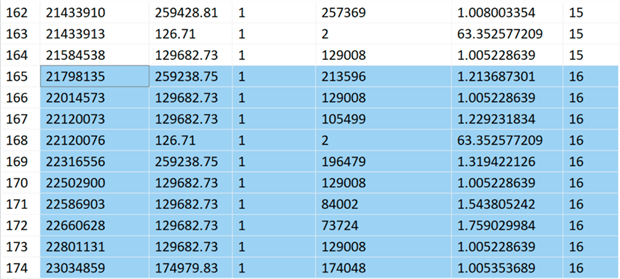
Still, this is good enough for distribution. We can collapse these rows by determining where each thread ends, and adding one to the end of the previous thread.
;WITH x AS
(
  SELECT *, Thread = NTILE(16) OVER (ORDER BY range_high_key) FROM #dbcc
),
y AS
(
  SELECT *, prn = ROW_NUMBER() OVER (PARTITION BY Thread ORDER BY range_high_key)
  FROM x
)
SELECT
  Thread,
  [RangeStart (>=)] = COALESCE(LAG(range_high_key,1) OVER (ORDER BY prn),0)+1,
  [RangeEnd (<=)]   = range_high_key
FROM y
WHERE prn = 1
ORDER BY Thread;
The results are as follows, and could easily be used to build WHERE clauses for whatever processes are handling their share of the distributed work:
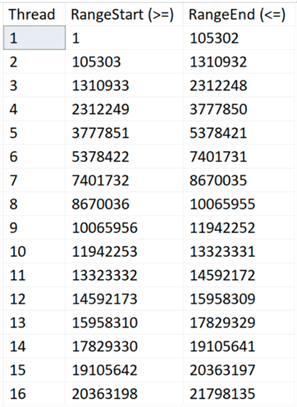
Note that if this table is actively being inserted to, and the key column is one that is ever-increasing, you may want to just ignore the RangeEnd value on the last thread, otherwise you will miss any new rows that have been inserted since the statistics were last updated.
Instead of a #temp table, you could use a permanent table to store this information. You can also avoid the #temp table altogether and just replace that with the query against the DMF if you’re on a new enough version:
;WITH x AS
(
  SELECT *, Thread = NTILE(16) OVER (ORDER BY range_high_key)
  FROM
  (
    SELECT
      step_number,
      range_high_key = CONVERT(bigint, range_high_key),
      range_rows,
      number_of_steps = COUNT(*) OVER(),
      total_rows = SUM(range_rows) OVER()
    FROM sys.dm_db_stats_histogram(OBJECT_ID(N'dbo.Columns'),1)
  ) AS x
),
y AS
(
  SELECT *, prn = ROW_NUMBER() OVER (PARTITION BY Thread ORDER BY range_high_key)
  FROM x
)
SELECT
  Thread,
  [RangeStart (>=)] = COALESCE(LAG(range_high_key,1) OVER (ORDER BY prn),0)+1,
  [RangeEnd (<=)]   = range_high_key
FROM y
WHERE prn = 1
ORDER BY Thread;
I’ve bolded one change I had to make in this case – range_high_key is a SQL_VARIANT, so you have to explicitly convert it first.
Summary
This is just one approach to writing efficient queries to determine how to break rows into relatively equal distribution. Keep in mind that it is only as accurate as your current statistics, so make sure you have some kind of routine in place to keep your stats up to date.
Next Steps
Read on for related tips and other resources:
- How To Interpret SQL Server DBCC SHOW_STATISTICS Output
- How to Identify Useful SQL Server Table Statistics
- Overview of Database Engine Changes in SQL Server 2017
- Automate Out of Date SQL Server Statistics with PowerShell
- All SQL Server Partitioning Tips
About the author
 Aaron Bertrand (@AaronBertrand) is a passionate technologist with industry experience dating back to Classic ASP and SQL Server 6.5. He is editor-in-chief of the performance-related blog, SQLPerformance.com, and also blogs at sqlblog.org.
This author pledges the content of this article is based on professional experience and not AI generated.
View all my tips


