By: Rick Dobson | Comments (4) | Related: > TSQL
Problem
I seek a framework for evaluating how exponential moving averages with different period lengths are associated with their underlying time series values. Briefly review T-SQL code for computing exponential moving averages. Also, present T-SQL code to identify the start and end of a pattern among different exponential moving averages. Finally, demonstrate how to quantitatively assess the correspondence between exponential moving average patterns and their underlying time series values.
Solution
Do you administer data that changes over time? Are you a member of a team responsible for or just interested in modeling data changes over time? If your answer is yes to either of these questions, this tip may contain help you need.
This tip shows how to identify a pattern among a set of exponential moving averages and then evaluate the association of that pattern to changes in the underlying time series values. For example, you will learn to evaluate if rising moving averages signal the emergence of an uptrend or a reversal in the direction of change. Additionally, the rules for detecting a pattern in this tip are easy to code so that you can readily change the pattern among moving averages that you evaluate relative to changes in their underlying values.
While this tip examines daily stock price changes for demonstration purposes, you can substitute any set of data that change over time. The same kinds of data mining guidelines apply to moving averages for sales by product line, rainfall by city, or confirmed cases and deaths from different viruses across different countries.
The sample data for this tip
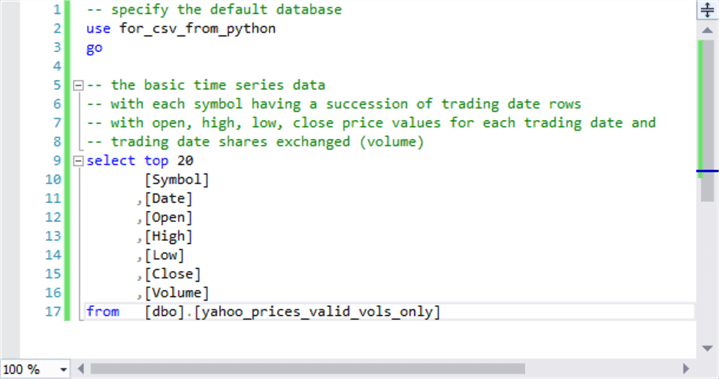
The following pair of screen shots shows some code for extracting a segment of time series data from the underlying data source for this tip. The data source is the yahoo_prices_valid_vols_only table in the for_csv_from_python database. This data was initially created and described in this prior tip, which, in turn, references an earlier tip on harvesting historical stock market data via a Python script.
- The source data contains over fourteen million rows, but the top 20 clause before the select list items restricts the output to the first twenty rows.
- Each row is unique by its combination of symbol and date column values.
- The underlying value used in this tip for exponential moving averages is close price for symbol by date.
- Volume column values are used for filtering which symbols will participate in analyses performed in this tip.
- The results set in the panel below the script shows the column values for the top 20 rows. The source table does not have primary keys determining an implied sort order for rows.
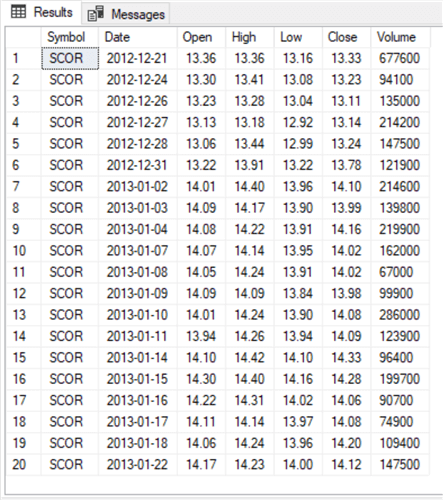
There are over 8000 distinct symbols in the yahoo_prices_valid_vols_only table. There are also 2709 distinct trading dates. Many symbols do not trade on each possible trading date, and beyond that some symbols do not trade in ample volume to provide a liquid market for exchanging shares. This tip’s script download file includes T-SQL code for deriving vital statistics regarding the symbols, trading dates, and average daily volumes by symbol for data from the yahoo_prices_valid_vols_only table. These simple queries are integrated into the following script that selects the top twenty most winning symbols in terms of close price change. Each symbol has an average daily volume of 250000 shares or more from the first through the last trading date.
-- this code picks the top 20 winners among
-- stocks with a fast overall growth rate
-- that are also liquid (with average daily volumes of 250000 or more)

-- percent change from first close through last close for
-- symbols with trades for every trading date
-- and an average volume of 250000 or more per trade date
select
top 20
first_closes.symbol
,first_closes.first_close
,last_closes.last_close
,((last_closes.last_close/first_closes.first_close)-1)*100 percent_change
from
(
   -- first_close for 1585 symbols
   -- with a close price on every trading date
   -- and avg vol >= 250000
   select symbol, date, [close] first_close
   from dbo.yahoo_prices_valid_vols_only
   where
   Date = '2009-01-02'
   and symbol in
   (
      -- 1585 symbols have a close price on every trading date
      -- and avg vol >= 250000
      select symbol
      from dbo.yahoo_prices_valid_vols_only
      group by symbol
      having
      count([close]) = 2709
      and avg(volume) >= 250000
   )
) first_closes

inner join

(
   -- last_close for 1585 symbols
   -- with a close price on every trading date
   -- and avg vol >= 250000
   select symbol, date, [close] last_close
   from dbo.yahoo_prices_valid_vols_only
   where
   Date = '2019-10-07'
   and symbol in
   (
      -- 1585 symbols have a close price on every trading date
      -- and avg vol >= 250000
      select symbol
      from dbo.yahoo_prices_valid_vols_only
      group by symbol
      having
      count([close]) = 2709
      and avg(volume) >= 250000
   )
) last_closes

on first_closes.Symbol = last_closes.Symbol

order by ((last_closes.last_close/first_closes.first_close)-1)*100 desc
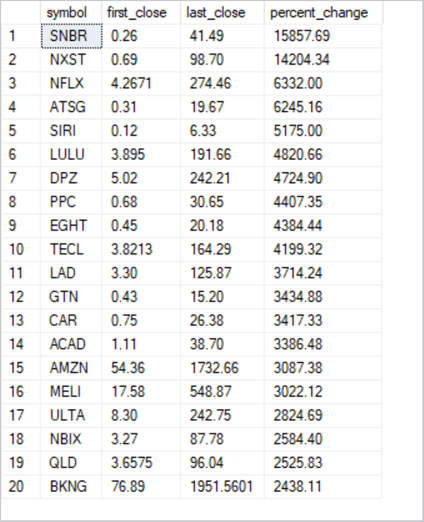
Here’s the result set from the preceding script. The raw time series data for each of these twenty symbols is available as a download file for this tip. The remainder of this tip shows how to evaluate the correspondence between exponential moving average patterns and their underlying close prices. The analysis is for two subsets – one for symbols with an odd row number and the other for symbols with an even row number. If you choose, you can use the code from this tip with time series values for symbols in the data download file not reported on in this tip.
Here are some highlights from the output displayed in the results set.
- The percent change in close prices varies dramatically from over fifteen thousand to over twenty-four hundred.
- These exceptionally large percent change values result from at least three
considerations.
- The data are for a relatively long span of trading dates starting on January 2, 2009 and running through October 7, 2019.
- Many of the initial close prices were exceedingly low because they were very early in the history of a stock, such as just twenty-six cents per share for the SNBR symbol on January 2, 2009.
- The results are for the top twenty symbols from over eight thousand symbols in the source data. The vast majority of the symbols from the full data source do not exhibit the same exceptional percent changes in close price as those listed in the following table.
Creating a table of exponential moving averages with close, symbol, and date values
Now that we have the symbols for the analyses demonstrated in this tip, we need exponential moving averages for the close price values. Data mining can be tapped to develop an understanding of how exponential moving average patterns relate to their underlying close price values.
Any set of underlying time series values can have multiple exponential moving averages. For example, a ten-period exponential moving average will typically have different values than a thirty-period moving average for the same set of underlying values. This tip uses four exponential moving averages with different period lengths of ten, thirty, fifty, and two hundred. This preceding tip (Computing, Saving, and Retrieving Exponential Moving Averages) drills down on how to compute exponential moving averages with different period lengths. Especially examine the tip for a pair of stored procedures that computes exponential moving averages; the stored procedure names are usp_ema_computer and insert_computed_emas.
- The usp_ema_computer stored procedure returns a set of exponential moving
average values based on three inputs:
- A stock symbol
- A period length
- An alpha value, which is based on the period length, to compute the successive exponential moving average values.
- The insert_computed_emas stored procedure invokes the usp_ema_computer stored procedure seven times – once for each of seven different period lengths. Each invocation of the insert_computed_emas stored procedure accepts a @symbol parameter. The stored procedure uses its input parameter to populate the date_symbol_close_period_length_ema table with exponential moving averages having different period lengths.
- The following script shows how the two stored procedures are used in this
tip to populate the date_symbol_close_period_length_ema table.
- The script starts by creating a fresh version of the table.
- The insert_computed_emas stored procedure is invoked twenty times for
the symbols at the end of the preceding section:
- Ten times for symbols with odd row numbers
- Ten more times for symbols with even row numbers
- The block of code after the exec statements for the insert_computed_emas stored procedure assigns a primary key to the date_symbol_close_period_length_ema table based on the symbol and date columns. By assigning the primary key after populating the table, the inserts operate faster.
-- create a fresh copy of a table to store
-- underlying values and exponential moving averages
-- with different period lengths
begin try
   drop table [dbo].[date_symbol_close_period_length_ema]
end try
begin catch
   print '[dbo].[date_symbol_close_period_length_ema] is not available to drop'
end catch

create table [dbo].[date_symbol_close_period_length_ema](
   [date] [date] NOT NULL,
   [symbol] [nvarchar](10) NOT NULL,
   [close] [money] NULL,
   [period length] [float] NOT NULL,
   [ema] [money] NULL
)
go

-- run stored procs to save computed emas for first ten odd symbols
exec dbo.insert_computed_emas 'SNBR'
exec dbo.insert_computed_emas 'NFLX'
exec dbo.insert_computed_emas 'SIRI'
exec dbo.insert_computed_emas 'DPZ'
exec dbo.insert_computed_emas 'EGHT'
exec dbo.insert_computed_emas 'LAD'
exec dbo.insert_computed_emas 'CAR'
exec dbo.insert_computed_emas 'AMZN'
exec dbo.insert_computed_emas 'ULTA'
exec dbo.insert_computed_emas 'QLD'

-- run stored procs to save computed emas for first ten even symbols
exec dbo.insert_computed_emas 'NXST'
exec dbo.insert_computed_emas 'ATSG'
exec dbo.insert_computed_emas 'LULU'
exec dbo.insert_computed_emas 'PPC'
exec dbo.insert_computed_emas 'TECL'
exec dbo.insert_computed_emas 'GTN'
exec dbo.insert_computed_emas 'ACAD'
exec dbo.insert_computed_emas 'MELI'
exec dbo.insert_computed_emas 'NBIX'
exec dbo.insert_computed_emas 'BKNG'

-- drop any prior primary key constraint named symbol_date_period_length
-- not required if fresh version of date_symbol_close_period_length_ema table
-- is created before populating the table
begin try
alter table [dbo].[date_symbol_close_period_length_ema]
  drop constraint [symbol_date_period_length]
end try
begin catch
  print 'primary key not available to drop'
end catch

-- add a constraint to facilitate retrieving saved emas
alter table [dbo].[date_symbol_close_period_length_ema]
  add constraint symbol_date_period_length
    primary key (symbol, date, [period length]);
At the end of the script, you’ll have ten-period, thirty-period, fifty-period, and two-hundred period exponential moving averages for the twenty symbols in the date_symbol_close_period_length_ema table. You will also have exponential moving averages with three additional period lengths because the insert_computed_emas stored procedure computes by default exponential moving averages for seven period lengths. If desired, you can edit the insert_computed_emas stored procedure to remove the usp_ema_computer procedure calls for the exponential moving averages that are not required by this tip (or for whatever other application you are implementing).
When the ten-period moving average is greater than the thirty-period moving average, and the thirty-period moving average is greater than the fifty-period moving average, and the fifty-period moving average is greater two-hundred-period moving average, then the moving averages demonstrate upward momentum. This is because moving averages with a shorter period are consistently larger than those with a longer period length. This tip calls this relation an uptrending pattern because moving averages for more recent periods have a larger average close price than moving averages based on less recent periods.
Comparing close price percent changes to Uptrends for exponential moving averages
A major objective of this tip is to demonstrate a framework for assessing if during times when exponential moving averages are uptrending close prices also grow. The data mining approach taken to quantify the relationship has three steps.
- The first step is to create a table with sequential date values for successive
trading dates. The table should contain both exponential moving averages
and close price metrics.
- In addition to just containing exponential moving averages with different
period lengths, the table must also indicate whether the moving averages
are uptrending or not uptrending. Recall that
- Uptrending is when three conditions are concurrently true
- the ten-period moving average is greater than the thirty-period moving average
- the thirty-period moving average is greater than the fifty-period moving average
- the fifty-period moving average is greater than the two-hundred-period moving average
- Not uptrending is when any of the above three conditions is not true
- Uptrending is when three conditions are concurrently true
- In addition to just containing exponential moving averages with different
period lengths, the table must also indicate whether the moving averages
are uptrending or not uptrending. Recall that
- Based on the definitions for uptrending and not uptrending, the table categorizes
each period in one of seven trending_status categories
- start uptrend – current period is uptrending, but prior period is not uptrending
- in uptrend – current period is uptrending, and prior period is also uptrending
- end uptrend -- current period is uptrending, prior period is uptrending, and next period is not uptrending
- start not uptrend – current period is not uptrending, but prior period is uptrending
- in not uptrend – current period is not uptrending, and prior period is not uptrending
- end not uptrend – current period is not uptrending, prior period is not uptrending, and next period is uptrending
- end of time series – next time period has a null value for whether it is uptrending or it is not uptrending
- The second step derives a new results set based on the rules for assigning dates to one of seven trending_status categories. The new results set retains only periods with a trending_status value of either start uptrend or start not uptrend. The rows for the retained periods additionally gain two new columns from case statements: one column is named close_change and the other column is named close_change_percent. This results set is stored in a local temp table for use by the third step.
- The third step filters the local temp table from the second step to display one row per block from start uptrend through start end uptrend. This filtered results set also displays close_change and close_change_percent for each cycle extending from start uptrend through start not uptrend.
The code for the first step is implemented in two parts. Here’s the code for the first part of the first step.
- It analyzes its data for one symbol at a time. The assignment of SNBR to the @symbol local variable indicates the sample code is for the SNBR symbol. Change the value assigned to @symbol for other stock symbols.
- The results set from the main query in the script is saved in a local temp table named #for_@symbol_tests.
- This table contains columns for symbol, date, close, ema_10, ema_30, ema_50,
and ema_200 as well as a new column named all_uptrending_emas.
- The columns from symbol through ema_200 are from the date_symbol_close_period_length_ema table.
- The all_uptrending_emas column comes from a case statement that assigns
a value of
- 1 when all three uptrending conditions are true
- 0 when any of the three uptrending conditions is not true
-- code for the first step
-- save time series with into clause of date, close price, emas
-- and all_uptrending_emas indicator values
-- for @symbol value

declare @symbol nvarchar(10) = 'SNBR'

begin try
   drop table #for_@symbol_tests
end try
begin catch
   print '#for_@symbol_tests not available'
end catch

-- extract and join one column at a time
-- for selected emas
-- for @symbol local variable
-- add all_uptrending_emas computed field
select
 symbol_10.*
,symbol_30.ema_30
,symbol_50.ema_50
,symbol_200.ema_200
,
 case
 when
   symbol_10.ema_10 > symbol_30.ema_30
   and ema_30 > ema_50
   and ema_50 > ema_200
   then 1
 else 0
 end all_uptrending_emas

into #for_@symbol_tests
from
(
   -- extract emas with 10, 30, 50, and 200 periods
   select date, symbol, [close], ema ema_10
   from [dbo].[date_symbol_close_period_length_ema]
   where symbol = @symbol and [period length] = 10
) symbol_10

inner join

(
   select date, symbol, [close], ema ema_30
   from [dbo].[date_symbol_close_period_length_ema]
   where symbol = @symbol and [period length] = 30
) symbol_30

on symbol_10.DATE = symbol_30.DATE

inner join

(
   select date, symbol, [close], ema ema_50
   from [dbo].[date_symbol_close_period_length_ema]
   where symbol = @symbol and [period length] = 50
) symbol_50

on symbol_10.DATE = symbol_50.DATE

inner join

(
   select date, symbol, [close], ema ema_200
   from [dbo].[date_symbol_close_period_length_ema]
   where symbol = @symbol and [period length] = 200
) symbol_200

on symbol_10.DATE = symbol_200.DATE

-- display date order time series values for @symbol value
select * from #for_@symbol_tests order by date
The code for the second part of the first step processes the rows from the #for_@symbol_tests local temp table populated by the first part of the first step. Here’s the script for the second part of the first step.
- The main goal of the script is to create a new table with an additional new column named trending_status to the local temp table from the first part.
- This part also excludes the first two date rows from the local temporary table because exponential moving averages cannot be computed until the third period in a time series.
- The second part of the first step populates a regular SQL Server table named close_emas_trending_status_by_date_symbol.
-- code for second part of the first step
-- drop any prior version for another symbol of table for
-- close prices, emas, trending status
begin try
   drop table dbo.close_emas_trending_status_by_date_symbol
end try
begin catch
   print 'dbo.close_emas_trending_status_by_date_symbol not available to drop'
end catch

declare @start_date date = '2009-01-02', @second_date date = '2009-01-05'

-- mark and save close prices and emas with ema trending_status
select
 symbol
,date
,[close]
,ema_10
,ema_30
,ema_50
,ema_200
,all_uptrending_emas
,case
  when date in(@start_date, @second_date) then NULL
  when all_uptrending_emas = 1 and
         lag(all_uptrending_emas,1) over(order by date) = 0
         then 'start uptrend'
   when all_uptrending_emas = 1 and
         lead(all_uptrending_emas,1) over(order by date) = 1
         then 'in uptrend'
  when all_uptrending_emas = 1 and
         lead(all_uptrending_emas,1) over(order by date) = 0
         then 'end uptrend'
  when all_uptrending_emas = 0 and
         lag(all_uptrending_emas,1) over(order by date) = 1
         then 'start not uptrend'
   when all_uptrending_emas = 0 and
         lead(all_uptrending_emas,1) over(order by date) = 0
         then 'in not uptrend'
-- two ways to end not uptrend: first, is for normal end of not uptrend and second, is for last record
   when all_uptrending_emas = 0 and
         lead(all_uptrending_emas,1) over(order by date) = 1
         then 'end not uptrend'
   when isnull(lead(all_uptrending_emas,1) over(order by date),1) = 1
         then 'end of time series'
end trending_status

into dbo.close_emas_trending_status_by_date_symbol
from #for_@symbol_tests
order by date

-- all records from second part of first step
select *
from dbo.close_emas_trending_status_by_date_symbol
where trending_status is not null
The code for the second step appears next.
- This script filters the table from the second part of the first step to include just two rows for each cycle, namely rows with a trending_status value of either start uptrend or start not uptrend.
- It also adds two new columns – close_change and close_change_percent
-- for each cycle of rows. The values for the new columns are defined
only at the end of a cycle.
- The new columns have null values for the first row in each cycle.
- On the other hand, the new columns describe close price changes for each cycle in their second row.
- The results set for the script is saved in the #close_change_for_buy_and_sell_dates local temp table.
-- code for the second step
-- display start and end dates of all blocks based on start uptrend
-- and start not uptrend trending status values from
-- the close_emas_trending_status_by_date_symbol table
-- also add two new columns for close_change and close_change_percent

begin try
   drop table #close_change_for_buy_and_sell_dates
end try
begin catch
   print '#close_change_for_buy_and_sell_dates not available to drop'
end catch

select
 symbol
,for_buy_sell_test.[date]
,for_buy_sell_test.[close]
,ema_10
,ema_30
,ema_50
,ema_200
,trending_status
,
case
   when trending_status = 'start not uptrend' then
   (
   [close] - lag([close],1) over(order by date)
   )

end close_change
,
round(
case
   when trending_status = 'start not uptrend' then
   (
   [close] - lag([close],1) over(order by date)
   )
end/[close]*100,2) close_change_percent
into #close_change_for_buy_and_sell_dates
from
(
   -- start and end dates of all blocks
   select *
   from dbo.close_emas_trending_status_by_date_symbol
   where
   (trending_status is not null and left(trending_status,5) = 'start')
   or
   (trending_status is not null and left(trending_status,3) = 'end')
) for_buy_sell_test
where
trending_status in('start uptrend', 'start not uptrend')

-- all records from second step
select * from #close_change_for_buy_and_sell_dates
The code for the third step appears next. It simply removes the rows with null column values from the #close_change_for_buy_and_sell_dates local temp table. The third step also removes the trending_status column. The select statement for the third step returns a results set with one row per cycle. Each cycle is for a transition from start uptrend through start not uptrend.
-- code for the third step
select
 symbol
,date
,[close]
,ema_10
,ema_30
,ema_50
,ema_200
,close_change
,close_change_percent
from #close_change_for_buy_and_sell_dates
where close_change is not null
Summary results sets from start-of-uptrend through start-of-not-uptrend cycles
Close prices can rise, fall, or remain unchanged over a succession of trading dates. Also, uptrending among exponential moving averages can come and go. This tip presents T-SQL code for implementing a framework that assesses the relationship between uptrending in exponential moving averages and changes in close prices. From a more general perspective, this tip provides a framework for tracking changes between two metrics over time. For example, you can use the approach described in this tip to answer the question: do automobile sales decrease with rising unemployment?
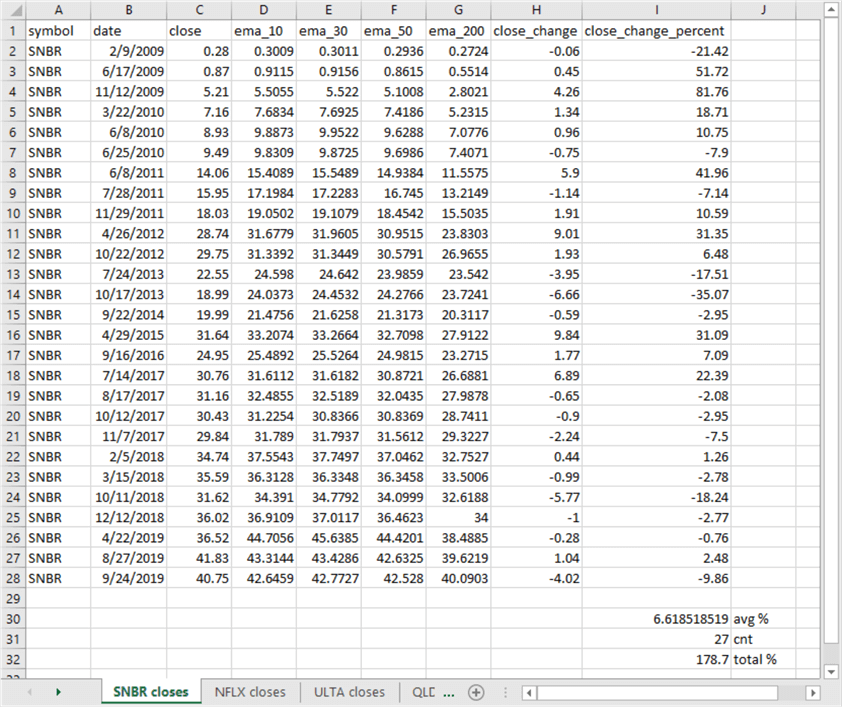
This tip presents three processing steps for assessing changes in stock prices relative to uptrending in moving averages. The processing steps are for one symbol at a time. The following display shows the results from the third step in SQL Server copied to an Excel worksheet for the SNBR symbol.
- The date column shows the end date for each cycle from the start of an uptrend through the start of a not uptrend period for exponential moving averages.
- Because the dates are from a start uptrend period to the start of a not
uptrend period, no row confirms an uptrend.
- For example, in row 3 the ten-period moving average is less than the thirty-period moving average.
- However, you can see that the moving averages in row 3 for all period lengths are far greater than the corresponding moving averages in row 2. There is definite upward momentum from row 2 through row 3 for the moving averages.
- In coordination with the large gain in row 3 moving averages relative to row 2 moving averages, the close change percent grew by more than fifty percent.
- The same kind of relationship is evident in the comparison of row 4 to row 3. However, the close change percent for row 4 is even greater -- at beyond eighty percent.
- There are 27 start-uptrend-to-start-not-uptrend cycles for the SNBR symbol. Across these 27 cycles, the average total close change percent gain is 178.7 percent (6.618518519 times 27).
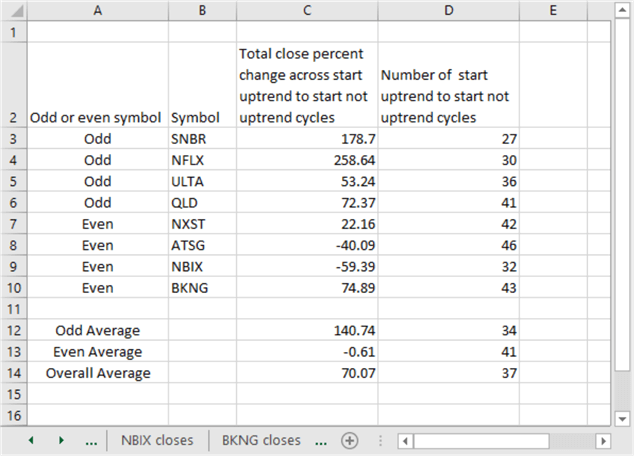
The same framework was applied to seven additional symbols from the table of the top twenty symbols in the "The sample data for this tip" section. The summary results for all eight symbols appear below. The results generally support the conclusion that uptrending moving averages are associated with positive close change percent values.
- This finding was supported for six of the eight symbols.
- Furthermore, the average close change percent across all eight symbols is over seventy percent.
This tip does not aim to explore the nuances of the relationship between uptrending for exponential moving averages for close prices and close change percent across sets of trading dates. Rather its aim is to present a framework that empowers you to assess relationships for your own time series data. A future tip will build on the results presented here and illustrate a trading model that utilizes transitions for exponential moving average trends to project when to buy and sell stocks in search of achieving better close price gains. You should also keep in mind that the approach used for estimating when to buy and sell stocks for a profit also apply to other domains, such as if sales for product lines are likely to increase with income within a region or if rain within a region is likely to increase if rain occurs previously in a region to the west or south in the previous day.
Next Steps
There are at least four next steps for this tip.
- Review the framework description and the code to make sure you understand the details.
- Run the framework with the sample data illustrated in the tip to confirm you can duplicate the results.
- Try running the framework with some additional symbols beyond those presented in the tip to confirm your understanding of the data management steps as well as the robustness of the framework outcomes across a wider set of symbols than those demonstrated in the tip.
- Adapt the framework code to your organization’s time series data to assess correspondences between exponential moving averages and their underlying values.
The download available with this tip includes three files to help you perform the next steps described above. Here’s a brief description of each file in the download.
- "data mining with emas.sql" contains all the T-SQL code presented in this tip.
- "time series ohlcv top 20 symbols for data mining tip.csv" contains all the open, high, low, close and volume time series data for the top 20 symbols presented at the end of the "The sample data for this tip" section. This file contains the raw time series data for the eight symbols described in this tip along with raw time series data for twelve additional symbols.
- "datamining_emas_and_their_underlying_values.xlsx" is an Excel workbook file. You can use it as an example to layout your own results with any of the twelve additional symbols as well as with time series from your own organization.
About the author
 Rick Dobson is an author and an individual trader. He is also a SQL Server professional with decades of T-SQL experience that includes authoring books, running a national seminar practice, working for businesses on finance and healthcare development projects, and serving as a regular contributor to MSSQLTips.com. He has been growing his Python skills for more than the past half decade -- especially for data visualization and ETL tasks with JSON and CSV files. His most recent professional passions include financial time series data and analyses, AI models, and statistics. He believes the proper application of these skills can help traders and investors to make more profitable decisions.
This author pledges the content of this article is based on professional experience and not AI generated.
View all my tips


