By: Rick Dobson | Comments | Related: > TSQL
Problem
Please present some process and code for collecting time series data from the internet for insertion into SQL Server. Also, reveal how to add new time series data from the internet to an existing set of time series data in SQL Server. Additionally, show one approach to collecting data via Python from the internet and exporting the data from Python to csv files for easy insertion into SQL Server.
Solution
Time series data (from the internet and other sources) are becoming an increasingly frequent type of data for SQL Server professionals to encounter. Time series data are defined by the association of data values with time periods, such as days or weeks. For example, a meteorologist may want to track daily temperature and amount of rainfall from weather stations across the country or globe. A manufacturing company may track daily inventory, new orders, and orders shipped by product over the past ten years. Investment analysts and traders may track security prices by high, low, open, and close prices along with volume of shares exchanged on each day a market is open.
This tip uses Python with security price data from Yahoo Finance, because Python has an easy-to-use interface for extracting security prices on sequential trading days. You can learn more about how to collect data from the internet with Python through these prior MSSQLTips demonstrations (here, here, and here). This tip goes beyond prior ones in that it focuses on extracting data with Python via csv files.
When managing any kind of time series data there are at least three common tasks. This tip gives you a simple demonstration for each of these tasks.
- You can start managing time series data by populating a table with a set of time-based data for a set of items.
- After you initially populate a time series database, you may grow the number of items tracked.
- You may also very likely need to append fresh data for more recent time periods.
A process for collecting and setting up an initial set of time series dataset
Before you can set up a time series dataset, you need to collect the data. You may collect the data from your company's transactional or data warehouse databases. You can also use a public internet-based source. You must associate one or more measurements with two types of values: a time period and an item identifier.
The simple demonstration for this section collects time series data for a set of stock symbols from the MSSQLTips_4.txt file. Here's a view of the file from a Notepad++ session.
- The four identifiers are ticker symbols for traded securities from the Yahoo Finance web site.
- For example, MSFT is the ticker symbol for the Microsoft Corporation.

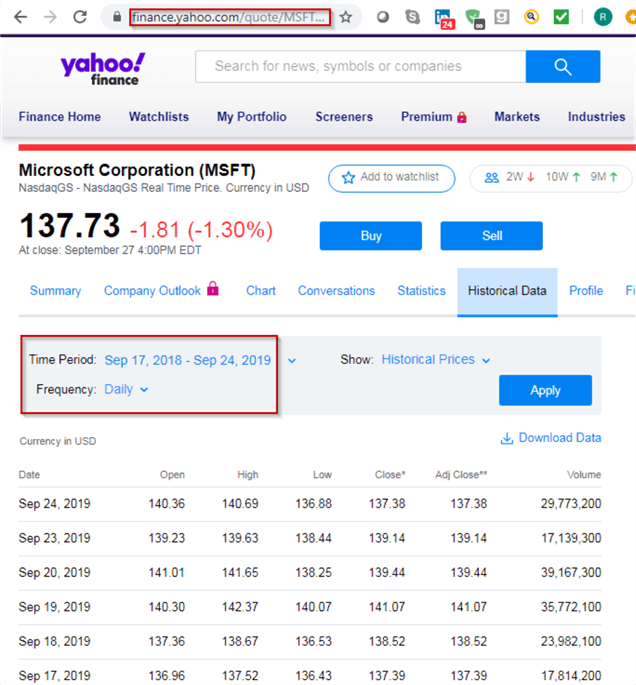
The following screen shot shows historical price and volume data from the Yahoo Finance site for the Microsoft Corporation.
- The first red box on the screen shot highlights the url for showing historical price and volume data for the Microsoft Corporation.
- The second, larger red box highlights one way of designating the date range for which to display historical price and volume data. The selected period is the eight-day interval from September 17, 2019 through September 24, 2019.
- Because stock exchanges close on weekends, there is no data for September 21 and 22, which are for Saturday and Sunday, respectively.
The following Python script is for collecting time series data for the symbols in the MSSQLTips_4.txt file from the Yahoo Finance site (finance.yahoo.com). The script was saved with a file name of read_mssqltips_4_for_export_via_csv.py. This script file can be run with the IDLE application that installs with Python version 3.6. Step-by-step instructions for installing Python are available from this prior tip. The instructions do not require any particular version of SQL Server.
Here's a summary of the operations performed by the script.
- The import statement for pandas_datareader.data imports an add-on application for Python that is especially convenient for processing spreadsheet-like or tabular data, such as the preceding screen shot. The datareader offers a means of importing data from various pubic web data sources, including Yahoo Finance. The import statement assigns an alias of web to the datareader.
- The second import statement references the built-in Python datetime module, which offers techniques for processing date and time values.
- The line that starts with "#read ticker symbols…" is
a comment line that heads a short block of code for reading ticker symbols from
the MSSQLTips_4.txt file.
- The string values are those from the MSSQLTips_4.txt file.
- The open command creates a file handler for MSSQLTips_4.tx.
- The with statement removes the need to explicitly close the file handler.
- The strip() function returns a new string with leading and trailing carriage return and line feed values removed from the source string on each line within the file.
- The cleaned line values are assigned to a Python list object named symbol.
- The start time is designated by specifying a date in Gregorian format for the beginning date in the time series data.
- The end time is designated by specifying a date in Gregorian format for the end date in the time series data.
- The path_out and file_out strings are for specifying the destination of the csv file prepared by the script.
- The script concludes with a while loop that passes through sequential ticker
values in symbol.
- The script uses the Pandas datareader method and some additional processing to extract five values for each symbol and trading date from start through end datetime values.
- The datareader method arguments designate the symbol as well as the start and end dates for which to extract values from the Yahoo Finance site, which is designated by yahoo in single quotes.
- The datareader method returns a dataframe object, which has features
like an Excel spreadsheet or a SQL Server table.
- The while loop populates the dataframe named df.
- Each successful execution of the datareader method populates the
dataframe with the time series values for a symbol.
- The insert method adds a column of values to the time series values from the Yahoo Finance site with the ticker symbol for the current pass through the while loop.
- The drop method for a dataframe excludes the Adj Close column value because it is not widely used in historical security price and volume data tracking.
- The to_csv method for the dataframe object outputs the row of values
in a csv format. The mode value for the symbol ticker determines
if there is a row header before the first row of time series values
for a symbol.
- The header row contains column names for time series data, and it appears immediately before the first row of time series data. This row corresponds to the first time series values for the first symbol in the MSSQLTips_4.txt file.
- Other symbols after the first symbol do not display a header row before their first time series values.
- The path_out+file_out expression defines the name of the destination for the csv file.
- The print method statements are for providing feedback about the operation of the reads from the Yahoo Finance site. If a read returns a value while the computer is still processing the prior read, then the while loop returns for another try at reading a fresh row of time series values. The print method reports the outcome of each read try within the IDLE environment.
#settings for importing built-in datetime and date libraries
#and external pandas_datareader libraries

import pandas_datareader.data as web
import datetime


#read ticker symbols from a file to python list object named symbol
symbol = []
with open('C:\python_programs\MSSQLTips_4.txt') as f:
    for line in f:
        symbol.append(line.strip())
f.close


#datetime is a Python module
#datetime.date is a data type within the datetime module

#the start expression is for September 17, 2019
start = datetime.date(2019,9,17)

#the end expression is for September 24, 2019
end = datetime.date(2019,9,24)

#set path name and file name for csv file
path_out = 'c:/python_programs_output/'
file_out = 'yahoo_prices_volumes_for_MSSQLTips_4_to_csv_demo.csv'

#loop through tickers in symbol list with i values of 0 through
#index number for last list item

i=0
while i<len(symbol):
    try:
        df = web.DataReader(symbol[i], 'yahoo', start, end)
        df.insert(0,'Symbol',symbol[i])
        df = df.drop(['Adj Close'], axis=1)
        if i == 0:
            df.to_csv(path_out+file_out)
            print (i, symbol[i],'has data stored to csv file')
        else:
            df.to_csv(path_out+file_out,mode = 'a',header=False)
            print (i, symbol[i],'has data stored to csv file')
    except:
        print("No information for symbol or file is open in Excel:")
        print (i,symbol[i])
        continue
    i=i+1
Historical prices and volumes are available from Yahoo Finance with a period of one day, one week, or one month. This tip focuses on how to collect daily prices and volumes after the market closes. Do not attempt to run the preceding script until after Yahoo Finance updates the price and volume data you are collecting for a symbol. I have seen different estimates of when the final end-of-day prices become available from Yahoo Finance; see here for more detail.
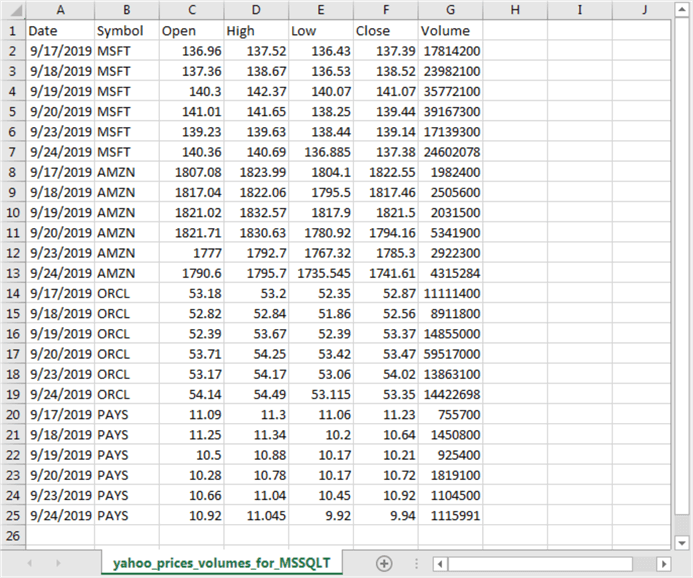
The preceding script writes the data to the yahoo_prices_volumes_for_MSSQLTips_4_to_csv_demo.csv file. The following screen shot shows the csv file from Excel after the close of the market on September 24.
- Row 1 contains the column header names.
- Rows 2 through 25 contains six rows of time series data for each symbol;
the initial collection of time series data is for four symbols.
- The first two columns (A and B) display the Date and Symbol values. Every data row in the time series is unique by date and symbol.
- The next four columns display different types of price data for a date.
- The last column displays the volume of shares traded for a ticker symbol on a trading date.
- There are eight calendar days from September 24 through September 17. However, there are six time series sets of value types for each symbol because markets close on weekend days.
- You can confirm the collected prices from the csv file by comparing them to the prices from the Yahoo Finance site after the market closes. For example, you can compare the close prices for Microsoft Corporation (ticker symbol MSFT) in the screen shot below with those from the web site in the preceding screen shot. The values are identical by date and symbol.
You can insert the time series data from the yahoo_prices_volumes_for_MSSQLTips_4_to_csv_demo.csv file into a SQL Server with a bulk insert command. The following script demonstrates the process.
- The script starts with a use statement for the database that holds the table for the initial load of time series data.
- Next, the code creates a fresh copy of the yahoo_prices_volumes_for_MSSQLTips
table in the dbo schema.
- The yahoo_prices_volumes_for_MSSQLTips table will subsequently be populated with the initial load of time series data.
- An if exists statement before the create table statement for yahoo_prices_volumes_for_MSSQLTips drops the table if it already exists.
- Then, a bulk insert command transfers the contents of yahoo_prices_volumes_for_MSSQLTips_4_to_csv_demo.csv file into the yahoo_prices_volumes_for_MSSQLTips table.
- Finally, a select statement displays the contents of the populated table. You can compare the contents of the populated table to the csv file to verify the successful transfer of the values.
use [for_csv_from_python]
go

-- drop table for watchlist if it exists
if exists(select object_id('dbo.yahoo_prices_volumes_for_MSSQLTips'))
drop table dbo.yahoo_prices_volumes_for_MSSQLTips

-- create table for watchlist
create table dbo.yahoo_prices_volumes_for_MSSQLTips(
   [Date] date,
   [Symbol] nvarchar(10),
   [Open] money NULL,
   [High] money NULL,
   [Low] money NULL,
   [Close] money NULL,
   [Volume] int NULL
)
go

-- bulk insert first batch of symbols to watchlist
bulk insert dbo.yahoo_prices_volumes_for_MSSQLTips
from 'C:\python_programs_output\yahoo_prices_volumes_for_MSSQLTips_4_to_csv_demo.csv'
with
(
    firstrow = 2,
    fieldterminator = ',',  --CSV field delimiter
    rowterminator = '\n'
)

-- display watchlist table with data for first batch of symbols
select * from dbo.yahoo_prices_volumes_for_MSSQLTips order by symbol, date
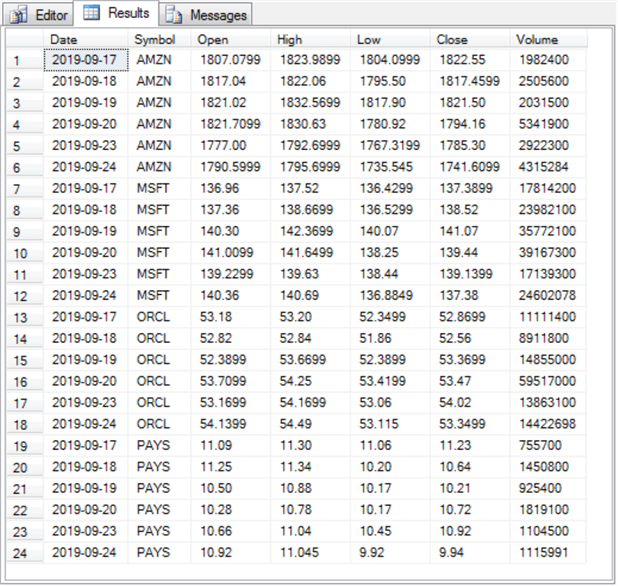
Here's the set of values from the last select statement in the preceding script. The order of the rows between the output from the script and the rows from the select statement is different because the select statement includes an order by clause which arranges the rows by symbol differently than the order in which historical price and volume data were collected and inserted into the csv file.
Adding new symbols to the initial load
After you create an initial load of time series data in SQL Server, it is likely the time series data will need continued management in at least two ways. This section presents the process and some code for implementing one of these maintenance activities.
The time series data users may ask for data on additional items beyond those in the initial load. For example, users may request your code track price and volume data over the same range of dates as for the initial load for three more symbols, such as ENPH, INS, and KL. You can start to satisfy this request with a txt file such as the one pictured below in a NotePad++ session. This file has the name MSSQLTips_3.txt, and it has the same layout as the txt file of ticker symbols for the initial load.

You can download historical price and volume time series data for these new symbols with a Python script file like the one for the initial load. The new script file can have a name like read_mssqltips_3_for_export_via_csv.py. This new script file should reference MSSQLTips_3.txt and save its output in a file named yahoo_prices_volumes_for_MSSQLTips_3_to_csv_demo.csv. Because the script in read_mssqltips_3_for_export_via_csv.py is nearly identical to the one in read_mssqltips_4_for_export_via_csv.py, its code is not displayed in this tip. However, the full code listing for all Python scripts in this tip are available in a download link from the Next Steps section.
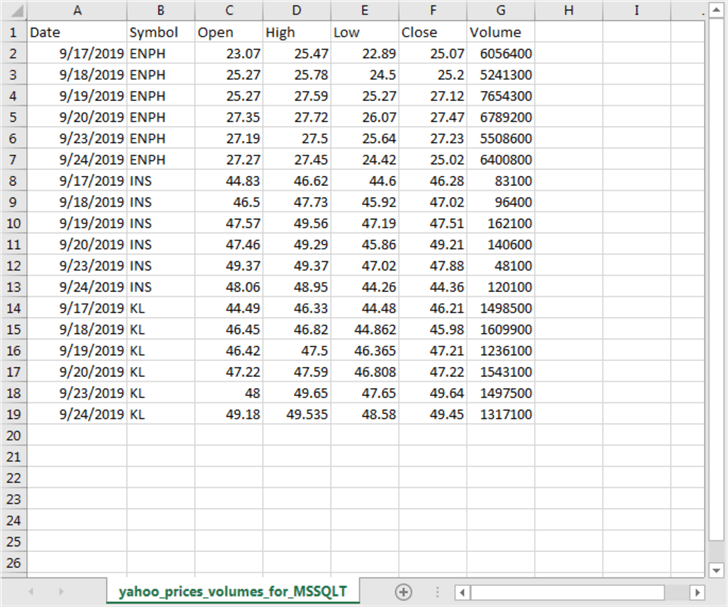
For your easy reference, here's the csv file created by invoking read_mssqltips_3_for_export_via_csv.py. The csv file name from the referenced Python script is yahoo_prices_volumes_for_MSSQLTips_3_to_csv_demo.csv.
- The time series data for each symbol extends from September 17, 2019 through September 24, 2019. If your needs require, you can change the time series range by altering the assignments for the start and end datetime objects.
- The time series data show for the three symbols in MSSQLTips_3.txt. You can collect data for different symbols by changing the contents of the MSSQLTips_3.txt file.
You can update the watchlist of historical price and volume data in SQL server previously populated in this tip. This update can be accomplished with a bulk insert statement that pumps the yahoo_prices_volumes_for_MSSQLTips_3_to_csv_demo.csv file contents into the yahoo_prices_volumes_for_MSSQLTips table. The following script shows the T-SQL code for updating the table from the most recently populated csv file.
-- bulk insert second batch of symbols to watchlist
bulk insert dbo.yahoo_prices_volumes_for_MSSQLTips
from 'C:\python_programs_output\yahoo_prices_volumes_for_MSSQLTips_3_to_csv_demo.csv'
with
(
    firstrow = 2,
    fieldterminator = ',',  --CSV field delimiter
    rowterminator = '\n'
)

-- display watchlist table with data for first and second batches of symbols
select * from dbo.yahoo_prices_volumes_for_MSSQLTips order by symbol, date
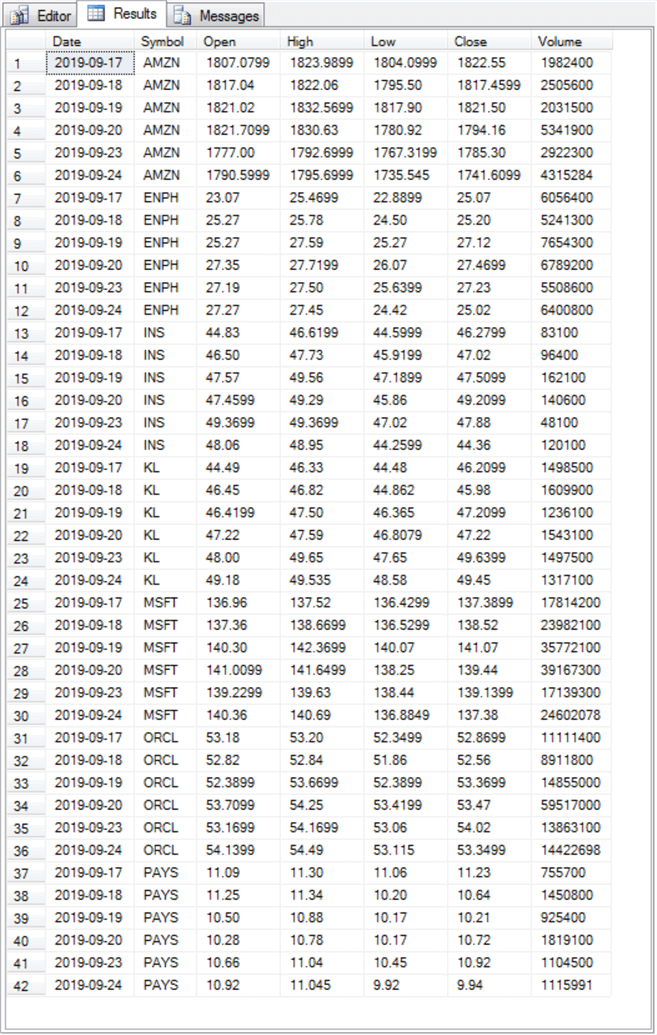
The preceding script ends with a select statement that shows the watchlist table of historical price and volume data after it is updated with data for the ENPH, INS, and KL ticker symbols. Recall that the watchlist table initially had historical price and volume data for the initial load for four other ticker symbols (AMZN, MSFT, ORCL, PAYS).
Here's the display of data from within SSMS. The watchlist table contains forty-two rows of data. This count results from six rows of historical data for each of seven ticker symbols.
Adding new rows with fresh historical data
This section gives you an overview of the code changes for updating an existing table of time series values in SQL Server with data for an additional time period. Up to this point in the tip, the initial load and the updated load for new ticker symbols both had data from September 17, 2019 through September 24, 2019. When working with time series data, it is common to update the data for each additional period on a regular basis, such as once per day. Because our examples use sequential trading days and September 25, 2019 is not a weekend day, we can demonstrate the addition of data for a trading date by inserting a row for all the symbols with the new trading date.
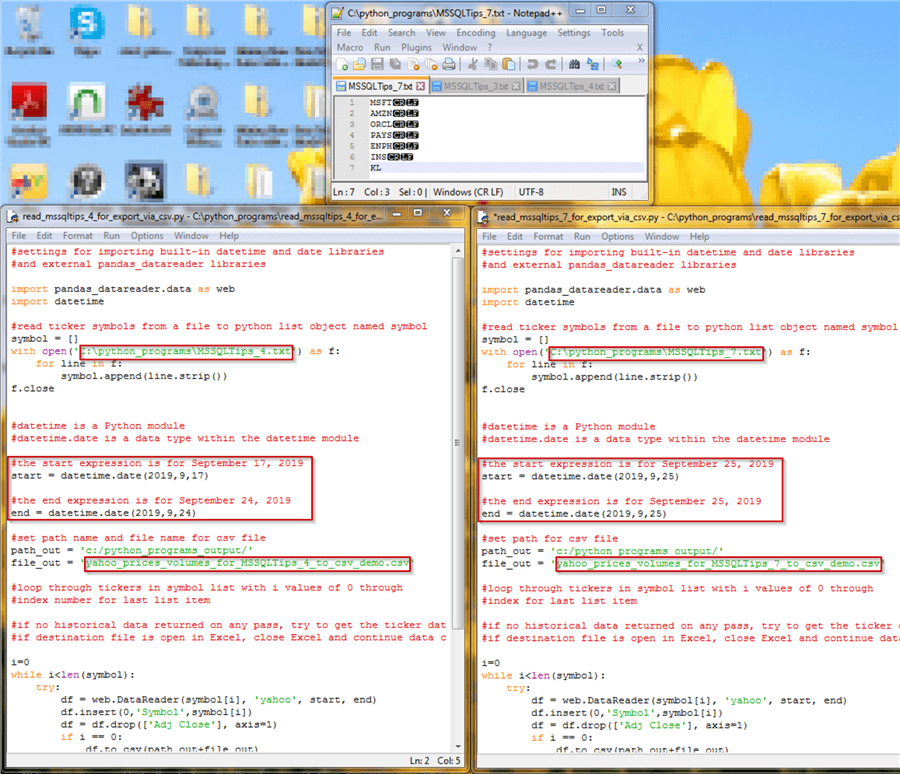
The screen shot below shows a Notepad++ session with four ticker symbols from the initial load as well as the update load with three more symbols. The name of this new file of ticker symbols is MSSLQTIPS_7.txt. This file with a set of consolidated ticker symbols from both prior loads will be the source for the third load that adds a row of fresh time series data for each ticker symbol.
An excerpt from the Python script for adding the new row of fresh data appears in the right window below the Notepad++ session. An excerpt from the Python script for the initial load of time series data appears in the left window below the Notepad++ session. The two Python scripts are identical except for three boxed code segments. The section titled "A process for collecting and setting up an initial set of time series dataset" has the full Python script for the initial load of time series data.
- The first boxed code segment is for the path name and file name with the ticker symbols for the current load. As you can see, the script for all seven ticker symbols has the name MSSQLTips_7.txt in a folder named Python_programs on the C: drive.
- The second boxed code segment assigns values to the start and end datetime objects for a load. When adding data for a single period, both the start and end datetime objects should have an identical value, which is September 25, 2019 in this example.
- The third boxed code segment indicates path name and file name for the csv file with the fresh data. In this example, the file name is yahoo_prices_volumes_for_MSSQLTips_7_to_csv_demo.csv in the c:/python_programs_output path.
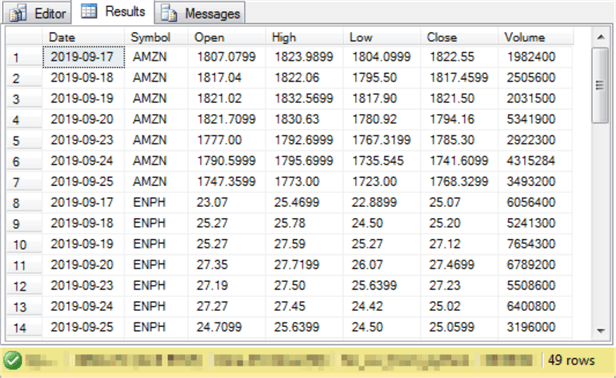
Here's the csv file with fresh data for September 25, 2019 for each of the seven symbols in the full set of ticker symbols for each of the prior two loads. Notice there is just one row for each symbol with a Date value setting of September 25, 2019.

You can append the csv file contents to the watchlist table of time series values (yahoo_prices_volumes_for_MSSQLTips) from the yahoo_prices_volumes_for_MSSQLTips_7_to_csv_demo.csv file. Here's the code to perform the append and display the results set with the fresh data added to the previously loaded historical time series data.
-- bulk insert fresh time series data to watchlist
bulk insert dbo.yahoo_prices_volumes_for_MSSQLTips
from 'C:\python_programs_output\yahoo_prices_volumes_for_MSSQLTips_7_to_csv_demo.csv'
with
(
    firstrow = 2,
    fieldterminator = ',',  --CSV field delimiter
    rowterminator = '\n'
)

-- display watchlist table with data for first and second batches of symbols
-- and with an extra row of time series data from the preceding select statement
select * from dbo.yahoo_prices_volumes_for_MSSQLTips order by symbol, date
Here's an excerpt from the results set for the select statement in the preceding script. The excerpt shows results for AMZN for the initial load of time series data as well as ENPH from the supplementary update load of time series data. As you can see, both symbols have historical time series values for trading dates from September 17, 2019 through September 25, 2019. The remaining five symbols also have time series values over the same date range.
Next Steps
You can try out the code examples for this tip. All the scripts referenced in this tip are available from this download file.
- First, try to duplicate the results in this tip with the exact symbols in this tip.
- Next, change the ticker symbols and dates to those that you prefer instead.
- Then, replace the csv files for this tip with those from your company's or your client's systems.
- Finally, leave a comment about your success in adapting this tip for your business as well as any specific extensions you want to see on related topics in future tips.
About the author
 Rick Dobson is an author and an individual trader. He is also a SQL Server professional with decades of T-SQL experience that includes authoring books, running a national seminar practice, working for businesses on finance and healthcare development projects, and serving as a regular contributor to MSSQLTips.com. He has been growing his Python skills for more than the past half decade -- especially for data visualization and ETL tasks with JSON and CSV files. His most recent professional passions include financial time series data and analyses, AI models, and statistics. He believes the proper application of these skills can help traders and investors to make more profitable decisions.
This author pledges the content of this article is based on professional experience and not AI generated.
View all my tips


