Problem
Can while loops ever be beneficial for processing time series data in SQL Server? If so, show me some examples.
Solution
While loops can be very inefficient when processing relational datasets. With relational datasets, the order of the rows is generally not important because SQL relates tables to one another by column values for joins between tables and with SQL window functions within a table.
In contrast, the order of the rows in a time series dataset is generally required to be in datetime value order (that’s why it is called a time series dataset). Time series datasets can also be comprised of concatenated rowsets with an inner rowset based on a time series and outer rowset based on a set of category values, such as sales over time (inner rowset) for different products (outer rowset) or price over time (inner rowset) for different ticker symbols (outer rowset). While loops can be handy for processing time series datasets:
- When there is no built-in SQL function to facilitate a time series calculation, such as an exponential moving average
- When there is a need to process a dataset on both time series and category value sets (nested while loops can handle this use case)
This tip covers two-time series examples:
- A simple one to show the simplicity offered by a while loop versus a repeated set of declarative statements for different category values. If you want to generate some calculated values or even just display a subset of values, your T-SQL may be more compact and easier to maintain when you use while loops. This potential benefit needs to be evaluated versus the tendency for row-by-row operations to provide poorer performance. Depending on how the source data are organized, the poorer performance for row-by-row operations can be substantially minimized. For example, it is likely that organizing the source data by category and time series values along with a primary key for categories and time series values can substantially speed data access when performing row-by-row operations on a time series dataset.
- How to use a while loop to calculate values for which there is no built-in SQL function, namely exponential moving averages. This second example also illustrates how to nest while loops inside one another so the calculations can be repeated for different categories of time series data, such as prices over trading dates for one ticker symbol versus another ticker symbol. The sample is presented in two scripts that highlight:
- How to set some initial values for computing a calculated value over a set of rows with time series indicator values as well as how to iterate with a while loop over an inner rowset
- How to code another while loop that iterates over an outer rowset; this outer while loop will update values for the inner while loop so that the inner while loop returns different results for successive iterations of the outer while loop. This approach essentially can deliver some of the benefits of a partitioned dataset to an application without the overhead and complexity of creating a partitioned dataset
Tip Source Data
The time series dataset for this tip resides in a table named symbol_date. The following script shows the design for the table. The original process for designing and populating the table is described in a prior tip. For your convenience, the download for this tip includes a csv file which you can use to populate a SQL Server table like the one described below.
- The use statement specifies the DataScience database as the default database for the script.
- Therefore, the create table statement creates the table in the DataScience database. However, you can change this just by naming another database in the use statement
- The table design illustrates how to specify a SQL Server table, such as symbol_date, for a time series dataset
- The Symbol column is populated by ticker symbols. The sample data in this tip has six distinct ticker symbols: DIA, QQQ, SPXL, SPY, TQQQ, and UDOW
- Ticker symbols serve as category values within the time series dataset
- The first date column value can vary across ticker symbols because the initial public offering date can vary from one ticker to the next
- The Date column is populated by trading dates from their first availability in Yahoo Finance through November 30, 2022, the date when data were pulled for the original tip using this dataset
- Aside from a column of datetime values and a column of category values, if required,
- Time series datasets must contain at least one column of data values that can change over the datetime values, such as close prices for a financial security on trading dates
- The following script has
- Four columns of price data for the open, high, low, and close of each trading date
- The volume column denotes the number of shares exchanged for a ticker symbol on a trading date
- The Symbol column is populated by ticker symbols. The sample data in this tip has six distinct ticker symbols: DIA, QQQ, SPXL, SPY, TQQQ, and UDOW
- The primary key constraint (pk_symbol_date) is strongly recommended, but it is not required.
- One key advantage of the constraint is that select statements return values in order by category and datetime values
- Recall that time series datasets have ordered rows by datetime values and category values (if they are also used)
- Without a primary key constraint, you may find that your select statements for subsets of dataset rows run slower, which can, in turn, substantially degrade the performance of a solution
-- prepared by Rick Dobson for MSSQLTips.com

Use DataScience
go

create table [dbo].[symbol_date](
   [Symbol] [nvarchar](10) NOT NULL,
   [Date] [date] NOT NULL,
   [Open] [decimal](19, 4) NULL,
   [High] [decimal](19, 4) NULL,
   [Low] [decimal](19, 4) NULL,
   [Close] [decimal](19, 4) NULL,
   [Volume] [float] NULL,
 constraint [pk_symbol_date] PRIMARY KEY CLUSTERED
(
   [Symbol] ASC,
   [Date] ASC
)WITH (PAD_INDEX = OFF, STATISTICS_NORECOMPUTE = OFF
 ,IGNORE_DUP_KEY = OFF, ALLOW_ROW_LOCKS = ON
 ,ALLOW_PAGE_LOCKS = ON
 ,OPTIMIZE_FOR_SEQUENTIAL_KEY = OFF) ON [PRIMARY]
) ON [PRIMARY]
go
Here are a couple of excerpts for the first and last ten rows from the source dataset for this tip.
- The first excerpt shows values for the DIA ticker symbol. This ticker’s first trading date is January 21, 1998
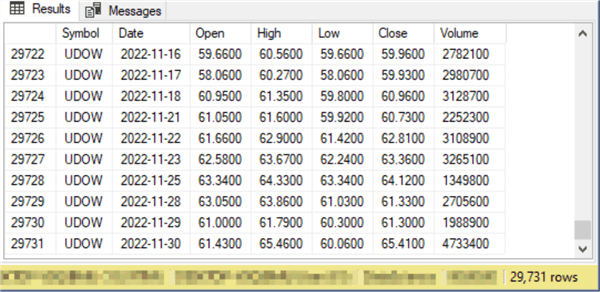
- The second excerpt shows values for the UDOW ticker, which is the last ticker in alphabetical order for the dataset. This ticker symbol, like all the other ticker symbols in the dataset, ends on November 30, 2022

Filtering the Rows of a Time Series Dataset in a While Loop by Category Values
When you have a block of T-SQL code that needs to be applied to multiple parts of a dataset, then while loops may be a good approach for implementing the task. This is especially so when the alternative is repeating a set of declarative T-SQL statements for each dataset part. In this tip, each ticker denotes a dataset part. If you were performing a comparison of how different portals to a site generated the best return on investment, then you could run the same block of code to evaluate different portals on sales metrics, such as total dollar sales, sales by product line, and average number of items purchased per order.
To clarify with a very simple example how while loops can apply the same T-SQL code to different dataset parts, this section demonstrates how to display the first and last five time series rows for each of the six tickers used in the dataset for this tip. This is an example of an iterative approach to completing the task. To highlight how the while loop improves the completion of the task, the task is also implemented by repeating the same declarative T-SQL statements for displaying the first and last five time series rows for each ticker symbol.
While Loop Approach to Repeating Tasks
Here is the T-SQL code for the while loop approach to listing the first and last ten rows for each distinct ticker symbol in the sample dataset for this tip. Recall from the previous section that a time series dataset can have a separate set of rows for each category variable value. In the T-SQL example below, the distinct ticker symbol values are stored in the #temp_symbol_symbol_idn table. These ticker symbols are derived with the help of the distinct keyword towards the top of the following script. The script stores the distinct ticker symbol values along with a corresponding numerical identifier in the symbol and symbol_idn columns of the #temp_symbol_symbol_idn table.
The while loop toward the bottom of the script repeats for as many rows as there are in the #temp_symbol_symbol_idn table.
- Just before entering the while statement, the code assigns a value of 1 to the @symbol_idn local variable. The value of this local variable assists the while loop in deciding whether to complete another pass through the while loop or whether to pass control to the first statement after the while loop
- Whenever the value of the @symbol_idn local variable is less than or equal to the maximum symbol_idn column value in the #temp_symbol_symbol_idn table, the while loop performs another pass through the loop
- Whenever the value of the @symbol_idn local variable is not less than or equal to the maximum symbol_idn column value in the #temp_symbol_symbol_idn table, the while loop ceases to execute and passes control to the first statement after the while loop or just stops executing if there are no further statements to which to pass control
- The code to be executed on each pass through the while loop is contained within a begin…end block
- Within the while loop, there are two separate blocks of code – one for displaying the first set of five rows and another for displaying the last set of five rows for each ticker symbol in #temp_symbol_symbol_idn
- After executing the code to display the first and last five rows for a ticker symbol, the code inside the while loop increases by 1 the value in the @symbol_idn local variable and returns control to the while statement at the top of the loop.
- The while statement at the top of the loop either begins another pass through the loop or passes control to the first statement after the while loop depending on the value of the @symbol_idn local variable relative to the maximum value of the symbol_idn column in the #temp_symbol_symbol_idn table
-- prepared by Rick Dobson for MSSQLTips.com

-- assign a number to each distinct ticker symbol
-- in DataScience.dbo.symbol_date

declare @symbol nvarchar(10), @symbol_idn int

-- assign a symbol_idn to each symbol
-- and save the new table as a fresh version of #temp_symbol_symbol_idn
drop table if exists #temp_symbol_symbol_idn;

select symbol, row_number() over (order by symbol) [symbol_idn]
into #temp_symbol_symbol_idn
from
(
-- list the distinct symbols in DataScience.dbo.symbol_date
select distinct symbol
from DataScience.dbo.symbol_date
) for_symbol_and_symbol_idn

-- optionally list values in #temp_symbol_symbol_idn
   select * from #temp_symbol_symbol_idn

-- loop through symbols in #temp_symbol_symbol_idn
-- to first and last ten rows for each symbol
set @symbol_idn = 1
while @symbol_idn <= (select max(symbol_idn) from #temp_symbol_symbol_idn)
begin
   -- list top 5 rows
   select top 5 *
   from DataScience.dbo.symbol_date
   where symbol = (select symbol from #temp_symbol_symbol_idn where symbol_idn = @symbol_idn)

   -- list bottom 5 rows
   -- in ascending order
   select *
   from
   (
   -- get bottom 5 rows
   -- in desc order by date
   select top 5 *
   from DataScience.dbo.symbol_date
   where symbol = (select symbol from #temp_symbol_symbol_idn where symbol_idn = @symbol_idn)
   order by date desc
   ) for_bottom_rows_time_series
   order by date asc


   set @symbol_idn = @symbol_idn + 1
end
Here are the rows from the #temp_symbol_symbol_idn table. This table for these rows and their column values are populated towards the top of the preceding script. There is one symbol column value for each ticker symbol, and the symbol_idn column values denote a row number in the #temp_symbol_symbol_idn table for each ticker.

Here are the first and last five rows for the DIA ticker. The first Date column value is January 21, 1998. The last Date column value is November 30, 2022.

Here are the first and last five rows for the UDOW ticker, which is the last ticker in the #temp_symbol_symbol_idn table. The financial security represented by the UDOW ticker was initially offered for sale later than the financial security represented by the DIA ticker. Time series datasets for multiple category values, such as the one in the symbol_date table, do not require all rows to have the same number of rows.
There are fewer UDOW rows than DIA rows in the symbol_date table because the first Date column value for the UDOW ticker rows is February 12, 2010 whereas the first row for the DIA ticker is more than a decade earlier (January 21, 1998), rows for both ticker symbols end on the same date – namely November 30, 2022. With a relational dataset it would be common to have missing values (nulls) at the beginning of the symbol_date rows for the UDOW ticker. Not requiring null values for missing column values in a time series dataset can substantially shorten the number of rows in a table for time series versus relational datasets. Consequently, time series datasets can sometimes be processed faster – especially when there are many category variable values in a dataset with different initial start datetime values.

The sets of first and last rows for ticker symbols QQQ, SPXL, SPY, and TQQQ are available from the second results set for the preceding query between the first and last category ticker symbols.
Declarative Statement Approach for Each Category Variable Value
Here is another T-SQL approach to displaying the first and last five rows for each ticker symbol in this tip’s sample dataset. Instead of using a while loop to pass through a single block of code for each distinct ticker symbol in the source dataset, the following code example separately extracts the rows with declarative statements blocks of code that are updated for each set of first and last rows.
The following set of declarative T-SQL statements has several blocks of code – one set for each ticker symbol – as well as another for generating the list of distinct ticker symbols.
- The first block of code is for creating and populating a fresh version of the #temp_symbol_symbol_idn table. As you can see, the coded block commences with a conditional drop table expression
- There are six remaining blocks of code that have essentially the same code for displaying the first and last five rows for each category variable value. Comment line statements clearly identify the commencement of each of these blocks. For example, the comment line denoting the beginning of the second block of code begins with “– list top and bottom five rows for symbol_idn = 2”
-- prepared by Rick Dobson for MSSQLTips.com

drop table if exists #temp_symbol_symbol_idn;

-- assign a symbol_idn to each symbol
-- and save the new table as a fresh version of #temp_symbol_symbol_idn
select symbol, row_number() over (order by symbol) [symbol_idn]
into #temp_symbol_symbol_idn
from
(
-- list the distinct symbols in
select distinct symbol
from DataScience.dbo.symbol_date
) for_symbol_and_symbol_idn


-- list top and bottom five rows for symbol_idn = 1
   -- list top 5 rows
   select top 5 *
   from DataScience.dbo.symbol_date
   where symbol = (select symbol from #temp_symbol_symbol_idn where symbol_idn = 1)

   -- list bottom 10 rows
   -- in ascending order
   select *
   from
   (
   -- get bottom 5 rows
   -- in desc order by date
   select top 5 *
   from DataScience.dbo.symbol_date
   where symbol = (select symbol from #temp_symbol_symbol_idn where symbol_idn = 1)
   order by date desc
   ) for_bottom_rows_time_series
   order by date asc


-- list top and bottom five rows for symbol_idn = 2
   -- list top 5 rows
   select top 5 *
   from DataScience.dbo.symbol_date
   where symbol = (select symbol from #temp_symbol_symbol_idn where symbol_idn = 2)

   -- list bottom 10 rows
   -- in ascending order
   select *
   from
   (
   -- get bottom 5 rows
   -- in desc order by date
   select top 5 *
   from DataScience.dbo.symbol_date
   where symbol = (select symbol from #temp_symbol_symbol_idn where symbol_idn = 2)
   order by date desc
   ) for_bottom_rows_time_series
   order by date asc


-- list top and bottom five rows for symbol_idn = 3
   -- list top 5 rows
   select top 5 *
   from DataScience.dbo.symbol_date
   where symbol = (select symbol from #temp_symbol_symbol_idn where symbol_idn = 3)

   -- list bottom 10 rows
   -- in ascending order
   select *
   from
   (
   -- get bottom 5 rows
   -- in desc order by date
   select top 5 *
   from DataScience.dbo.symbol_date
   where symbol = (select symbol from #temp_symbol_symbol_idn where symbol_idn = 3)
   order by date desc
   ) for_bottom_rows_time_series
   order by date asc


-- list top and bottom five rows for symbol_idn = 4
   -- list top 5 rows
   select top 5 *
   from DataScience.dbo.symbol_date
   where symbol = (select symbol from #temp_symbol_symbol_idn where symbol_idn = 4)

   -- list bottom 10 rows
   -- in ascending order
   select *
   from
   (
   -- get bottom 5 rows
   -- in desc order by date
   select top 5 *
   from DataScience.dbo.symbol_date
   where symbol = (select symbol from #temp_symbol_symbol_idn where symbol_idn = 4)
   order by date desc
   ) for_bottom_rows_time_series
   order by date asc


-- list top and bottom five rows for symbol_idn = 5
   -- list top 5 rows
   select top 5 *
   from DataScience.dbo.symbol_date
   where symbol = (select symbol from #temp_symbol_symbol_idn where symbol_idn = 5)

   -- list bottom 10 rows
   -- in ascending order
   select *
   from
   (
   -- get bottom 5 rows
   -- in desc order by date
   select top 5 *
   from DataScience.dbo.symbol_date
   where symbol = (select symbol from #temp_symbol_symbol_idn where symbol_idn = 5)
   order by date desc
   ) for_bottom_rows_time_series
   order by date asc


-- list top and bottom five rows for symbol_idn = 6
   -- list top 5 rows
   select top 5 *
   from DataScience.dbo.symbol_date
   where symbol = (select symbol from #temp_symbol_symbol_idn where symbol_idn = 6)

   -- list bottom 10 rows
   -- in ascending order
   select *
   from
   (
   -- get bottom 5 rows
   -- in desc order by date
   select top 5 *
   from DataScience.dbo.symbol_date
   where symbol = (select symbol from #temp_symbol_symbol_idn where symbol_idn = 6)
   order by date desc
   ) for_bottom_rows_time_series
   order by date asc
Among the benefits of the while loop approach are these two items:
- There is no need to separately write code to display the first and last five rows for each distinct category variable value
- There is no need to edit separately the code for each distinct category variable value when changes are required. You make the code revision once, and it applies to all category values
The value of each of these benefits grows as the number of category values in the data source grows.
Computing Exponential Moving Average Values with a Nested While Loop Example
Exponential moving averages are arguably among the most important metrics for time series values.
- Among the reasons exponential moving averages are so pivotal for time series analyses is because they:
- can indicate the trend of underlying time series values
- reveal cyclical or seasonal trends across a set of time series values
- are widely used to compute a large set of other time series indicator values for the underlying time series values; this is especially so in financial securities analysis
- Despite their name, exponential moving averages are not typical average values. Instead, they are smoothed values that denote how the underlying time series values change over the length of a time series from its first value through to the most recently available value
- This section introduces a typical expression for computing exponential moving averages in the financial services industry. Depending on the domain and the objectives of a time series analytics project, you may need to tweak the calculation approach described in this tip
- Any one set of underlying time series values, such as close prices over a set of trading days, can have multiple sets of exponential moving averages. Multiple moving average sets often correspond to exponential moving averages with different period lengths. The longer the period length, the greater the degree of smoothing; the shorter the period length, the less pronounced is the degree of smoothing
- One reason why exponential moving averages are so important for the current tip is that they can illustrate an application for nested while loops
This section introduces some basic expressions for computing exponential moving averages. Then, it illustrates how to calculate with T-SQL scripts exponential moving averages with different period lengths. Two scripts progressively demonstrate the basics and more advanced issues for calculating exponential moving averages.
See these earlier tips for other demonstrations of how to calculate and apply moving averages with T-SQL:
- Building a SQL Computational Framework for MACD Indicators
- Exponential Moving Average Calculation in SQL Server
- Differences Between Exponential Moving Average and Simple Moving Average in SQL Server
- Mining Time Series with Exponential Moving Averages in SQL Server
- Revisiting Time Series Model Performance Assessment with T-SQL
Expressions for Computing Exponential Moving Averages
The general expression for an exponential moving average (ema) appears below. Notice that the ema at time t depends on two terms: the price at time t and the ema at time t-1. The two terms in the ema general expression depend on different rows in an underlying dataset. This is one reason why the calculation of ema values is not supported by built-in SQL Server functions. With financial securities analysis, the price at time t is the close price at time t. The ema for the initial period is always null because this period, by definition, does not have a preceding period. Also, you need a guideline for setting the initial ema value in the second period. The guideline used in this tip is to set the ema for the second period to the close price value in the first period. This guideline is suggested by multiple other sources, including this one, but other authors have suggested different approaches to specifying the initial ema value. No matter what initial ema value you designate, the following expression will gradually move ema values in the direction of the price at time t.
ema(t) = (alpha* price(t)) + ((1-alpha)*ema(t-1))
- price(t) is the security price at time t
- ema(t-1) is the exponential moving average at time t-1
- alpha and (1-alpha) are, respectively, smoothing values for price(t) and ema(t-1)
Alpha in the above expression serves as a smoothing value. The larger the value of alpha, the faster ema(t) approaches the current value of price. Another calculation constraint is that alpha plus (1-alpha) equals 1. The value of alpha should be greater than 0 and less than 1. When processing financial securities data, it is typical to use the following expression for alpha
(2/(period length + 1))
When computing alpha, you should represent 2 and period length + 1 as floating point values to preserve precision when calculating ema(t). Otherwise, the division could truncate the outcome to 0.
A T-SQL Example for Calculating ema Values for a Single Ticker Symbol with a While Loop
The main aim of the following script is to compute ema values with period lengths of 10, 30, 50, and 200 for time series values with a specific ticker symbol.
- You can calculate ema values for other period lengths based on the expressions in the preceding subsection. Ema values with a period length of 10 are good for revealing short-run trends, and ema values with a period length of 200 are good for revealing long-run trends. Period lengths of 30 and 50 are for revealing trends between the two extreme period lengths of 10 and 200
- The code in this subsection works explicitly for the DIA ticker with a symbol_idn value of 1. However, you can easily revise a where clause criterion to reference any of the other five ticker symbols in the source dataset. The source data for the query reside in the DataScience.dbo.symbol_date table. You can repopulate the DataScience.dbo.symbol_date table with other time series values for other ticker symbols and/or date ranges for which you want to calculate ema values
- The script below generates and displays two results sets, but there are commented lines and sections in the code sample that suppress the display of other results sets. If you remove the comment markers for any commented select statement, you can generate additional results sets that may help you to understand better how the code works
The script for this subsection is very heavily commented, explaining how and/or what specific code segments do. Additionally, the following bullets highlight some points that may be of particular interest to you.
- As just stated, there are two results sets from the script
- The first results set shows the settings for the @symbol, @first_date, @second_date, and @last_date local variables. The settings for these local variables are all calculated so they will automatically change if you use a different time series dataset than the sample one in this tip
- The second results set shows the symbol, date, close, ema_10, ema_30, ema_50, and ema_200 column values for the dates associated with the DIA ticker
- The declarations section towards the top of the script declares local variables by specifying their name and data type. Additionally, for four other local variables (@alpha_10, @alpha_30, @alpha_50, @alpha_200), the code computes a value for each local variable. These local variables correspond to alpha values for ema value sets with period lengths of 10, 30, 50, and 200
- Next, the code creates and populates the #temp_symbol_symbol_idn table. The logic for this code block is described in a preceding subsection titled “While Loop Approach to Repeating Tasks.”
- The table is only marginally required because the code in this subsection is for a single ticker symbol – namely, DIA
- However, the code is critical for the next section that displays ema values for all six ticker symbols in the sample time series dataset for the tip
- One of the purposes of this subsection is to equip you with a background for calculating ema values with nested while loops in the next subsection
- The next code block populates four local variables and assigns values to them with set statements before displaying their names and values with a select statement
- The @symbol local variable shows the ticker symbol for the ema results set
- The @first_date and @second_date local variables are critical, denoting the first two dates for the current value of @symbol. In many cases, ticker symbols have different start dates because their initial public offering dates are different. Also, a data analyst can opt to start calculating ema values for any time series value after the initial public offering date if all the history going back to the initial public offering is not required for an analytics project
- The @last_date (November 30, 2022) for the sample dataset in this tip is the same for all tickers since that date was used when the time series were initially downloaded from Yahoo Finance to SQL Server
- The next code segment populates the first two rows of the #temp_symbol_date_emas table with a select into statement and a succession of case statements. The first two rows are defined according to special rules described in the “Expressions for computing exponential moving averages” subsection
- All the ema values for the first date are null. This is because there is no preceding date
- All the ema values for the second date are set equal to the close price on the first date
- The next code block starts with a couple of set statements to initialize values for the @prior_date and @current_date local variables. These local variable values are used to facilitate navigation through a subsequent while loop that computes ema values for the third through the last row of time series data. The code block populates the #temp_symbol_date_emas table for the third date through the last date with the aid of a while loop
- As with the preceding section, the while loop in this section can loop until a condition is no longer true
- The loop condition in this section is that the @current_date value is less than or equal to the @last_date value
- The code to be executed on each pass through the while loop is contained within a begin…end block
- The code within the begin…end block performs two functions
- It computes and inserts the ema values for the row in #temp_symbol_date_emas table corresponding to the @current_date local variable value
- Next, it resets the @prior_date and @current_date local variable values
- If the condition at the top of the while loop is true, control passes to the first statement in the loop
- If the condition at the top of the while loop is false, control passes to the first statement after the begin…end block in the loop
- The sole line of code after the while loop displays all the values populating the #temp_symbol_date_emas table. The ema column values in the table contain the computed values from the preceding code in the script
-- prepared by Rick Dobson for MSSQLTips.com

drop table if exists #temp_symbol_date_emas
drop table if exists #temp_symbol_symbol_idn;
go

-- declarations
declare
 @symbol nvarchar(10)
,@symbol_idn int
,@first_date date
,@second_date date
,@prior_date date
,@current_date date
,@last_date date
,@alpha_10 float(53) = (cast(2. as float(53))/cast(11. as float(53)))
,@alpha_30 float(53) = (cast(2. as float(53))/cast(31. as float(53)))
,@alpha_50 float(53) = (cast(2. as float(53))/cast(51. as float(53)))
,@alpha_200 float(53) = (cast(2. as float(53))/cast(201. as float(53)))

-- optionally display alpha values for computing ema values
-- with different period lengths
/*
select
 @alpha_10 [@alpha_10]
,@alpha_30 [@alpha_30]
,@alpha_50 [@alpha_50]
,@alpha_200 [@alpha_200]
*/

-- create #temp_symbol_symbol_idn based on
-- distinct symbol values from DataScience.dbo.symbol_date
drop table if exists #temp_symbol_symbol_idn;

select symbol, row_number() over (order by symbol) [symbol_idn]
into #temp_symbol_symbol_idn
from
(
-- list the distinct symbols in
select distinct symbol
from DataScience.dbo.symbol_date
) for_symbol_and_symbol_idn

-- optionally list values in #temp_symbol_symbol_idn
-- select * from #temp_symbol_symbol_idn

-- compute @symbol, @first_date, @second_date, @last_date for first symbol
set @symbol = (select symbol
            from #temp_symbol_symbol_idn where symbol_idn = 1)
set @first_date = (select min(Date)
            from DataScience.dbo.symbol_date where Symbol = @symbol)
set @second_date = (select min(Date)
            from DataScience.dbo.symbol_date where Symbol = @symbol and date>@first_date)
set @last_date = (select max(Date)
            from DataScience.dbo.symbol_date where Symbol = @symbol)


-- optionally display local variables for
-- @symbol, @first_date, @second_date, and @last_date
--/*
select
 @symbol [@symbol]
,@first_date [@first_date]
,@second_date [@second_date]
,@last_date [@last_date]
--*/


-- assign ema_10, ema_30, ema_50, and ema_200 column
-- values for first two dates in DataScience.dbo.symbol_date
-- and store results set into #temp_symbol_date_emas

select
  *
 ,case
   when Date = @first_date then null
   when Date = @second_date then
    (select [close] from DataScience.dbo.symbol_date where Symbol = @symbol and Date = @first_date)
  end ema_10
 ,case
   when Date = @first_date then null
   when Date = @second_date then
    (select [close] from DataScience.dbo.symbol_date where Symbol = @symbol and Date = @first_date)
  end ema_30
 ,case
   when Date = @first_date then null
   when Date = @second_date then
    (select [close] from DataScience.dbo.symbol_date where Symbol = @symbol and Date = @first_date)
  end ema_50
 ,case
   when Date = @first_date then null
   when Date = @second_date then
    (select [close] from DataScience.dbo.symbol_date where Symbol = @symbol and Date = @first_date)
  end ema_200
into #temp_symbol_date_emas
from
(
-- enumerate source data for a symbol
-- where date is less than or equal to @second_date
-- from DataScience.dbo.symbol_date
select Symbol, Date,[close]
from DataScience.dbo.symbol_date
where Symbol = @symbol
and Date <= @second_date
) for_first_and_second_dates


-- optionally display #temp_symbol_date_emas for
-- first two dates (@first_date and @second_date)
-- select * from #temp_symbol_date_emas order by date

----------------------------------------------------------------


-- initialize values for @prior_date and @current_date
-- after assigning ema values for @first_date and @second_date
set @prior_date = @second_date
set @current_date =
 (
   select min(Date)
   from DataScience.dbo.symbol_date
   where Symbol = @symbol and date>@second_date
 )

-- optionally display initial @prior_date and @current_date values
-- select @prior_date [@prior_date], @current_date [@current_date]


-- while loop has a condition of @current_date <= @last_date
-- repeat while loop for as long as the condition is true
while @current_date <= @last_date
begin
   -- computed emas based on current date close and prior date ema
   -- gets inserted into #temp_symbol_date_emas

   -- insert freshly computed emas into #temp_symbol_date_emas
   insert into #temp_symbol_date_emas

   -- [ema_10] through [ema_200] filtered by @current_date
   select
    for_filtering_computed_ema.symbol
   ,for_filtering_computed_ema.date
   ,for_filtering_computed_ema.[close]
   ,for_filtering_computed_ema.[computed ema_10] [ema_10]
   ,for_filtering_computed_ema.[computed ema_30] [ema_30]
   ,for_filtering_computed_ema.[computed ema_50] [ema_50]
   ,for_filtering_computed_ema.[computed ema_200] [ema_200]
   from
   (
   -- inner calculates ema values based on @prior_date and @current_date
   select
         symbol_date.Symbol
      ,symbol_date.Date
      ,symbol_date.[close]
      ,cast(
      (symbol_date.[close]*@alpha_10)
         +
         ((lag(ema_10,1) over (order by symbol_date.Date))*(1-@alpha_10)) as dec(19,4)) [computed ema_10]
      ,cast(
      (symbol_date.[close]*@alpha_30)
         +
         ((lag(ema_30,1) over (order by symbol_date.Date))*(1-@alpha_30)) as dec(19,4)) [computed ema_30]
      ,cast(
      (symbol_date.[close]*@alpha_50)
         +
         ((lag(ema_50,1) over (order by symbol_date.Date))*(1-@alpha_50)) as dec(19,4)) [computed ema_50]
      ,cast(
      (symbol_date.[close]*@alpha_200)
         +
         ((lag(ema_200,1) over (order by symbol_date.Date))*(1-@alpha_200)) as dec(19,4)) [computed ema_200]
   from DataScience.dbo.symbol_date
   left join #temp_symbol_date_emas
   on symbol_date.symbol = #temp_symbol_date_emas.symbol
   and symbol_date.Date = #temp_symbol_date_emas.Date
   where symbol_date.Symbol = @symbol and symbol_date.Date in (@prior_date,@current_date)
   ) for_filtering_computed_ema
   where for_filtering_computed_ema.Date = @current_date

   -- reset pointers for next prior and current dates
   set @prior_date = @current_date
   set @current_date =
    (
      select min(Date)
      from DataScience.dbo.symbol_date
      where Symbol = @symbol and date>@prior_date
    )
end

-- display computed emas after adding while loop results
-- to first two rows
select * from #temp_symbol_date_emas order by date
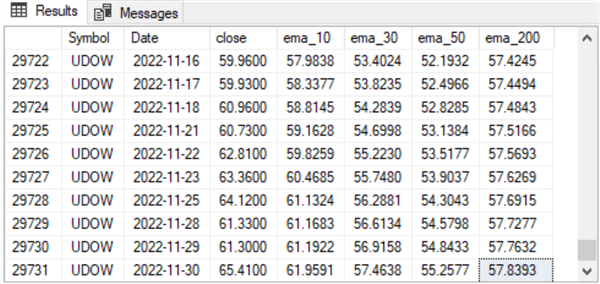
Here are two screenshots illustrating the output generated by the preceding script.
- The top screenshot shows the @symbol, @first_date, @second_date, and @last_date values in its first results set. This screenshot also presents the top six rows from the #temp_symbol_date_emas table. The first row in this screenshot corresponds to the @first_date value.
- The bottom screenshot shows the final eight rows from the #temp_symbol_date_emas table. The final row in this screenshot has a Date column value equal to the @last_date local variable value


A T-SQL Example for Computing ema Values with Nested While Loops
This subsection builds on the preceding subsection. The code in this subsection presents an example of an inner while loop within an outer while loop:
- The inner while loop in this subsection contains a slightly modified version of the code in the preceding subsection. The objective of this inner while loop is to compute the ema values for a specific @symbol value. Separate assignments are made for each date in the set of time series values for the current @symbol value
- The outer while loop passes through the distinct ticker symbol values in the #temp_symbol_symbol_idn table. On each pass through the outer while loop, a fresh assignment of a ticker symbol value is made to the @symbol local variable. The outer while loop then passes control to the inner loop. After the inner loop computes ema values for the current @symbol value, the inner returns control to the outer loop. When control returns from the inner loop to the outer loop, the value of @symbol_idn and @symbol are updated from the #temp_symbol_symbol_idn table
Here is the code for the example in this subsection. If you decide to dig into the code, you will discover there are four parts to the script.
- The first part creates tables (#temp_symbol_date_emas and #temp_symbol_symbol_idn), declares local variables, and initializes @symbol_idn and @symbol for the first pass through the outer loop. The first part also assigns values to four local variables (@alpha_10, @alpha_30, @alpha_50, and @alpha_200) that are not updated by either the outer or inner while loops. These four local variables are used for computing ema values with different period lengths within the inner while loop.
- The second part begins with the while statement for the outer while loop. The condition for this outer while loop is that @symbol_idn must be less than or equal to the maximum symbol_idn column value in #temp_symbol_symbol_idn
- Next, set statements assign values to four local variables (@symbol, @first_date, @second_date, and @last_date)
- Then, the first two rows for the time series for the current value of @symbol are assigned and saved to the #temp_symbol_date_emas table
- The code next sets up for running the inner while loop by initializing @prior_date and @current_date values for the third time series row based on the current value of @symbol
- The third part begins with the while statement for the inner while loop. The condition for the loop’s while statement is that @current_date value must be less than or equal to @last_date value. This loop computes ema values for the third date through the last date for the time series values associated with the current value of @symbol and saves them to the #temp_symbol_date_emas table
- After the inner while loop completes all its iterations, control returns to the outer while loop. Two lines of code update the values for @symbol_idn and @symbol
- After the outer while loop completes all its iterations, control moves to the first statement after the outer while loop. This statement displays column values for all rows in #temp_symbol_date_emas
-- prepared by Rick Dobson for MSSQLTips.com

drop table if exists #temp_symbol_date_emas
drop table if exists #temp_symbol_symbol_idn
go

-- create #temp_symbol_date_emas outside of loop for symbols
create table #temp_symbol_date_emas(
 Symbol nvarchar(10)
,Date date
,[close] dec(19,4)
,ema_10 dec(19,4)
,ema_30 dec(19,4)
,ema_50 dec(19,4)
,ema_200 dec(19,4)
)
go

-- declarations
declare
 @symbol nvarchar(10)
,@symbol_idn int
,@first_date date
,@second_date date
,@prior_date date
,@current_date date
,@last_date date
,@alpha_10 float(53) = (cast(2. as float(53))/cast(11. as float(53)))
,@alpha_30 float(53) = (cast(2. as float(53))/cast(31. as float(53)))
,@alpha_50 float(53) = (cast(2. as float(53))/cast(51. as float(53)))
,@alpha_200 float(53) = (cast(2. as float(53))/cast(201. as float(53)))

-- optionally display alpha values for computing ema values
-- with different period lengths
/*
select
 @alpha_10 [@alpha_10]
,@alpha_30 [@alpha_30]
,@alpha_50 [@alpha_50]
,@alpha_200 [@alpha_200]
*/

-- create #temp_symbol_symbol_idn based on
-- distinct symbol values from DataScience.dbo.symbol_date
drop table if exists #temp_symbol_symbol_idn;

select symbol, row_number() over (order by symbol) [symbol_idn]
into #temp_symbol_symbol_idn
from
(
-- list the distinct symbols in
select distinct symbol
from DataScience.dbo.symbol_date
) for_symbol_and_symbol_idn

-- optionally list values in #temp_symbol_symbol_idn
-- select * from #temp_symbol_symbol_idn


-- get ready to loop through symbols in #temp_symbol_symbol_idn
-- to compute emas for all symbols in #temp_symbol_symbol_idn
-- starting with symbol_idn = 1
   set @symbol_idn = 1
   set @symbol = (select symbol from #temp_symbol_symbol_idn where symbol_idn = 1)

  while @symbol_idn <= (select max(symbol_idn) from #temp_symbol_symbol_idn)
  begin
   -- compute @symbol, @first_date, @second_date, @last_date for @symbol_idn symbol
   set @symbol = (select symbol
               from #temp_symbol_symbol_idn where symbol_idn = @symbol_idn)
   set @first_date = (select min(Date)
               from DataScience.dbo.symbol_date where Symbol = @symbol)
   set @second_date = (select min(Date)
               from DataScience.dbo.symbol_date where Symbol = @symbol and date>@first_date)
   set @last_date = (select max(Date)
               from DataScience.dbo.symbol_date where Symbol = @symbol)


   -- optionally display local variables for
   -- @symbol, @first_date, @second_date, and @last_date
   /*
   select
    @symbol [@symbol]
   ,@first_date [@first_date]
   ,@second_date [@second_date]
   ,@last_date [@last_date]
   */

--/*
   -- assign ema_10, ema_30, ema_50, and ema_200 column
   -- values for first two dates in DataScience.dbo.symbol_date
   -- and store results set into #temp_symbol_date_emas
   insert into #temp_symbol_date_emas
   select
     *
    ,case
      when Date = @first_date then null
      when Date = @second_date then
       (select [close] from DataScience.dbo.symbol_date where Symbol = @symbol and Date = @first_date)
     end ema_10
    ,case
      when Date = @first_date then null
      when Date = @second_date then
       (select [close] from DataScience.dbo.symbol_date where Symbol = @symbol and Date = @first_date)
     end ema_30
    ,case
      when Date = @first_date then null
      when Date = @second_date then
       (select [close] from DataScience.dbo.symbol_date where Symbol = @symbol and Date = @first_date)
     end ema_50
    ,case
      when Date = @first_date then null
      when Date = @second_date then
       (select [close] from DataScience.dbo.symbol_date where Symbol = @symbol and Date = @first_date)
     end ema_200
   --into #temp_symbol_date_emas
   from
   (
   -- enumerate source data for a symbol
   -- where date is less than or equal to @second_date
   -- from DataScience.dbo.symbol_date
   select Symbol, Date,[close]
   from DataScience.dbo.symbol_date
   where Symbol = @symbol
   and Date <= @second_date
   ) for_first_and_second_dates


   -- optionally display #temp_symbol_date_emas for
   -- first two dates (@first_date and @second_date)
   -- select * from #temp_symbol_date_emas order by symbol, date

----------------------------------------------------------------


   -- initialize values for @prior_date and @current_date
   -- after assigning ema values for @first_date and @second_date
   set @prior_date = @second_date
   set @current_date =
    (
      select min(Date)
      from DataScience.dbo.symbol_date
      where Symbol = @symbol and date>@second_date
    )

    -- optionally display initial @prior_date and @current_date values
   --select @prior_date [@prior_date], @current_date [@current_date]


   -- while loop has a condition of @current_date <= @last_date
   -- repeat while loop for as long as the condition is true
   while @current_date <= @last_date
   begin
      -- computed emas based on current date close and prior date ema
      -- gets inserted into #temp_symbol_date_emas

      -- insert freshly computed emas into #temp_symbol_date_emas
      insert into #temp_symbol_date_emas

      -- [ema_10] through [ema_200] filtered by @current_date
      select
       for_filtering_computed_ema.symbol
      ,for_filtering_computed_ema.date
      ,for_filtering_computed_ema.[close]
      ,for_filtering_computed_ema.[computed ema_10] [ema_10]
      ,for_filtering_computed_ema.[computed ema_30] [ema_30]
      ,for_filtering_computed_ema.[computed ema_50] [ema_50]
      ,for_filtering_computed_ema.[computed ema_200] [ema_200]
      from
      (
      -- inner loop calculates ema values based on @prior_date and @current_date
      select
          symbol_date.Symbol
         ,symbol_date.Date
         ,symbol_date.[close]
         ,cast(
         (symbol_date.[close]*@alpha_10)
            +
            ((lag(ema_10,1) over (order by symbol_date.Date))*(1-@alpha_10)) as dec(19,4)) [computed ema_10]
         ,cast(
         (symbol_date.[close]*@alpha_30)
            +
            ((lag(ema_30,1) over (order by symbol_date.Date))*(1-@alpha_30)) as dec(19,4)) [computed ema_30]
         ,cast(
         (symbol_date.[close]*@alpha_50)
            +
            ((lag(ema_50,1) over (order by symbol_date.Date))*(1-@alpha_50)) as dec(19,4)) [computed ema_50]
         ,cast(
         (symbol_date.[close]*@alpha_200)
            +
            ((lag(ema_200,1) over (order by symbol_date.Date))*(1-@alpha_200)) as dec(19,4)) [computed ema_200]
      from DataScience.dbo.symbol_date
      left join #temp_symbol_date_emas
      on symbol_date.symbol = #temp_symbol_date_emas.symbol
      and symbol_date.Date = #temp_symbol_date_emas.Date
      where symbol_date.Symbol = @symbol and symbol_date.Date in (@prior_date,@current_date)
      ) for_filtering_computed_ema
      where for_filtering_computed_ema.Date = @current_date

      -- reset pointers for next prior and current dates
      set @prior_date = @current_date
      set @current_date =
       (
         select min(Date)
         from DataScience.dbo.symbol_date
         where Symbol = @symbol and date>@prior_date
       )
   end


   set @symbol_idn = @symbol_idn + 1
   set @symbol = (select symbol from #temp_symbol_symbol_idn where symbol_idn = @symbol_idn)

  end

  select * from #temp_symbol_date_emas order by symbol, date
The following pair of screenshots show the first ten rows of ema values for the DIA ticker symbol as well as the last ten rows of ema values for the UDOW ticker symbol.

Next Steps
There are two broad next steps for this tip:
- First, verify that you can implement the code samples described in this tip or at least the example closest to your requirement. You can do this by inserting the CSV file in the download for this tip into a table like the one named DataScience.dbo.symbol_date. Then, run one or more samples and confirm that you are getting the same results shown in the article.
- Second, repopulate the DataScience.dbo.symbol_date table with ticker symbols you use in an analytics project or with business data for which you want to calculate exponential moving averages.
This tip concludes with the observation that the method for computing ema values in this tip seems to work demonstrably faster than any preceding tip describing how to compute ema values with T-SQL. The degree of the performance enhancement is sufficiently large as to merit revisiting this topic to identify more precisely the degree of the performance impact as well as the reason for it. For example, it may be that non-relational tables for time series data, when processed by while loops, can sometimes yield performance enhancements relative to relational table for time series data.

Rick Dobson is a SQL Server professional with decades of T-SQL experience that includes authoring books, running a national seminar practice, working for businesses on finance and healthcare development projects, and serving as a regular contributor to MSSQLTips.com. He has been a practicing Python developer for more than the past half decade – with a special emphasis for data visualization and ETL tasks with JSON and CSV files. His most recent professional passions include financial time series data and analyses, AI models, and statistics. If you are interested in growing your skills in any of these areas especially as they relate to financial securities, consider visiting his blog at https://securitytradinganalytics.blogspot.com/2023/12/.
- MSSQLTips Awards: Leadership (200+ tips) – 2025 | Author of the Year Contender – 2017-2024