Problem
Please demonstrate the steps for updating an existing time series dataset used in a prior data mining project with a fresh batch of data. Then, repeat the mining performed for the original dataset with the freshly updated dataset. Also, present and describe T-SQL scripts for computing growth rates for time series in both the original and updated datasets.
Solution
A prior MSSQLTips.com article (SQL Server Data Mining for Leveraged Versus Unleveraged ETFs as a Long-Term Investment) demonstrated how to build a dataset with two types of time series – namely, unleveraged ETFs versus leveraged ETFs based on major market indexes. In total, the article tracked six ETFs: three unleveraged ETFs and three corresponding leveraged ETFs. The prior article also computed the growth rates for each ETF to compare the performance of unleveraged versus leveraged. The leveraged ETFs yielded consistently superior growth from their initial launch dates through November 30, 2022, the last date data were collected. The launch date is the first time an ETF is available for public trading.
This tip demonstrates how to add 10 months of additional trading day data (from the first trading day in December 2022 through the last trading day in September 2023) to the original dataset from the prior tip. It then compares the growth rates from the initial tip, comparing unleveraged and leveraged ETFs to the growth rates computed based on the updated data in this tip. The mining aims to answer two questions:
- Are the long-term growth rates better or worse for unleveraged versus leveraged ETFs?
- Are the growth rates relatively stable when fresh data are added to the time series dataset?
An additional two technical topics are covered within this tip. First, it covers in a step-by-step manner how to download and import historical securities prices from Yahoo Finance and how to migrate the downloaded data to a SQL Server table. Second, it reveals a new T-SQL approach for computing Compound Annual Growth Rate (CAGR) for time series data than was used in prior tips (Revisiting Time Series Model Performance Assessment with T-SQL and Assessing Time Series Model Performance with T-SQL) that may be more transparent to SQL Server professionals.
More about ETFs
An ETF represents a set of one or more underlying securities or an index.
- An unleveraged ETF has its price change during each trading day by the same percentage as the prices for its set of underlying securities or index.
- A leveraged ETF has its price change during a trading day by a factor times the percentage change for the securities or index in its set. All the leveraged ETFs in this tip have leveraging factors of three. Therefore,
- if the price for the underlying basket for an ETF increased by 1% during a trading day, then the ETF’s price would increase by 3% on the same trading day
- if the underlying basket for an ETF decreased by 1% during a trading day, then the ETF’s price would decrease by 3% on the same trading day
Because of compounding for percent change in daily prices and other issues relating to the management of ETFs, it is possible for leveraged ETFs to rise or fall much more quickly than their comparable unleveraged ETFs. Many financial analysts (Leveraged ETFs: What They Are & How They Work| 3 Triple-Leveraged ETFs, and Why You Shouldn’t Buy Any of Them | Volatility decay: don’t hold leveraged ETFs long-term | What Is a Leveraged ETF?) assert that the opportunity for prices to drop more quickly for leveraged ETFs versus unleveraged ETFs makes leveraged ETFs unsuitable for long-term investments. When writing about leveraged versus unleveraged ETFs, financial analysts commonly consider hypothetical examples of gains and losses. This tip differs from the four cited sources because it empirically computes and evaluates returns from three pairs of ETF securities where each pair is based on actual gains and losses for an underlying index series (namely, the S&P 500 index, the NASDAQ 100 index, and the Dow Jones Industrial Average index). Furthermore, the indexes are tracked over timeframes from around a decade to around three decades. The exact timeframe duration depends on the initial launch date for an ETF through either November 30, 2022, or September 29, 2023 (depending on whether the data are from the initial or current tip on mining time series datasets).
How to Download Historical Data from Yahoo Finance
It is possible to find many programmatic examples that claim to enable the downloading of historical price and volume data from Yahoo Finance and other sources without charge. I have tested for more than half a decade many of these programmatic solutions for downloading historical price and volume data, but they all seem to fail (after sometimes initially working successfully before they eventually fail). I am guessing that Yahoo Finance prefers users to access their data via manual means.
Over about the same timeframe as my testing of programmatic means for downloading historical price and volume data, I also used a manual process to download price and volume from the Yahoo Finance manual interface. This section describes and illustrates selected steps for a manual approach and presents sample results. The manual approach works as of the time this tip is prepared, and it has worked over the past five years or so.
- Go to Yahoo Finance and search for the ticker symbol of a stock or an ETF
- Click the “Historical Data” menu item
- Select start and end dates from the “Time Period” control
- If the default frequency is not the one that you seek, click the “Frequency” control; you can choose daily, weekly, or monthly from a drop-down list box
- Click the “Apply” button
- Finally, click the “Download” button to transfer a CSV file (in a Unix – not Microsoft – style) from Yahoo Finance to your workstation
Here are screenshots illustrating key points for walking through the preceding steps.
This initial screenshot shows the URL for Yahoo Finance in a browser window. After getting to Yahoo Finance, you can enter the ticker symbol that points to a financial security for which you want to collect historical prices. The SPY ticker is for a popular unleveraged ETF for the S&P 500 index.

The next screenshot reveals the Yahoo Finance interface after a click on the Historical Data menu item (the item appears highlighted to reflect that it was clicked).
- By clicking the “Time Period” control, you can pick start and end dates for the return of historical price and volume data for the SPY ticker
- By clicking the “Frequency control,” you can pick the return of historical data on a daily, weekly, or monthly basis
- By clicking the “Show” control, you can designate the return of historical prices (and volumes), dividends only, stock splits, or capital gains
- By clicking the “Apply” button, you can review your selections in the browser window
- By clicking the “Download” control, you can pass a CSV file with the requested data from Yahoo Finance to the download folder on your workstation

The following screenshot shows the first control to display after you click the “Time Period” control in the preceding screenshot. By clicking the calendar icons, you can visually specify start and end dates for historical data to download from Yahoo Finance to the download folder on your workstation. The start date and end date settings for this example in the current tip are to collect historical data for all trading days in September 2023. The start date should be set to the first trading day for which you seek historical data: Friday, September 1, 2023. The end date should be the calendar day after the last trading day you seek historical data. Because the last trading day in September 2023 is Friday, September 29, the end date should be set to September 30, 2023.

The next screenshot displays an excerpt from a download folder in Windows Explorer with an overlay of a Notepad++ session that shows the first six rows from the highlighted file in Windows Explorer.
- The downloaded file has a name of SPY (9)
- Yahoo Finance automatically names the downloaded file based on the ticker for which historical data is requested
- Windows adds “(9)” to the filename because, at the time of download, there were eight previous file requests for historical data for the SPY ticker in the download folder
- By examining the display in the Notepad++ session
- You can verify that the first data row has a date of 09/01/2023, which corresponds to the “Time Period” control Start Date setting in the preceding screenshot
- Additionally, each line in the file ends with a single linefeed (LF) instead of the traditional linefeed and carriage return (LF)(CR) that is standard format for Microsoft CSV files. The alternate format of a single linefeed as a row terminator follows the UNIX style for CSV files
- An attempt to load the CSV file with the T-SQL bulk insert statement into a SQL Server table needs to reflect the style of CSV file being used to import the file into SQL Server

The final screenshot illustrating how to import historical data from Yahoo Finance to a CSV file appears next.
- The image below displays the last six rows of historical data.
- The bottom border of the following image indicates there are twenty-one lines in the CSV file
- an initial line for the row of column header names
- followed by twenty lines for the trading days in September 2023
- 20 rows of trading day data from September 1, 2023 through September 29, 2023, which is the last trading day in September of 2023
- The date value for the last row is 2020-09-29, which is the date of the last trading day in September 2023

The Data Sources for this Tip
The data for this tip has two main parts. The first part is a SQL Server table named symbol_date. The first part consists of the historical prices dataset mined and reported on in the predecessor tip to the current tip. The second part consists of a smaller, more recent set of historical prices. The current tip appends the smaller set of historical prices to the predecessor tip’s dataset. Then, the next section computes, displays, and charts a price growth indicator (CAGR) for ETFs from the dataset in the current tip versus those in the predecessor tip.
Here is a short script that can create the symbol_date table.
- The script starts with a use statement to designate a SQL Server database (DataScience) to create the table. You can change the database name in the script to relocate the table in a database of your choice
- The create table statement designates a table name and column names for the table in the default database specified by the use statement. An embedded primary key constraint in the create table statement arranges the table’s data by symbol and date values
- In the application for the predecessor and current tips, the source data from Yahoo Finance is available as one file per symbol, but our final SQL Server table contains data for multiple symbols in a single table
- As a consequence, the symbol for each file must be inserted along with the column data for a file into the symbol_date table
- Also, there is no Adj Close column in the symbol_date table for the Adj Close column in the data downloaded by Yahoo Finance
- To accommodate these incompatibilities, the Yahoo Finance download files are inserted into an empty intermediate table, manipulated so that the data format and contents match the target table (symbol_date), and finally inserted into the target table
-- prepared by Rick Dobson for MSSQLTips.com

use DataScience
go

create table [dbo].[symbol_date](
   [Symbol] [nvarchar](10) NOT NULL,
   [Date] [date] NOT NULL,
   [Open] [decimal](19, 4) NULL,
   [High] [decimal](19, 4) NULL,
   [Low] [decimal](19, 4) NULL,
   [Close] [decimal](19, 4) NULL,
   [Volume] [float] NULL,
 constraint [pk_symbol_date_test] PRIMARY KEY CLUSTERED ([Symbol] ASC,[Date] ASC)
 )
The next section will mine the appended dataset developed in this section using a CAGR metric, which assesses the average annual growth of a time series over a timeframe. The timeframe varies across symbols. This is because not all six ETFs tracked in the current and predecessor tips have the same launch date.
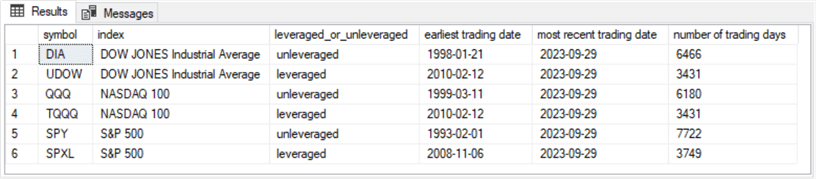
The following table was created and populated for the dataset in the predecessor tip. Recall that the predecessor tip collected data from Yahoo Finance for each of the six ETFs. The following screenshot presents an overview of the contents of the symbol_date table.
- The symbol column denotes the ticker for each of the six tracked ETFs
- The index column names the major market index on which each ETF is based
- The leveraged_or_unleveraged column specifies whether an ETF is leveraged or unleveraged
- The dates in the earliest trading date column indicate the launch date for each ETF
- The date value that repeats for each ETF in the most recent trading date column indicates the end date for which historical price data is available in the dataset from the dataset from the predecessor tip

Examining the predecessor tip’s download, you can find the CSV file from Yahoo Finance for each ETF. The predecessor tip’s download also includes T-SQL scripts for transferring the CSV file contents to the symbol_date table.
The second part adds downloaded data from Yahoo Finance for each of the six tickers in the preceding screenshot to the symbol_date table.
The fresh data begins with the first trading date in December 2022 and ends with the last trading date in September 2023. There are 208 trading days of data for each ticker in the fresh data’s timeframe.
- The script starts by referencing a default database — namely DataScience. However, you can change the default database name to whatever database holds the symbol_date table in your environment
- There are three steps to the script for appending the fresh data for each ETF ticker in the symbol_date table. These three steps are repeated with slight modifications for each ticker. A line of comment markers separates the repeated code for each ticker
- For the first step,
- The code creates for the first ETF ticker (SPY) a fresh version of the dbo.from_yahoo table
- For each of the remaining ticker symbols, the first step merely truncates the dbo.from_yahoo table created when processing the first ETF ticker
- For the second step,
- A bulk insert statement transfers the historical price dataset file downloaded from Yahoo Finance for a ticker symbol to the dbo.from_yahoo table
- The bulk insert statement has several parameter settings
- The initial parameter designates the SQL Server table name to receive the contents of a downloaded file; the table receiving the downloaded file contents is dbo.from_yahoo for all ETF tickers
- The second parameter is for the from clause of the bulk insert statement; this parameter designates the path name and filename for the current ETF ticker
- Path name in the example below is ‘C:\DataScienceSamples\ETF_Comps\’; this is wherever you copied the downloaded CSV for a ticker that is initially copied to the download folder on your workstation
- The filename varies based on the ticker for the downloaded file
- For the SPY ticker, the filename is SPY_from_yahoo_on_09_29_2023.csv
- For the SPXL ticker, the filename is SPXL_from_yahoo_on_09_29_2023.csv
- the filenames for the remaining tickers follow the same pattern
- The filenames start with the ticker symbol, such as QQQ, TQQQ, DIA, or UDOW,
- And filenames end with _from_yahoo_on_09_29_2023.csv
- The third parameter, firstrow, designates the first data row in the downloaded CSV file; this is always 2 in this example because the first row contains column headers – not data rows
- The fourth parameter, fieldterminator, is always ‘,’ because the code is for a CSV (comma separated value) file
- The fifth parameter, rowterminator, is always ‘0x0a’ because Yahoo Finance downloads historical data in a UNIX style
- For the third step, the code inserts into the dbo.symbol_date table, the results set from a select statement based on the dbo.from_yahoo table,
- The first select list item is for the current ticker of a block of code; in the sample below, the code blocks are successively for SPY, SPXL, QQQ, TQQQ, DIA, and UDOW
- The select statement also omits the ADJ Close column
- For the first step,
-- prepared by Rick Dobson for MSSQLTips.com

use DataScience
go

-- create a fresh copy of dbo.from_yahoo
drop table if exists dbo.from_yahoo

create table dbo.from_yahoo(
   [Date] [date] NULL,
   [Open] dec(19,4) NULL,
   [High] dec(19,4) NULL,
   [Low] dec(19,4) NULL,
   [Close] dec(19,4) NULL,
   [ADJ Close] dec(19,4) NULL,
   [Volume] float NULL
)
go


-- bulk insert raw download for SPY
-- into a fresh copy of dbo.from_yahoo
bulk insert dbo.from_yahoo
from 'C:\DataScienceSamples\ETF_Comps\SPY_from_yahoo_on_09_29_2023.csv'
with
(
    firstrow = 2,
    fieldterminator = ',',  --CSV field delimiter
    rowterminator = '0x0a'  -- for lines ending with a lf and no cr
)

-- optionally echo bulk insert output
-- and original dbo.symbol_date for SPY
-- select * from dbo.from_yahoo
-- select * from dbo.symbol_date where symbol = 'SPY'

-- populate symbol_date with contents for SPY
insert into dbo.symbol_date
select
 'SPY' symbol
,cast([date] as date)
,[open]
,[high]
,[low]
,[close]
,[volume]
from dbo.from_yahoo

-- optionally echo transferred data from dbo.from_yahoo for SPY
 select * from dbo.symbol_date where symbol = 'SPY'

----------------------------------------------------------------------------------------------------------

truncate table dbo.from_yahoo

-- bulk insert raw download for SPXL into dbo.from_yahoo
bulk insert dbo.from_yahoo
from 'C:\DataScienceSamples\ETF_Comps\SPXL_from_yahoo_on_09_29_2023.csv'
with
(
    firstrow = 2,
    fieldterminator = ',',  --CSV field delimiter
    rowterminator = '0x0a'  -- for lines ending with a lf and no cr
)

-- optionally echo bulk insert output
-- and original dbo.symbol_date for SPXL
-- select * from dbo.from_yahoo
-- select * from dbo.symbol_date where symbol = 'SPXL'

-- populate symbol_date with contents for SPXL
insert into dbo.symbol_date
select
 'SPXL' symbol
,cast([date] as date)
,[open]
,[high]
,[low]
,[close]
,[volume]
from dbo.from_yahoo

-- optionally echo transferred data from dbo.from_yahoo for SPY
 select * from dbo.symbol_date where symbol = 'SPXL'

----------------------------------------------------------------------------------------------------------

truncate table dbo.from_yahoo

-- bulk insert raw download for QQQ into dbo.from_yahoo
bulk insert dbo.from_yahoo
from 'C:\DataScienceSamples\ETF_Comps\QQQ_from_yahoo_on_09_29_2023.csv'
with
(
    firstrow = 2,
    fieldterminator = ',',  --CSV field delimiter
    rowterminator = '0x0a'  -- for lines ending with a lf and no cr
)

-- optionally echo bulk insert output
-- and original dbo.symbol_date for QQQ
-- select * from dbo.from_yahoo
-- select * from dbo.symbol_date where symbol = 'QQQ'

-- populate symbol_date with contents for QQQ
insert into dbo.symbol_date
select
 'QQQ' symbol
,cast([date] as date)
,[open]
,[high]
,[low]
,[close]
,[volume]
from dbo.from_yahoo

-- optionally echo transferred data from dbo.from_yahoo for SPY
 select * from dbo.symbol_date where symbol = 'QQQ'

----------------------------------------------------------------------------------------------------------

truncate table dbo.from_yahoo

-- bulk insert raw download for TQQQ into dbo.from_yahoo
bulk insert dbo.from_yahoo
from 'C:\DataScienceSamples\ETF_Comps\TQQQ_from_yahoo_on_09_29_2023.csv'
with
(
    firstrow = 2,
    fieldterminator = ',',  --CSV field delimiter
    rowterminator = '0x0a'  -- for lines ending with a lf and no cr
)

-- optionally echo bulk insert output
-- and original dbo.symbol_date for TQQQ
-- select * from dbo.from_yahoo
-- select * from dbo.symbol_date where symbol = 'TQQQ'

-- populate symbol_date with contents for TQQQ
insert into dbo.symbol_date
select
 'TQQQ' symbol
,cast([date] as date)
,[open]
,[high]
,[low]
,[close]
,[volume]
from dbo.from_yahoo

-- optionally echo transferred data from dbo.from_yahoo for SPY
 select * from dbo.symbol_date where symbol = 'TQQQ'

----------------------------------------------------------------------------------------------------------

truncate table dbo.from_yahoo

-- bulk insert raw download for DIA into dbo.from_yahoo
bulk insert dbo.from_yahoo
from 'C:\DataScienceSamples\ETF_Comps\DIA_from_yahoo_on_09_29_2023.csv'
with
(
    firstrow = 2,
    fieldterminator = ',',  --CSV field delimiter
    rowterminator = '0x0a'  -- for lines ending with a lf and no cr
)

-- optionally echo bulk insert output
-- and original dbo.symbol_date for DIA
-- select * from dbo.from_yahoo
-- select * from dbo.symbol_date where symbol = 'DIA'

-- populate symbol_date with contents for DIA
insert into dbo.symbol_date
select
 'DIA' symbol
,cast([date] as date)
,[open]
,[high]
,[low]
,[close]
,[volume]
from dbo.from_yahoo

-- optionally echo transferred data from dbo.from_yahoo for SPY
 select * from dbo.symbol_date where symbol = 'DIA'

----------------------------------------------------------------------------------------------------------

truncate table dbo.from_yahoo

-- bulk insert raw download for UDOW into dbo.from_yahoo
bulk insert dbo.from_yahoo
from 'C:\DataScienceSamples\ETF_Comps\UDOW_from_yahoo_on_09_29_2023.csv'
with
(
    firstrow = 2,
    fieldterminator = ',',  --CSV field delimiter
    rowterminator = '0x0a'  -- for lines ending with a lf and no cr
)

-- optionally echo bulk insert output
-- and original dbo.symbol_date for UDOW
-- select * from dbo.from_yahoo
-- select * from dbo.symbol_date where symbol = 'UDOW'

-- populate symbol_date with contents for UDOW
insert into dbo.symbol_date
select
 'UDOW' symbol
,cast([date] as date)
,[open]
,[high]
,[low]
,[close]
,[volume]
from dbo.from_yahoo

-- optionally echo transferred data from dbo.from_yahoo for SPY
 select * from dbo.symbol_date where symbol = 'UDOW'
Here is a summary of the symbol_date table after adding the rows from the preceding script. The summary was prepared with the same code used to summarize the symbol_date table before adding a fresh 208 trading days of data for each ticker.
- Notice that the number of trading days for each ticker in the following results set has 208 more trading days than the preceding results set for the symbol_date table before the running of the preceding script
- Furthermore, the most recent trading date in the following results set is 2023-09-29. This differs from the most recent trading date of 2022-11-30 in the following results set
Computing and Analyzing CAGR Values
This section briefly reviews the formula for computing the compound annual growth rate (CAGR) with a special emphasis on how to compute it in SQL Server. The CAGR is the average annual rate of return to change a start balance to an end balance over a timeframe. The CAGR is widely used in finance to compare two investments, such as whether a leveraged ETF has a greater annual rate of return than its analogous unleveraged rate of return over a number of years.
The algebraic expression to compute the CAGR is:
((EndBalance/StartBalance) ^ (1/number of years)) -1
The number of years value can be an integer or decimal value. If you computed the CAGR over a three-year period, then the number of years is 3. However, if you computed the CAGR over a three-and-a-half-year period, the number of years is 3.5.
In the context of the current tip, CAGR values are compared for six ETFs over two different timeframes. The timeframe for the current tip ends on September 29, 2023. The timeframe for the predecessor tip ends on November 30, 2022. The six ETFs are segmented into two segments. One segment is for unleveraged ETFs (DIA, QQQ, SPY) based on three major market indexes (Dow Jones Industrial Average, NASDAQ 100, S&P 500). A second segment is also based on the same three major market indexes, but the three ETFs (UDOW, TQQQ, SPXL) in this segment are triple-levered relative to their underlying indexes.
The T-SQL script in the current tip computes CAGR values based on the same underlying formula as the predecessor tip, but a different coding strategy is used in this tip relative to the predecessor tip. At a broad overview level,
- The predecessor tip computes a set of local variables for computing CAGR values for ETF tickers – this scalar-based approach may be easier to follow for finance professionals.
- The current tip populates a pair of temporary tables containing source values for a third select statement that computes the CAGR values for ETF tickers – this table-based approach may be easier for SQL Server professionals to follow.
Here is the script to compute CAGR values in the current tip. The first part is separated from the second part, and the second part is separated from the third part by a line of comment markers.
- The first part begins with a pair of drop table if exists statements to create fresh versions of the #temp_date_stuff and #temp_for_cagr_inputs tables
- The main objective of the first part is to populate the [years between start and end dates] column values in the #temp_date_stuff table
- The main objective of the second part is to develop inputs for computing CAGR values for computing each ETF ticker. This part includes joining the #temp_date_stuff table with the symbol_date table
- The third part rearranges the inputs developed in the second part as it computes CAGR values for each ticker. A significant operation performed in part is to arrange via a T-SQL lead function start_value and end_values on the same row and to suppress unnecessary rows and columns in its results set
-- prepared by Rick Dobson for MSSQLTips.com

-- drop any prior versions of #temp_date_stuff and #temp_for_cagr_inputs tables
drop table if exists #temp_date_stuff
drop table if exists #temp_for_cagr_inputs

-- compute values for #temp_date_stuff
select
 symbol
,
 case
   when symbol in ('DIA', 'UDOW') then 'DOW JONES Industrial Average'
   when symbol in ('QQQ', 'TQQQ') then 'NASDAQ 100'
   WHEN symbol in ('SPY', 'SPXL') THEN 'S&P 500'
 end [index]
,
 case
   when symbol in ('DIA', 'QQQ', 'SPY') then 'unleveraged'
   when symbol in ('UDOW', 'TQQQ', 'SPXL') then 'leveraged'
 end leveraged_or_unleveraged
,min(date) [least recent date]
,max(date) [most recent date]
,count(*) [number of trading days]
,datediff(month,min(date),max(date)) +1 [months between dates]
,cast((datediff(month,min(date),max(date)) +1) as float)/12 [years between start and end dates]
into #temp_date_stuff
from DataScience.dbo.symbol_date
group by symbol
order by
 case
   when symbol in ('DIA', 'UDOW') then 'DOW jONES Industrial Average'
   when symbol in ('QQQ', 'TQQQ') then 'NASDAQ 100'
   WHEN symbol in ('SPY', 'SPXL') THEN 'S&P 500'
 end
,case
 when symbol in ('DIA', 'QQQ', 'SPY') then 'unleveraged'
 when symbol in ('UDOW', 'TQQQ', 'SPXL') then 'leveraged'
 end desc
,symbol

-- optionally display #temp_date_stuff
select * from #temp_date_stuff

---------------------------------------------------------------------------

-- compute #temp_for_cagr_inputs based on
-- #temp_date_stuff and DataScience.dbo.symbol_date
select
 a.symbol
,a.[least recent date] for_start_close
,a.[most recent date] for_end_close
,a.[years between start and end dates]
,b.date
,b.[close]
,
 case
   when a.[least recent date] = b.date then b.[close]
   else null
 end start_value
,
 case
   when a.[most recent date] = b.date then b.[close]
   else null
 end end_value

into #temp_for_cagr_inputs
from #temp_date_stuff a

join

DataScience.dbo.symbol_date b

on a.symbol = b.Symbol

where
 (
 (a.[least recent date] = b.date) or
 (a.[most recent date] = b.date)
 )

-- optionally display #temp_for_cagr_inputs
select * from #temp_for_cagr_inputs

---------------------------------------------------------------------------

-- compute cagr values from #temp_for_cagr_inputs
select *
from
(
-- move end_value row to corresponding start_value row
-- and remove start_value rows with null values (end_values are also null)
-- remove unnecessary columns for cagr computation
select *
from
(
select
 symbol
,for_start_close [start_date]
,for_end_close [end_date]
,[years between start and end dates]
,start_value
,lead(end_value,1) over (partition by symbol order by date) [end_value]
,  round(
  (power((lead(end_value,1) over (partition by symbol order by date)/start_value),(1.0/[years between start and end dates]))-1)
  *100,2) CAGR
from #temp_for_cagr_inputs
) for_cagr_inputs
where start_value is not null
) for_cagr_computation
Perhaps the best way to understand the preceding script is to examine the three results in the following screenshot. Notice there are three results sets – one for each part of the script.
- The column in the far right of the first results set is populated with years between the start and end dates. Recall that this value is needed for an exponential term to compute CAGR values
- The last two columns in the second results set display start_value and end_value quantities for each ticker symbol. These values appear in separate rows for each ticker symbol because they are in separate rows within one of the sources (dbo.symbol_date) to the second part. The ratio of the end_value to the start_value is another key input to the CAGR expression
- The last column in the third results set computes and displays the CAGR value for each ETF ticker symbol

Now, let’s quickly look at the CAGR values from the predecessor and current tips.
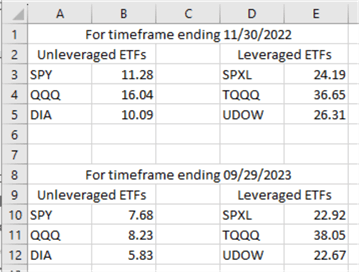
The following screenshot shows unleveraged CAGR values versus the leveraged CAGR values for the data ending November 30, 2022 and September 29, 2023. The CAGR values for the timeframe ending on 09/29/ are from the third results set in the preceding screenshot. The CAGR values for the timeframe ending on 11/30/2022 are reported in the predecessor tip to the current tip.
- The leveraged CAGR values are substantially larger than unleveraged CAGR values
- This relationship holds even when 10 additional months of trading date data are added to the data ending November 30, 2022
The following screenshot examines the relationship between CAGR values from data ending November 30, 2020, and September 29, 2023. This display omits any explicit examination of leveraged versus unleveraged CAGR values. The line through the scatter chart is for corresponding ETFs. The screenshot shows that the relationships across ETFs are highly consistent across the original dataset from the predecessor tip and the current tip, which adds 10 months of trading date data to the predecessor dataset.

Next Steps
The next steps suggested by this tip can take you in any of at least five different directions.
- First, see if you can retrieve the base data from the predecessor tip and re-create (or at least copy) the reported CAGR values from the predecessor tip. The download from the predecessor tip contains CSV files with historical prices in the original dataset. Use this dataset to initially populate the symbol_date table
- Second, load the historical prices for the current tip into a SQL Server table. The CSV files with historical data for the current tip are in this tip’s download. Then, use some code from the “The data sources for this tip” section to append the fresh historical prices to the symbol_date table with historical prices from the predecessor tip
- Third, compute the CAGR values for the symbol_date table from the predecessor tip as well as from the current tip
- Fourth, confirm that your computed CAGR values match those reported in the “Computing and analyzing CAGR values” section of this tip
- Finally, download historical prices from Yahoo Finance for additional tickers that interest you. If you would like some suggestions, consider examining the close price growth rates for TSLA, NVDA, and MSFT. These three tickers have robust growth rates relative to tickers for other stocks

Rick Dobson is a SQL Server professional with decades of T-SQL experience that includes authoring books, running a national seminar practice, working for businesses on finance and healthcare development projects, and serving as a regular contributor to MSSQLTips.com. He has been a practicing Python developer for more than the past half decade – with a special emphasis for data visualization and ETL tasks with JSON and CSV files. His most recent professional passions include financial time series data and analyses, AI models, and statistics. If you are interested in growing your skills in any of these areas especially as they relate to financial securities, consider visiting his blog at https://securitytradinganalytics.blogspot.com/2023/12/.
- MSSQLTips Awards: Leadership (200+ tips) – 2025 | Author of the Year Contender – 2017-2024