Problem
As defined by Microsoft, Azure Databricks “… is an Apache Spark-based analytics platform optimized for the Microsoft Azure cloud services platform. Designed with the founders of Apache Spark, Databricks is integrated with Azure to provide one-click setup, streamlined workflows, and an interactive workspace that enables collaboration between data scientists, data engineers, and business analysts.”
As the modern data landscape continues to grow and evolve, and data becomes more proliferous, organizations are investing in the growth of their data departments in order to garner maximum value from it. The result is many different types of data personas within an organization: Data Engineers, Data Analysts, and Data Scientists, to name a few. The power of Azure Databricks is that it offers a single interface for your Data Engineers to write ETL, your Data Analysts to write ad hoc queries, your Data Scientists to build machine learning models, and much more. This is all done using the languages they are comfortable with (Python, SQL, Scala, R), and seamlessly integrating with many different data sources, both on-premises and in the cloud.
The following article will delve into the basics of setting up a Databricks workspace within Azure, and using it to gain instant insights on some data loaded in from a CSV.
Solution
Getting Started with Azure Databricks
The solution below assumes that you have access to a Microsoft Azure account and an Azure subscription with credits available for testing services. If you are on a trial account, you will not be able to build the cluster due to core quota limits. You can request an increase in that quota as long as you have a pay-as-you-go subscription set up.
To use a free account to create the Azure Databricks cluster, before creating the cluster, go to your profile and change your subscription to pay-as-you-go. For more information, see Azure free account.
Creating a Databricks Workspace
The first step to using Databricks in Azure is to create a Databricks Workspace. You can think of the workspace like an application that you are installing within Azure, where you will access all of your Databricks assets.
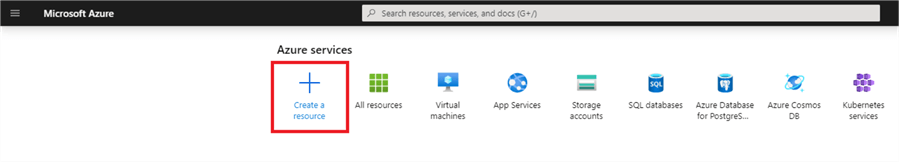
On the Azure home screen, click ‘Create a Resource’.
In the ‘Search the Marketplace’ search bar, type ‘Databricks’ and select ‘Azure Databricks’.
Click ‘create’ to start building your workspace.

If you do not have an existing resource group to use, click ‘Create new’. A resource group is a logical container to group Azure resources together. Name it something like ‘intro-databricks-rg’. Next, enter a workspace name. Remember to always stick to naming standards when creating Azure resources, but for now enter whatever you would like. You can keep the location as whatever comes default, or switch it to a region closer to you. For the pricing tier, select ‘Trial’. Finally, select ‘Review and Create’. We can skip networking and tags for now, which are for more advanced set-ups.

This should bring you to a validation page, where you can click ‘create’ to deploy your workspace. A deployment page will open, and the creation of the workspace should only take a couple minutes. When it succeeds, you should see the following:

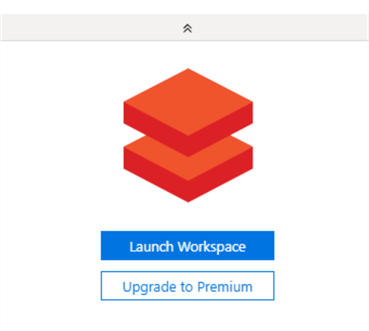
Once the deployment is complete, click ‘Go to resource’, and then click ‘Launch Workspace’ to enter the Databricks workspace.
Navigating the Databricks Workspace
The landing page of the Databricks Workspace should look like this:

On the left-hand side of the page you should see the navigation pane. This is pinned to the workspace, and will always be accessible no matter where you are in the workspace.

- Home: Takes you to your own personal folder within the workspace, where you can store your own notebooks.
- Workspace: Brings up a ‘file system’ where you can organize your notebooks into logical groupings. By default, there is a ‘Shared’ folder and a ‘Users’ folder. The ‘Shared’ folder is where collaborative notebooks can be stored, and the ‘Users’ folder will have a folder for each user who has access to the workspace. You can set permissions on these directories to control who has access to what locations, for cases where there is sensitive information you need to secure.
- Recents: Brings up a list of recently accessed notebooks that you have been working on.
- Data: Shows data you have declared within Databricks (databases and tables). By default, you will need to create a running cluster to see any data here.
- Clusters: The page where you can create, modify, and maintain Spark clusters in a simple GUI.
- Jobs: The place where you can see all configured jobs and job runs. A Job is a notebook set to run based on a trigger (via a REST call, on a schedule, or invoked via Azure Data Factory, just to name a few).
- Models: Using ML flow, you can manage deployed machine learning models through this interface.
- Search: A search module for your workspace.
On the main screen of the workspace, you will see three columns. These are quick links to jump right into coding:

The first column has a list of common tasks so that you can jump right into whatever you would like to work on – whether that is creating a new notebook, new cluster, new job, etc. There is also a QuickStart tutorial that will help you create a cluster and query some pre-loaded data.
The middle column has a quick link to load data, and below that displays recent notebooks you have worked on.
The last column has a quick link to create a new notebook as well as links to the key Databricks documentation.
Creating a Simple Cluster
The next step is to create a simple cluster, which will act as the ‘compute’ for any of the code we are writing. This is the power of the modern cloud computing with massive parallel processing (MPP) systems – separation of compute and storage. You can scale these separately and they have no bearing on each other, allowing you to scale much quicker and more efficiently.
The beauty of creating clusters in Databricks is that it is as easy as filling out a few key fields and clicking ‘Create’. The Spark cluster is built and configured on Azure VMs in the background and is nearly infinitely scalable if you need more power. Setting up your own custom Spark cluster is difficult, and tedious at best. Databricks abstracts this, and manages all of the dependencies, updates, and backend configurations so that you can focus on coding.
On the home page of your workspace, click the ‘New Cluster’ link to get started.

Exploring the options for creating clusters could be a tip unto itself, so for now let’s fill out the options with some simple configurations, as seen below:

Once you have filled everything out, click ‘Create Cluster’ in the top right-hand corner, and Databricks will take care of the rest!
The create process takes around 5-10 minutes, and once complete, you should see the following screen, with a green dot next to your cluster, indicating that it is active.

To terminate, start, and manage your cluster, you can click on it, which brings you into the cluster management screen as follows:

Remember, we set our ‘Terminate after’ field to 20 minutes, so if the cluster is idle for 20 minutes, it will auto shutdown. This is to save money, because you are paying for every minute the cluster is running!
Loading a CSV of Sample Data
The next step is to load some sample data. For this tutorial, we will stick with current events, and use some COVID-19 data from Kaggle.
Kaggle is a data science community which hosts numerous data sets for people learning data science and data analytics. I definitely recommend creating an account and using this website whenever you are in need of sample data.
In this example, we’ll be using the ‘Uncover COVID-19 Challenge’ data set. To get the necessary files, select the following link, create a Kaggle account, and click ‘Download’.
https://www.kaggle.com/roche-data-science-coalition/uncover/data#

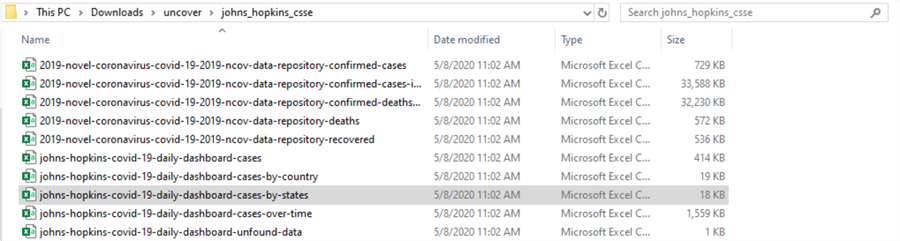
This will download a zip file called ‘uncover.zip’. Unzip the folder, navigate to ‘john_hopkins_case’ (path shown below), and copy the csv ‘johns-hopkins-covid-19-daily-dashboard-cases-by-states’ to your desktop.
Next, navigate back to your home screen in Databricks using the Azure Databricks icon in the top left-hand corner of the screen:

From here, click ‘click to browse’ to instantly upload some data. There are many ways to import data into Databricks, but for now we are going to use the GUI approach.

Navigate to the John Hopkins CSV and click ‘open’.
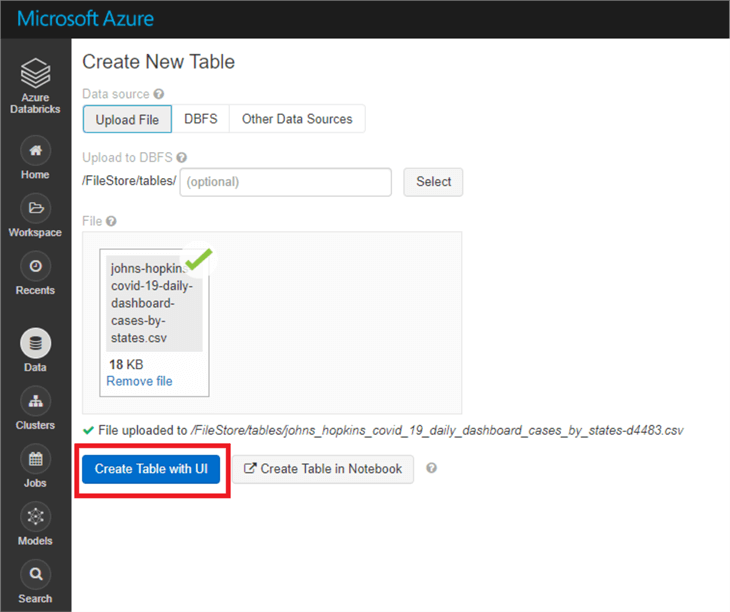
This will bring you to a ‘Create new table’ page. We will be uploading the data to ‘DBFS’, which stands for Databricks File System. DBFS is auto-configured storage backed by Azure Blob (binary large object storage) for storing basic data for access in Databricks. The data source should already be filled out for you, and you can specify your own folder path in DBFS if you want. For now, just click ‘Create Table with UI’.
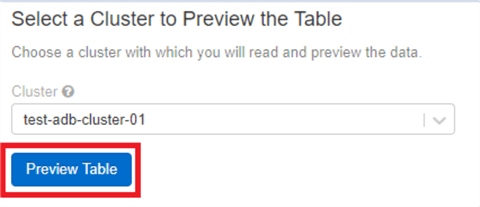
You will be prompted to pick a cluster to preview the table – select the cluster you just created and click ‘Preview Table’.
This brings up a preview of the data you are about to load with options to specify table attributes on the left-hand side. Fill out the fields as shown here. You will notice that we now have the proper header column and data types. One you are happy with how the table looks, click ‘Create Table’.

This should bring you to a page showing the schema of the new table, and some sample data. You can now also see the table by navigating the ‘Data’ tab on the navigation pane on the left. You will see the data was added to our default database:

You can create your own databases for logically storing data, but keep in mind this is not a database as we typically conceptualize one. It is all meta-data driven, and does not physically store data as a normal database would. Data can be spread across multiple sources, given that it is all meta-data driven. I will dive into this further in a future tip.
Creating a Databricks Notebook and Query the Data
The next step is to create a notebook to query the data. Navigate back to the home screen, and click ‘New notebook’.

Name the notebook ‘covid19-analysis’, keep the language as Python (I will show soon how to use multiple languages in one notebook), and your cluster should have come up by default. Click ‘Create’.

This will bring up your first Databricks notebook! A notebook as described by Databricks is “is a web-based interface to a document that contains runnable code, visualizations, and narrative text”. Each cell can be run individually, as if you were running separate SQL scripts in SSMS notebooks, or entering python commands into the command line. However, when you declare a variable, that variable is ‘set’ in the current context, across cells.
As is tradition, type in ‘print(“Hello World!”) in the first cell, and click ‘Shift + Enter’ to run the command. You should see the following output:

Notice that you are attached to the cluster you created, and you can switch clusters by dropping down the cluster tab. Code will not execute unless you are attached to a cluster.

Also, if you need to ‘reset’ the context of your current run because your variables got muddled, or something is giving an error and you think it is because you have run cells out of order, you can click ‘Detach & Re-attach’. This resets the state of the notebook as if you haven’t run any code.
Note that Databricks automatically saves versions of your code. You can still integrate with source control, but click ‘Revision history’ in the top right-hand corner to see your different versions:

Another great feature in Databricks is that you can run different languages all in the same notebook using ‘magic’ commands. This isn’t necessarily recommended for production jobs, but it works great for ad hoc analytics. Let’s try a SQL query on the table we created earlier by issuing the %sql magic command, and then running a standard select statement.
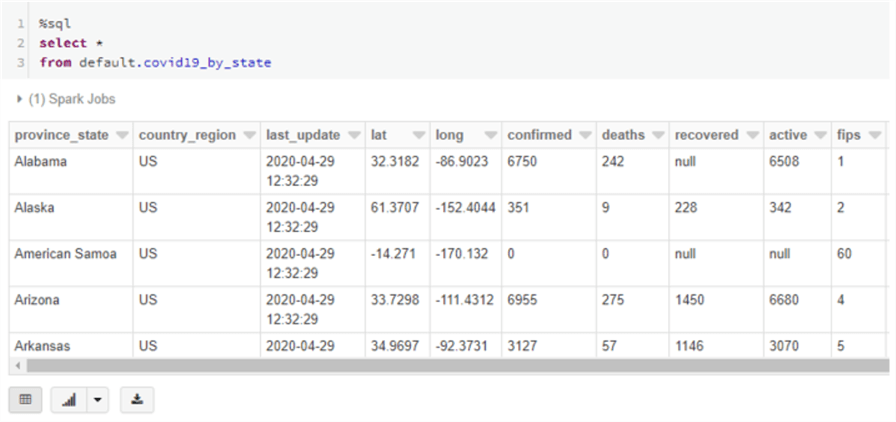
There is our data!
If you want to operate on data using the PySpark Dataframe API, you can bring the data into a Spark dataframe using the spark.sql python command:

We can also write more complex SQL to view aggregates, perform joins, etc. Spark SQL supports almost all ANSI compliant SQL syntax.

One ‘gotcha’ if you are coming from a TSQL world is that TOP is not supported. Instead, use LIMIT.
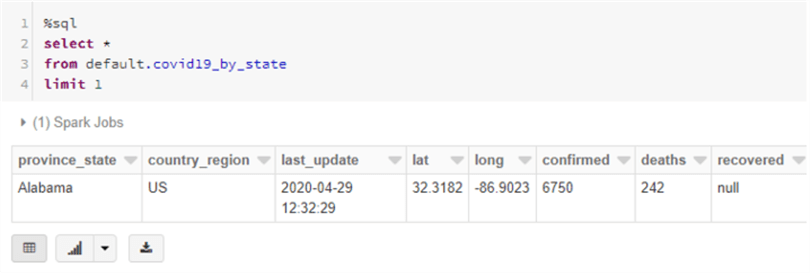
Play around with the data, and see what kind of interesting queries you can write, and what kind of data quality issues you might find.
Building a Simple Chart
Finally, lets create a simple chart using the data from this data set. First, re-run the select * script from before:

Next, click the bar chart icon in the bottom left hand corner:

Then, click ‘Plot Options’:
Select ‘Bar chart’ as the display type, move the ‘province_state’ field into the Key field, and the ‘recovered’ field into values, and click ‘Apply’.

Notice that the graph is hard to read, and probably contains more information than we want. Let’s modify our query, and take a look at the top 5 states that have had the most recoveries. We will notice there are some extra rows in here that we don’t want – such as regions outside the US, and one row that shows all recoveries for that region. Let’s filter those out in the WHERE clause. Once we modify the query and re-run it, we will see that the chart automatically refreshes:

Feel free to play around with the data / charts, and see what kind of visualizations you can come up with!
Next Steps
- Start an Azure trial and complete the above tutorial.
- Download your own data set of choice and analyze the data within Databricks.
- Connect Databricks to an external data store.
- Read other Databricks MSSQLTips:

Ryan Kennedy is a Solutions Architect for Databricks, specializing in helping clients build modern data platforms in the cloud that drive business results. He has worked with clients across industries, most extensively healthcare and insurance, to architect and build data solutions spanning the data fabric – from ingestion processes, data lakes, and data warehouses, to advanced analytics, visualizations, and BI. Ryan is Microsoft certified in Big Data and Data Science technologies, and is always looking to further his technical expertise. When not working on an exciting data project, you can find Ryan spending time with his wife or training for a triathlon.
- MSSQLTips Awards: Rookie of the Year – 2020