Problem
Please show how to use a sign test to assess if a series of paired observations are significantly different from each other. Provide all the code so that I can just run a script and get the result based on the sign test. Also, present the underlying logic of the test in terms of a binomial distribution and related issues such as computing factorial values so that I can gain a0 background for digging deeper into the test logic if I choose to.
Solution
A sign test is for assessing if a series of paired comparison measurements are significantly different. A typical use case is determining if a set of measurements, such as student grades, are statistically different in a before versus after measurement comparisons. You can also use the sign test to verify if performance scores are systematically more positive (or negative) for two different sets of observations, such as run times for two programs on different days of the week and/or times within a day. The sign test can additionally be used to assess if monthly percentage gains or losses are more positive for a stock symbol than for an industry benchmark, such as the S&P 500 index. Yet another use case is assessing if an observed service level is better than or equal to a minimum service level across a repeated set of observations.
An overview of the data for a sign test
A sign test aims to statistically assess if there are consistent differences at a statistically significant level between a set of paired observations. Each paired observation consists of two measurements and whether the sign of the difference between the measurements is positive or negative. If the measurements for any pair of observations has exactly the same value in both of its members, then it should be discarded because the sign test is only to determine if the differences are positive or negative. When the measurements are for a continuous variable, such as percentage change, weight, or height, you can typically avoid discarding ties by adding more precision to the measurements to break ties.
The following table image shows an example of a set of paired observations for a sign test. The measurements in each pair consists of a proportion representing the change in price from the first through the last trading date for a stock symbol over some period, such as April in the year 2020 for the first paired comparison. With this kind of data, you can assess if the proportions for the SOXL symbol are consistently larger than for the SPY symbol in the set of pairs. These data were collected through the middle of March in 2021. Therefore, all periods are for a full month of data, except for the last period, which is for a half month of data.
The column of values in the right-most column of the display below designates the sign of the difference for each pair. The value is 1 when the proportion for SOXL is more positive (or less negative) than the proportion for SPY. Otherwise, the value is 0. The values in this column are for the signs of differences in the proportions between the symbols in each pair. While the sign test is based on the relative size of the difference in the proportions for each pair, the sign test only assesses the consistency of the signs – not the magnitude of the values contributing to the signs.

An overview of the logic for a sign test
The precise question that the sign test seeks to answer is: What is that statistical probability of the combination of paired comparison results occurring by chance if the probability of a 1 or 0 in the right-most column is exactly .5 for any single paired comparison in the sample.
In understanding the logic for the sign test, it is helpful to grasp that each paired sample in the input for the sign test can be thought of as a Bernoulli trial. A Bernoulli trial can be operationalized by tossing a fair coin and recording a head as a success and tail as a failure. The input for the sign test consists of a collection of Bernoulli trials. A Bernoulli trial has an equal probability of success or failure for each toss of the coin. The order of the trials does not impact the probability of success or failure on any trial.
The binomial probability of obtaining s successes in t trials can be defined as the product of three terms
- The binomial coefficient is the count of the ways of getting s successes in t trials (sCt)
- The probability of s success in t trials is .5 raised to the power of s (.5s)
- The probability of t – s failures is .5 raised to the power of t less s (.5(t-s))
The binomial coefficient is the count of the number of s successes in t trials; it is often represented by a symbol in this format sCt. Its computation depends on factorial values, such as n! The expression for the binomial coefficient is t!/(s!(t-s)!).
- If the value of t equals 12, then t! = 12 x 11 x 10 x 9 x 8 x 7 x 6 x 5 x 4 x 3 x 2 x 1
- If the value of s equals 10, then s! = 10 x 9 x 8 x 7 x 6 x 5 x 4 x 3 x 2 x 1
- If the value of t equals 12 and the value of s equals 10, then sCt equals (t-s)! = 2 x 1
The factorial of a number only exists if the number is positive or 0; there are no factorial values for negative numbers. The factorial of 0 also merits special comment. In short, the factorial of 0 is 1. One way to understand this is to consider that the factorial of any positive number, such as n, is (n x (n-1)!). Therefore, if the n! for n = 1 equals 1, then 0! must also equal 1.
A user-defined scalar function to compute factorials
The following user-defined scalar function (dbo.factorial) properly computes factorial values ignoring edge conditions. For example, you can only pass @inumber parameter values to the function that are greater than or equal to 0 as well as not greater than 20.
- The dbo.factorial function uses the n x (n – 1)! definition for the value of n!. You can see this expression in the second set statement within the factorial function. The successive multiplications of declining (n-1)! values through 0 are implemented through recursion.
- The dbo.factorial function also handles the special case of 0! The value of 1 is assigned to this factorial in the first set statement.
- This function only works properly for n values in the range of 0 through 20, which is an ample range for the vast majority of sign test datasets.
- For negative values of n, the function returns a 217 error number when it encounters the maximum recursion value.
- For positive integer values greater than 20, the function returns an 8115 error number for a bigint arithmetic overflow.
Via the use keyword, the script below creates the dbo.factorial function in a database named DataScience. However, you can create the dbo.factorial function in any other database, your computing environment requires.
use DataScience
go

drop function if exists dbo.factorial
go

create function dbo.factorial ( @inumber int )
returns bigint
as
begin
declare @i bigint

    if @inumber = 0
        set @i = 1
    else
        set @i = @inumber * dbo.Factorial( @inumber - 1 )

return (@i)
end
go
The following script illustrates how to display output from the dbo.factorial user-defined function.
- The first several invocations of the dbo.factorial function computes factorial values for selected numbers in the range from 0 through 20.
- The final two invocations of the dbo.factorial function attempt to compute factorial values for -1 and 21 – both of which the dbo.factorial function does not process properly.
- The use of the go keyword starts a new batch after the SQL Server error resulting from the attempt to compute a factorial value for a negative number.
-- show sample results from dbo.factorial
declare @inumber int

-- factorial results for legitimate inputs
set @inumber = 0; select @inumber N, dbo.factorial(@inumber) [factorial value]
set @inumber = 1; select @inumber N, dbo.factorial(@inumber) [factorial value]
set @inumber = 2; select @inumber N, dbo.factorial(@inumber) [factorial value]
set @inumber = 3; select @inumber N, dbo.factorial(@inumber) [factorial value]
set @inumber = 9; select @inumber N, dbo.factorial(@inumber) [factorial value]
set @inumber = 10; select @inumber N, dbo.factorial(@inumber) [factorial value]
set @inumber = 20; select @inumber N, dbo.factorial(@inumber) [factorial value]

-- factorial results for illegitimate inputs
set @inumber = -1; select @inumber N, dbo.factorial(@inumber) [factorial value]
go
declare @inumber int
set @inumber = 21; select @inumber N, dbo.factorial(@inumber) [factorial value]
Here’s an image of the Results tab output from the preceding script.
- The output has two columns for each row – one named N and the other named factorial value.
- For rows with N values starting at 0 and continuing through 20 populate the factorial value column because they have N values that are in the range of legitimate values for the function.
- The bottom two rows have unpopulated N and factorial value column values because the N values for these rows have illegitimate input for the function (-1 and 21). Therefore, the function does not return a value for the rows, and the rows are unpopulated because SQL Server throws an error instead of computing a factorial value.
- The go keyword between the last row and the next-to-the-last row starts a new batch so that there can be one row of output for each row of input. Because the last row operates in a different batch than the preceding rows, it requires a fresh declare statement for the @inumber local variable.

As you can see, illegitimate N values cause the errors. Because the script does not account for illegitimate N values, you do not know without careful examination which N values are illegitimate. We can fix this problem by running the dbo.factorial function only for rows with legitimate values of N. Then, we can also show the illegitimate value for each row and assign NULL to the factorial value for rows with illegitimate values of N.
Here’s another user-defined function that performs the fixes for illegitimate values.
- The user-defined function (dbo.factorialfunction) starts by checking the input parameter value (@inumber) to verify if its input is valid for the code in the dbo.factorial function.
- Input rows with an illegitimate value of the input parameter value (less than 0 or greater than 20) have a null value assigned to the factorial value (@i).
- Otherwise, the dbo.factorial function assigns a value to the return (@i) for the user-defined function.
drop function if exists dbo.factorialfunction
go

create function dbo.factorialfunction ( @inumber int )
returns bigint
as
begin
declare @i bigint

   if @inumber < 0 or @inumber > 20
      set @i = NULL
   else
      set @i = (select dbo.factorial(@inumber))

return (@i)
end
go
Here’s a script for running the dbo.factorialfunction user-defined function as in the preceding example. The script is followed by its output to the SSMS Results tab.
- As you can see, there is no need for a go keyword between the last two rows with illegitimate input values for the dbo.factorial user-defined function.
- This is because neither of these last two rows results in the throwing of a SQL Server error. Instead, NULL is assigned to @i, the return value from the dbo.factorialfunction.
- Also, notice the legitimate values of N generate the same factorial values as in the preceding example.
-- show sample results from dbo.factorialfunction
declare @inumber int

-- factorial results for legitimate inputs
set @inumber = 0; select @inumber N, dbo.factorialfunction(@inumber) [factorial value]
set @inumber = 1; select @inumber N, dbo.factorialfunction(@inumber) [factorial value]
set @inumber = 2; select @inumber N, dbo.factorialfunction(@inumber) [factorial value]
set @inumber = 3; select @inumber N, dbo.factorialfunction(@inumber) [factorial value]
set @inumber = 9; select @inumber N, dbo.factorialfunction(@inumber) [factorial value]
set @inumber = 10; select @inumber N, dbo.factorialfunction(@inumber) [factorial value]
set @inumber = 20; select @inumber N, dbo.factorialfunction(@inumber) [factorial value]

-- factorial results for illegitimate inputs
set @inumber = -1; select @inumber N, dbo.factorialfunction(@inumber) [factorial value]
set @inumber = 21; select @inumber N, dbo.factorialfunction(@inumber) [factorial value]

The purpose of this tip section is merely to present code to compute factorial values that are representative of what you may need for typical sign test datasets and introduce you to at least one interesting feature of factorial values for combinatorial solutions. However, there are solutions for reporting factorials based on a larger base values than 20.
- Perhaps the easiest alternative solution is to convert the output from bigint to float. This alternative accommodates values to about n = 69.
- Wikipedia briefly discusses several approximations for very large values of n.
- Another approach is to find a table of published factorial values. You can save the values as string values if there is no computer-based numeric data type to represent the factorial values. Here’s a link to a table showing factorial values for n values up to 100. This same resource provides a calculator for factorial values up to an n of 170.
Code to implement a sign test
Now that we have a robust user-defined function for computing factorial values, we can demonstrate the steps for performing a sign test in SQL Server. There are three steps – each presented in a separate sub-section.
- The first sub-section focuses on populating a SQL Server table with a collection of Bernoulli trial results for a sign test.
- The second sub-section illustrates the process for calculating the elements for the binomial probability associated with the sign test.
- The third sub-section computes the binomial probability for the sign test and illustrates how to interpret its statistical significance.
Create and populate a dataset for a sign test
An example of a dataset for a sign test appears at the end of the “An overview of the data for a sign test” section. That dataset tracks successes of the SOXL symbol monthly close price percentage change exceeding SPY monthly close price percentage change. The use case for the sign test always enables the comparison of two sets of measurements on a set of entities.
This sub-section extends the “An overview of the data for a sign test” section dataset by not just reporting the comparisons, but by showing how to use T-SQL to create and populate a table with this kind of data. In particular, this sub-section presents and describes T-SQL code for comparing monthly performance percentage changes for the PYPL symbol relative to the SPY symbol. This tip’s download also includes comparable T-SQL code for returning the data presented in the “An overview of the data for a sign test” section.
There are three steps to the code segment below.
- It starts by dropping the SPYvsPYPL table if it already exists in the default schema.
- Next, it creates a fresh copy of the table.
- It concludes with an insert into statement that adds a set of twelve rows to the SPYvsPYPL table.
-- create and populate a fresh copy of SPYvsPYPL
-- for period from 2020-04-01 through 2021-13-15
drop table if exists SPYvsPYPL

create table SPYvsPYPL
(
start_date date not null,
end_date date not null,
SPY_Close_percent_gain real not null,
PYPL_Close_percent_gain real not null
)

insert into SPYvsPYPL
values
   ('4-1-2020', '4-30-2020',   0.127,   0.2847),
   ('5-1-2020','5-31-2020',    0.0476,  0.2602),
   ('6-1-2020','6-30-2020',    0.0133,  0.124 ),
   ('7-1-2020','7-31-2020',    0.0589,  0.1254),
   ('8-1-2020','8-31-2020',    0.0698,  0.0412),
   ('9-1-2020','9-30-2020',   -0.0413, -0.0348),
   ('10-1-2020','10-31-2020', -0.0249, -0.0553),
   ('11-1-2020','11-30-2020',  0.1088,  0.1504),
   ('12-1-2020','12-31-2020',  0.0326,  0.0938),
   ('1-1-2021','1-31-2021',   -0.0102,  0.0005),
   ('2-1-2021','2-28-2021',    0.0278,  0.109 ),
   ('3-1-2021','3-15-2021',    0.0409, -0.0406)
The next script shows queries of the SPYvsSOXL and SPYvsPYPL tables that add a new column to their results sets. The new column, named SUCCESS_OR_FAIL, has a value of
- SUCCESS when the close percentage change for the comparison symbol (either SOXL or PYPL) exceeds the close percentage change for the SPY symbol. The percentage change for the SPY symbol closely tracks monthly percentage change values for the S&P 500 index.
- FAIL when the close percentage change for either SOXL or PYPL is less than the close percentage change for SPY.
-- SPYvsPYPL and SPYvsSOXL SUCCESS_OR_FAIL results
-- Answers: does symbol rise more than SPY benchmark?
select
   *
   ,case
      WHEN SOXL_Close_percent_gain > SPY_Close_percent_gain then 'SUCCESS'
      ELSE 'FAIL'
    end SUCCESS_OR_FAIL
from SPYvsSOXL

select
   *
   ,case
      WHEN PYPL_Close_percent_gain > SPY_Close_percent_gain then 'SUCCESS'
      ELSE 'FAIL'
    end SUCCESS_OR_FAIL
   from SPYvsPYPL
Here are the results sets from each of the two select statements in the preceding script.
- The results showing in the top pane of the following screen shot is for the comparison of percentage change for the SOXL symbol versus the SPY benchmark symbol. The SOXL symbol has a more positive percentage change for 10 of 12 monthly comparisons.
- Results for the PYPL symbol appear in the bottom pane of the following screen shot. The PYPL symbol has a more positive percentage change for 9 of 12 monthly comparisons.

Calculate the elements for computing a binomial probability
After compiling the dataset for a sign test, you next need to perform the first of two remaining steps for the sign test. The first of these two steps is to perform some preliminary calculations on sign test dataset and save the calculated values in a table for re-use in the third step. These preliminary calculations allow you to perform the binomial probability for interpreting the statistical significance of the sign test outcomes shown in the preceding screen shot.
The preliminary calculated values are as follows for the sign test dataset:
- The number of Bernoulli trials (t)
- The number of successes(s) in the trials
- The number of failures (t_less_s) in the trials
- The factorial values for each of the preceding values (t_factorial , s_factorial, and t_less_s_factorial)
For every member of a collection of Bernoulli trials which comprises the dataset for a sign test dataset, there is a probability of success (p). This probability should typically be .5 for a sign test. This is for when all Bernoulli trials are analogous to a coin toss – the coin can show heads or tails after the toss. For the sign test, each paired comparison can show the first measurement larger than the second measurement or vice versa.
The second step also creates a table to store the preliminary calculated values along with the probability (p) of a success in each Bernoulli trial. The table’s name in the script below is Binomial_probability_calculator_for_sign_test. The table also has an additional set of four columns for values discussed in the next sub-section. Within the context of this tip, the table is populated with two rows – one for the PYPL symbol versus the SPY symbol and the other for the SOXL symbol versus the SPY symbol.
Here’s the script for creating the Binomial_probability_calculator_for_sign_test table and populating it with a row for each comparison of symbols.
- It begins by creating a fresh copy of the Binomial_probability_calculator_for_sign_test table. Notice that the p column has a default value of .5 assigned to it. This is the probability of a Bernoulli trial result with a SUCCESS or a FAIL outcome.
- Next, an insert statement followed by a select statement populates the remaining six preliminary values and a symbol value for a row in the Binomial_probability_calculator_for_sign_test table. These six preliminary values are calculated for the PYPL symbol.
- Immediately after the union statement in the script, analogous code for the second symbol (SOXL) calculates the six preliminary values for the second symbol.
- You can repeat the union operator and its subsequent code for as many other symbols as you require a sign test relative to a benchmark.
- The script segment ends with a select statement that shows the row values in the Binomial_probability_calculator_for_sign_test table.
-- create a table for storing values used to compute
-- the statistical significance of the outcomes in a sign test dataset
drop table if exists Binomial_probability_calculator_for_sign_test

create table Binomial_probability_calculator_for_sign_test
(
symbol varchar(10) not null,
s int not null,
t int not null,
t_less_s int not null,
s_factorial bigint not null,
t_factorial bigint not null,
t_less_s_factorial bigint not null,
p float default .5,
binomial_coeff int,
p_to_s_power float,
p_to_t_less_s_power float,
sPt float
)

-- compute and insert inputs for computing binomial probability
-- of s successes in t trials where the probability of
-- of success and failure per trial equals .5

insert Binomial_probability_calculator_for_sign_test
(
symbol,
s,
t,
t_less_s,
s_factorial,
t_factorial,
t_less_s_factorial
)

(
-- aggregate successes (s), trials (t), and t_less_s with factorials for SOXL
select
    symbol
   ,s
   ,t
   ,t_less_s
   ,(select dbo.factorial(s)) s_factorial
   ,(select dbo.factorial(t)) t_factorial
   ,(select dbo.factorial(t_less_s)) t_less_s_factorial
from
(
-- cross joined aggregate success and trial data with trials less successes
--factorials for SOXL
select
    symbol symbol
   ,successes s
   ,trials t
   ,(trials - successes) t_less_s
from(
select 'SOXL' 'SYMBOL', count(*) Successes
from
(
-- trial data
select
   *
   ,case
      WHEN SOXL_Close_percent_gain > SPY_Close_percent_gain then 'SUCCESS'
      ELSE 'FAIL'
    end SUCCESS_OR_FAIL
from SPYvsSOXL
) for_SUCCESS_COUNT_for_SOXL
group by SUCCESS_OR_FAIL
having SUCCESS_OR_FAIL = 'SUCCESS') for_aggregate_successes
cross join
(select count(*) trials from SPYvsSOXL) for_aggregate_trials
) for_aggregate_trials_with_factorials

union


-- aggregate successes (s), trials (t), and t_less_s with factorials for PYPL
select
    symbol
   ,s
   ,t
   ,t_less_s
   ,(select dbo.factorial(s)) s_factorial
   ,(select dbo.factorial(t)) t_factorial
   ,(select dbo.factorial(t_less_s)) t_less_s_factorial
from
(
-- cross joined aggregate success and trial data with trials less successes
--factorials for PYPL
select
   symbol symbol
   ,successes s
   ,trials t
   ,(trials - successes) t_less_s
from(
select 'PYPL' 'SYMBOL', count(*) Successes
from
(
-- trial data
select
   *
   ,case
      WHEN PYPL_Close_percent_gain > SPY_Close_percent_gain then 'SUCCESS'
      ELSE 'FAIL'
    end SUCCESS_OR_FAIL
from SPYvsPYPL
) for_SUCCESS_COUNT_for_PYPL
group by SUCCESS_OR_FAIL
having SUCCESS_OR_FAIL = 'SUCCESS') for_aggregate_successes
cross join
(select count(*) trials from SPYvsPYPL) for_aggregate_trials
) for_aggregate_trials_with_factorials
)

-- display preliminary results by symbol
select * from Binomial_probability_calculator_for_sign_test
Here’s the results set from the select statement in the last line of the preceding script. Notice there is a separate row for each symbol compared to the benchmark (SPY).
Computing and interpreting a binomial probability in a sign test
The statistical significance of the sign test is determined by the binomial probability (sPt) of obtaining s successes in t trials for the Bernoulli trial in each row of the of the sign test dataset. The binomial probability can be determined by the product of three terms (binomial coefficient, p to the s power, and p to the t_less_s power) defined and described in the “An overview of the logic for a sign test”. The following code in this sub-section shows how to compute each of three inputs to the binomial probability as well as the binomial probability value and then update the appropriate columns in the Binomial_probability_calculator_for_sign_test table. Here is the script to achieve these goals.
-- calculate and update binomial coefficient value
-- and other calculated fields for binomial probability (sPt)
update Binomial_probability_calculator_for_sign_test
set
    binomial_coeff = t_factorial/(s_factorial*t_less_s_factorial),
    p_to_s_power = power(p,s),
    p_to_t_less_s_power = power(p,t_less_s),
    sPt  =(t_factorial/(s_factorial*t_less_s_factorial)) * power(p,s) * power(p,t_less_s)

-- display final results by symbol
select * from
Binomial_probability_calculator_for_sign_test
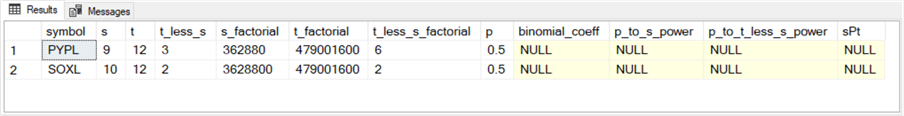
Here is the updated table from the preceding screen with values for the three computed terms and the binomial probability value for each of the two sign tests.
- The binomial probability of 9 successes in 12 trials for the PYPL symbol equals 0.0537…
- The binomial probability of 10 successes in 12 trials for the SOXL symbol equals 0.0161…
To determine if the binomial probability is statistically significant, you need to compare its computed value to a statistical significance level. There are three commonly used statistical significance levels.
- The .05 significance level may be the most widely used level; it means an outcome has no more than a 5 percent chance of happening even if it is not true.
- The .10 significance level, which is sometimes used, is a laxer level of statistical significance; it means an outcome has no more than a 10 percent chance of happening even if it is not true.
- The .01 significance level is a less lax level than the .05 significance level; it means an outcome has no more than a 1 percent chance of happening even if it is not true.
For those who care to dig more deeply into the topics of statistical significance levels and binomial probabilities here are two links that you may find useful for getting started (here and here).
The 9 successes in 12 trials for the PYPL symbol have no more than a 10 percent chance of happening even if it is not true. This is because the binomial probability for 9 successes in 12 trials with a sign test is equals 0.0537. The computed probability level exceeds the .05 statistical significance level but is less than the .10 significance level.
The 10 successes in 12 trials for the SOXL symbol have no more than a 5 percent chance of happening even if it is not true. This is because the computed binomial probability for the SOXL sign test trials is 0.0161. This computed probability is below the .05 statistical significance level but above the .01 statistical significance level.

Next Steps
- The download file for this tip contains create function statements for two user-defined functions. Run these statements before trying the three-step script for computing the binomial probability associated with a sign test. If you just run the script in the download file, you can confirm the operation of the code as described in this tip for your database environment (do not forget to update the database name if you are using a different database). If you have some paired comparison data that you want to assess via a sign test, replace the performance metrics data in the first step of the three-step script, with your own data. Then, interpret the results as significant or not at a designated significance level of your choice.

Rick Dobson is a SQL Server professional with decades of T-SQL experience that includes authoring books, running a national seminar practice, working for businesses on finance and healthcare development projects, and serving as a regular contributor to MSSQLTips.com. He has been a practicing Python developer for more than the past half decade – with a special emphasis for data visualization and ETL tasks with JSON and CSV files. His most recent professional passions include financial time series data and analyses, AI models, and statistics. If you are interested in growing your skills in any of these areas especially as they relate to financial securities, consider visiting his blog at https://securitytradinganalytics.blogspot.com/2023/12/.
- MSSQLTips Awards: Leadership (200+ tips) – 2025 | Author of the Year Contender – 2017-2024